
Wednesday, February 18, 2026 @ 4 PM Pacific Time At Make: we've cheered, and sometimes steered, two decades of rapid evolution in digital fabrication tools for home, hobby, and business use. But this year is an astonishing one. Make: Vol. 96 is all about the latest digital fabrication tools! Join us live as we talk […]
The post Make: Live - Inside Volume 96, The Digifab Issue appeared first on Make: DIY Projects and Ideas for Makers.

Framework's Laptop 13 isn't just a capable machine, but one you can repair and keep using indefinitely.
The post Review: Framework Laptop 13 appeared first on Make: DIY Projects and Ideas for Makers.

Robert Quattlebaum makes high-end interactive Lumanoi light sculptures from wood, acrylic, and custom circuitry.
The post Meet the Maker: Robert Quattlebaum of Lumanoi appeared first on Make: DIY Projects and Ideas for Makers.

What does a decade of dedicated makerspace programming in a public school district look like? Recently, we talked with Dain Elman, the Instructional Coach for STEM, makerspace teacher, and School Maker Faire coordinator at Gurnee District 56 Schools, about an hour north of Chicago near(ish) the Western shore of Lake Michigan. Gurnee District 56 is […]
The post How One Illinois District Keeps Its School Maker Faire Alive appeared first on Make: DIY Projects and Ideas for Makers.

School City of Hammond, a school district just south of Chicago on the Illinois border, launched its first Maker-Faire to come together and celebrate the skills of students and staff. The theme was to celebrate a season of making to welcome in the holiday and winter season and provide an opportunity for the community to […]
The post It's Always the "Season of Making" in Hammond appeared first on Make: DIY Projects and Ideas for Makers.

In a niche corner of the internet where creators still surprise audiences with real animatronics rather than CGI, Jesse Velez reveals the process behind the most impressive sci-fi props.
The post Flying High: Using Drones to Inspire the Future Leaders of STEM appeared first on Make: DIY Projects and Ideas for Makers.

Thursday, February 12, 2026 @ 4 PM Pacific Time Join Dale Dougherty and Steph Piper, author of the new Skill Seeker: Young Maker Edition activity and guide book, to explore how "skill trees" transform learning into a game that motivates young makers along their STEAM path. Inspire discovery in budding makers! "Skill trees" provide essential […]
The post Make: Live - Inspiring Young Makers with Steph Piper appeared first on Make: DIY Projects and Ideas for Makers.

Start turning wood with a 3D printer the long way, by printing this cheap lathe.
The post Turn It Up! 3D-Printed Wood Lathe appeared first on Make: DIY Projects and Ideas for Makers.

With the Elegoo Centauri Carbon, the ideal first 3D printer/daily workhorse has never been closer within reach!
The post Review: Elegoo Centauri Carbon is a Solid First 3D Printer appeared first on Make: DIY Projects and Ideas for Makers.
Huge thanks to my February sponsor, John Rember, author of the three-book series Journal of the Plague Years, a psychic survival guide for humanity's looming date with destiny, shaped by his experiences living through the pandemic in his native Idaho. Thoughtful, wry and humane, Journal 1 is a pleasure.
 "Central Asia's Water Tower to Lose One-third of Glacier Mass by 2040.
"Overall, the Tian Shan mountains are projected to lose about one-third of the area's glaciers before 2040, according to a recent study. Furthermore, scientists worry that it may get even worse depending on the climate scenario…"
 "Tajikistan to host major international conference on water security amid rising climate risks…
"Qodiri warned that growing water scarcity could escalate geopolitical tensions, with nations facing stark choices between cooperation or conflict over shared resources."
 "AN INSANITY BEYOND ANY IMAGINATION - CRAZY 24.4C [75.9F] AT 1420M ASL IN CENTRAL ASIAN RUSSIA (at Gunib).
"This is getting absurd and beyond what's though to be physically possible. And THIRD DAY WITH 30C in Central Asia - 30.7 Esenguly TURKMENISTAN record. and you know something ? The worst hasn't come yet."
https://x.com/extremetemps/status/2023788016272371850
 "CAUCASUS RECORD WARMTH. Another avalanche of records in this historic winter warmth:
"ARMENIA - 24.2 [75.6F] Meghri NATIONAL FEBRUARY RECORD, 18.0 Ashtarak, 15.2 Sisian; AZERBAIJAN - 27.0 Geokchay, 23.9 Zakatala, 22.2 Maraza, MINS: 13.7 Gyanja NATIONAL RECORD OF FEB HIGH MINIMUM. 12.6 Zakatala."
https://x.com/extremetemps/status/2024192374570684486
 "More than 7.5 million people in Pakistan are facing high levels of food insecurity and malnutrition following a year marked by heavy monsoon floods, prolonged droughts, dry spells and escalating violence.
"This is according to a new assessment released by the Integrated Food Security Phase Classification (IPC) global hunger monitoring system."
 "Sweat for survival? How long can India's informal labour bear the heat.
"Driven by global climate change and local environmental stresses, heatwaves are becoming more frequent, longer, and intense, especially in northern, central, and eastern India."
 "HISTORIC HEAT WAVE IN BANGLADESH.
"Another record heat wave in Bangladesh just like every single month of the past years. 35.0C [95F] Ramgamati. 34.9C Comilla - both are their hottest winter day ever. And the heat will get worse and worse every day. Expect record after record."
https://x.com/extremetemps/status/2024100114864935311
 "Smoke from Cambodian forest fires hits Buriram border villages.
"Residents along the Thai-Cambodian border in Buriram province have begun to feel the impact of forest fires burning on the Cambodian side, with smoke and airborne embers drifting into Thai communities, local officials said on 18 February 2026."
 "Forest fires worsen Chiang Mai's air quality on Wednesday morning [Thailand].
"Forest fires worsen air quality in Chiang Mai, pushing PM2.5 levels to unhealthy levels. Authorities report 182 hotspots in the region, with significant fire risks in southern districts… Due to drought, leaf fall has increased the fuel load, contributing to higher fire risks."
https://www.nationthailand.com/news/general/40062668
 "Torrential rains trigger widespread flooding in Grobogan [Indonesia].
"The disaster affected 42 villages across 10 districts, with water levels reported between 50 and 100 centimeters. Floodwaters also inundated 26 schools, more than 1,800 hectares of rice fields and severely damaged two houses."
 "Tragic Landslide Halts Nickel Operations in Sulawesi.
"A landslide at PT Indonesia Morowali Industrial Park in Sulawesi led to one worker's death and halted operations in a nickel processing hub. The incident occurred in a tailings area managed by PT QMB."
 "Endless record heat in INDONESIA.
"MINIMUM 27.3c [81.1F] at Manokwari has its hottest night in history in February broken for the 5th time in a few days after breaking the records of all months of the year multiple times each."
https://x.com/extremetemps/status/2024011922044006762
 "Extreme Heat, Drought Hit Jarrah Forests Hard.
"Western Australia's jarrah forests were unevenly impacted by the record-breaking 2023-2024 heatwave and subsequent drought, with some areas experiencing more severe tree die-off than others, according to a new study."
https://www.miragenews.com/extreme-heat-drought-hit-jarrah-forests-hard-1622609/
 "Intense heat waves directly threaten crops and native species [Australia].
"During Australia's unprecedented heat wave in late January, air temperatures reached 50°C in inland South Australia. Days of sustained heat and hot nights did real damage. A flying fox colony was all but wiped out in South Australia, while Western Australian mango growers suffered major crop losses as fruit literally boiled."
https://phys.org/news/2026-02-intense-threaten-crops-native-species.html
 "Argentina's pioneering glacier law on the line as Milei bets on copper rush.
"Argentine lawmakers are set to vote this week on government proposals to weaken a landmark law that bans mining on and around glaciers, days after President Javier Milei's libertarian administration signed a critical minerals supply deal with the US."
 "HISTORIC HEAT IN PARAGUAY.
"Record after record… The capital pulverized its February record of highest temperature in history again, while QuyQuyho broke it for the 6th time - 42.6 [108.7F] Asuncion, 41.4C Airport 42.0 Quyquyhó. Brutal heat also in ARGENTINA - 44.0C Rivadavia."
https://x.com/extremetemps/status/2024307140383609294
 "Heavy rain causes flooding in the capital and Greater São Paulo; video shows woman clinging to a lamppost after her car is swept away by the flood.
"According to the agency, the combination of heat and the arrival of the sea breeze favored the formation of unstable areas that caused heavy rain…"
 "Mudslide in Alausí, Chimborazo, leaves injuries and other damage after the rains [Ecuador].
"A mudslide in Alausí, Chimborazo , remains active and under constant monitoring by emergency agencies following the intense rains recorded on February 18, 2026. Risk management officials reported on the human and material damage."
 "Insane summer temperatures in MEXICO - >40C [104F] at 1000m asl; >30C at 2500m asl - this would be a summer heat wave.
"FEBRUARY RECORDS - 33.6C Saltillo 1800m, 31.0C Tlaxcala 2224m. Tomorrow Texas can hit 100F!"
https://x.com/extremetemps/status/2024312762764316952
 "Wildfires rage across Oklahoma as conditions worsen.
"Gov. Kevin Stitt declared a state of emergency for all three affected counties Wednesday morning. He said two more local task forces would be deployed to Beaver County. The National Weather Service has issued a Red Flag Warning for nearly the entire state, except the southeast corner."
https://www.kosu.org/local-news/2026-02-18/wildfires-rage-across-oklahoma-as-conditions-worsen
 "70+ MPH Winds Trigger Deadly 30-Car Pileup In Colorado.
"Blinding winds whipped up a wall of dust on I-25 near Pueblo, triggering a deadly chain-reaction crash involving more than 30 vehicles… At least four people have been killed according to preliminary reports. Twenty-nine others have been transported to nearby hospitals…"
https://weather.com/news/weather/news/2026-02-17-i-25-crash-colorado-dust-storm
 "The seven Colorado River basin states missed a key federal deadline to reach a new water usage agreement, and the U.S. Bureau of Reclamation is now likely to impose a solution of its own…
"Meanwhile, the key reservoirs of Lake Mead and Lake Powell are at critically low levels and continue to drop."
 "Snow drought helped set the stage for deadly California avalanche, leading to unstable conditions…
"The new snow did not have time to bond to the earlier layer before the avalanche near Lake Tahoe killed at least eight backcountry skiers, said Craig Clements, a meteorology professor at San Jose State University, who has conducted avalanche research."
 "Despite La Niña, record warm winter wrapping up…
"For both Oregon and Washington, the two-month period of December to January was the warmest in 131 years of record-keeping… Washington's snowpack is only 51% of average, according to the Natural Resources Conservation Service. Oregon's is even smaller, 30% of normal."
https://chinookobserver.com/2026/02/18/despite-la-nina-record-warm-winter-wrapping-up/
 "Climate change and persistent contaminants deliver one‑two punch to Arctic seals, study finds.
"New research shows a single year of warmer-than-average Arctic temperatures can cause malnutrition in Arctic seals, intensifying risks to Inuit food security and northern ecosystems already under pressure from environmental toxins, warn Simon Fraser University researchers."
https://phys.org/news/2026-02-climate-persistent-contaminants-onetwo-arctic.html
 "Thousands of Alien Species Could Invade the Arctic, Scientists Warn.
"More than 2,500 alien plant species could find suitable conditions in the Arctic, especially in northern Norway and Svalbard. Researchers used massive biodiversity datasets to map risk areas and improve early detection efforts."
https://scitechdaily.com/thousands-of-alien-species-could-invade-the-arctic-scientists-warn/
 "Naval shipwreck emerges in Sweden after being submerged for 400 years.
"A 17th century Swedish Navy shipwreck buried underwater in central Stockholm for 400 years has suddenly become visible due to unusually [actually record] low Baltic Sea levels, marking the latest centuries-old vessel to be found in the country's waters."
https://www.cbsnews.com/amp/news/navy-shipwreck-emerges-baltic-sea-sweden/
 "UK Banks Face New Era of Mortgage Risk as Flood Damage Soars.
"As the prospect of flood damage haunts an ever larger number of UK homes, the country's banks are under growing pressure to prove they're not underestimating the risk in their mortgage books."
 "The longest unbroken spell of rainy days recorded by University of Reading meteorologists ended on Tuesday after 37 consecutive days.
"The university's Atmospheric Observatory said 17 February was the first day without measurable rainfall in the town since 11 January."
https://www.bbc.co.uk/news/articles/c4g28dwlz1eo
 "Thousands of puffins starve to death during storms.
"Thousands of dead seabirds have washed up on the south west coast, Channel Islands and French beaches, a wildlife trust has said. The majority of the birds are puffins which had become starved and exhausted due to not being able to feed during the recent storms."
https://www.bbc.co.uk/news/articles/cz0g1l847ygo
 "Man missing in Loire River as record rains lash France.
"A man has gone missing after his canoe capsized on the swollen Loire River as severe flooding hit western France, officials said Wednesday, while the country marked a record-breaking 35 [now 36] consecutive days of rainfall."
https://www.france24.com/en/france/20260218-man-missing-loire-river-record-rains-lash-france
 "Widespread damage has been recorded in south-west France after Storm Pedro passed through overnight.
"Trees were uprooted and branches felled amid powerful winds… In Rochefort (Charente-Maritime) uprooted trees fell on parked cars, and gales of over 130 km/h [80mph] were recorded along the coastal areas of Île d'Oléron."
 "Avalanches, 88 ski deaths and a train crash: Why Europe's mountains are proving so dangerous this winter…
"Weather conditions across the Alps have produced perfect conditions for huge slides, often triggered by just a single skier. But beyond that, researchers warn that climate change is also having an impact on the frequency of avalanches."
https://www.independent.co.uk/news/world/europe/avalanches-alps-deaths-europe-ski-snow-b2922799.html
 "Climate Change Opens the Door for Painful Chikungunya Disease to Spread Across Europe.
"Researchers found that in countries such as Spain, Portugal, Italy and Greece, conditions now allow chikungunya infections for more than half the year. In parts of western and central Europe, including France, Germany, Belgium and Switzerland, transmission could occur for several months annually."
 "A major study has confirmed that the flash flooding that devastated Valencia in 2024 was 'intensified' by human-made climate change.
"Spain is still desperately trying to heal its wounds and understand exactly what went wrong almost two years after one of its worst floods in history."
 "Severe Storms Batter Western Greece.
"Severe weather is sweeping across parts of Greece, triggering floods, landslides and widespread damage to roads, homes and businesses, while several communities remain cut off and some areas have been placed under a state of emergency."
https://www.tovima.com/society/severe-storms-batter-western-greece/
 "Record heat again in Gabon:
"Exceptional 36.2C [97.2F] yesterday at Franceville, a hill town in the interior of the country HOTTEST DAY IN HISTORY (over 1 century of data). Gabon has been breaking and rebreaking records every month for years, multiple times each month."
https://x.com/extremetemps/status/2023716966415098338
 "While the rainy season is being unusually cool in Botswana, Zambia and Zimbabwe, South Africa is like a factory of heat waves:
"Record hot day yesterday in the Southwest: HOTTEST FEBRUARY DAY 39.2 [102.6F] Kirstenbosch, 34.2 Cape Point. HOTTEST FEBRUARY NIGHT Mins: 23.9 Riversdale, 21.9 George."
https://x.com/extremetemps/status/2023737530445709425
 "'Let them shower in hotels': Johannesburg Premier faces backlash amid water crisis…
"Some Johannesburg residents haven't had a drop of water for more than three weeks straight: forced to travel to get water from municipal tankers and washing with buckets. Schools and hospitals are also affected."
 "Somalia's disaster agency warns of worsening drought.
"The drought has devastated crops and livestock across Somalia, forcing local authorities and aid agencies to call for urgent assistance. Moalim urged the Somali government and international partners to act quickly to provide relief…"
https://shabellemedia.com/somalias-disaster-agency-warns-of-worsening-drought/
 "From Pakistan Floods to California Drought: Climate Risks Shake the Cotton Industry.
"The weather is no longer just small talk—it has become an unpredictable force reshaping global industries. Climate volatility is increasingly affecting farmers, textile manufacturers and brands, disrupting supply chains and challenging long-term planning."
 "Rice emerges as the biggest source of farm emissions worldwide.
"In 2020, global cropland emissions reached 2.5 billion tons of carbon dioxide equivalent… Nearly half of that total came from East Asia and the Pacific, and rice alone accounted for 43 percent of global cropland emissions."
https://www.earth.com/news/rice-emerges-as-the-biggest-source-of-farm-emissions-worldwide/
 "Scientists warn flowering-stage heat stress could devastate wheat production…
"New research suggests that short periods of extreme heat and drought at this critical stage of development could become one of the biggest threats to wheat production in the decades ahead. Flowering is the stage when wheat plants set grain, making it crucial in determining final yield and overall harvest size."
 "Rising temperatures threaten coffee yields worldwide…
"Brazil, Vietnam, Colombia, Ethiopia and Indonesia - which supply 75% of the world's coffee - experienced on average 57 additional days of temperatures exceeding the threshold of 30 degrees Celsius (86 degrees Fahrenheit)."
 "An El Niño is brewing…
"…prepare for bedlam… The impact of this new warming surge will be especially profound because this El Niño will probably provide the final proof that global warming is actually accelerating sickeningly from its previously merely alarming pace."
https://billmckibben.substack.com/p/an-el-nino-is-brewing
 "El Niño update: Warm water is now surfacing in the eastern Pacific near Ecuador and Peru — and there's a lot more coming.
"Subsurface waters are 3˚C to 5˚C above-average in the western and central Pacific. That warmth is headed east and will probably fuel an El Niño Costero." [Ben Noll]
https://x.com/BenNollWeather/status/2024144377422233627
 "No Wall Will Be High Enough to Keep Climate Refugees Out…
"The tropics and Southern hemisphere will be worst affected by rising heat prompting desperate climate refugees to defy immigration barriers and travel north into the United States and Western Europe."
I rely on donations and tips from my readers to keep the site running. Every little bit helps. Can you chip in even a dollar? Buy me a coffee or become a Patreon supporter. A huge thank you to those who do subscribe or donate.
You can read the previous "Climate" thread here. I'll be back tomorrow with an "Economic" thread.
The post 19th February 2026 Today's Round-Up of Climate News appeared first on Climate and Economy.
Plastic production has doubled over the last 20 years - and will likely double again. For author Beth Gardiner, metal water bottles and canvas tote bags are not the solution. So what is?
Like many of us who are mindful of our plastic consumption, Beth Gardiner would take her own bags to the supermarket and be annoyed whenever she forgot to do so. Out without her refillable bottle, she would avoid buying bottled water. "Here I am, in my own little life, worrying about that and trying to use less plastic," she says. Then she read an article in this newspaper, just over eight years ago, and discovered that fossil fuel companies had ploughed more than $180bn (£130bn) into plastic plants in the US since 2010. "It was a kick in the teeth," says Gardiner. "You're telling me that while I am beating myself up because I forgot to bring my water bottle, all these huge oil companies are pouring billions …" She looks appalled. "It was just such a shock."
Two months before that piece was published, a photograph of a seahorse clinging to a plastic cotton bud had gone viral; two years before that England followed Wales, Scotland and Northern Ireland and introduced a charge for carrier bags. "I was one of so many people who were trying to use less plastic - and it just felt like such a moment of revelation: these companies are, on the contrary, increasing production and wanting to push [plastic use] up and up." Then, says Gardiner, as she started researching her book Plastic Inc: Big Oil, Big Money and the Plan to Trash our Future, "it only becomes more shocking."
Continue reading...MotoGP to roar into the city streets of Adelaide from 2027
MotoGP has confirmed that the Australian Grand Prix will move to the Adelaide Street Circuit from 2027, marking a first-of-its-kind event for the sport
MotoGP Sports Entertainment Group, the South Australian Government and the City of Adelaide announced that the Australian Grand Prix will be hosted on a city centre circuit in Adelaide from 2027.
The six‑year agreement begins next season and will see MotoGP race at the Adelaide Street Circuit until 2032 inclusive. This landmark event will be the first MotoGP Grand Prix to be held in a city‑centre location - with the uncompromised safety standards required in the modern era of the sport.
The circuit layout was unveiled in Adelaide on Thursday 19 February in front of national media by MotoGP Chief Sporting Officer Carlos Ezpeleta and Premier of South Australia Peter Malinauskas.
It was confirmed that the inaugural Australian GP in Adelaide will be held across three days in November 2027. The circuit will be approximately 4.195 km long with 18 corners winding through the city streets, enabling riders to reach speeds of more than 340 km/h.
The track design follows the blueprint of the famous Adelaide Street Circuit that hosted Formula 1 events between 1985 and 1995, with the significant adjustments required to ensure rider safety remains the number‑one priority.
The city's layout, culture and passion for major events make Adelaide the perfect home for a premium, festival‑style urban Grand Prix - providing a unique opportunity to elevate the fan experience to a new level.
MotoGP Chief Sporting Officer, Carlos Ezpeleta, said: "Bringing MotoGP to Adelaide marks a major milestone in the evolution of our championship. This city has a world‑class reputation for hosting major sporting events, and the opportunity to design a purpose‑built circuit in the city streets is something truly unique in our sport.
"From the very beginning, together with the FIM, we made sure that safety remained uncompromised - every element of the Adelaide Street Circuit has been engineered to meet the highest standards of modern MotoGP, ensuring riders can race at full intensity with complete confidence.
"Adelaide's commitment to major events makes it the perfect home for MotoGP's next chapter in Australia. We're incredibly excited to showcase a new style of racing here and to create a true celebration of our sport that brings fans even closer to the action.
"This partnership represents bold ambition from both MotoGP and Australia - and we couldn't be prouder to begin this journey together."
The Premier of South Australia, Peter Malinauskas, added: "This is a major coup for South Australia and yet more evidence our state has real momentum. "We are now competing with the rest of the nation for the world's best events - and winning. Hosting the world's first MotoGP race on a street circuit will give Adelaide a truly unique offering that is sure to attract visitors from interstate and overseas.
"This is about so much more than a world‑class motorsport event - it's about generating economic activity for our state, supporting jobs, and putting South Australia on the global stage.
"We back major events that deliver a strong economic return, and MotoGP does exactly that. MotoGP is growing globally at record pace - and Adelaide will now be a key part of that growth story."
More information regarding the event will be released in due course.
The post MotoGP Replacing Phillip Island With Street Circuit in 2027 appeared first on Roadracing World Magazine | Motorcycle Riding, Racing & Tech News.
Portable Bluetooth speakers have become an easy default for listening away from your desk or living room. They're the kind of tech you grab without thinking, whether you're heading outside, cleaning the house or packing for a weekend away. The best portable options manage to sound bigger than they look, delivering clear audio without weighing down your bag.
Battery life and durability matter just as much as sound quality now. Many modern speakers are built to survive splashes, dust and the occasional drop, while still offering quick pairing and stable connections. Some are designed for solo listening, others are meant to fill a space with music and keep going for hours.
We've tested a wide mix of portable Bluetooth speakers to see which ones are actually worth carrying around. Whether you want something small and simple or a speaker that can anchor a get-together, these are the models that stood out.
Best portable Bluetooth speakers: $200 to $450
Best portable Bluetooth speakers: $450 and higher
Factors to consider in a portable Bluetooth speaker Weather-proofing
IP ratings (Ingress Protection) are the alphanumeric indicators you often see in a product's spec sheet that define water and dust resistance. It's usually a combo of two numbers with the first indicating solid object ingress and the second being water. The former goes from 0 (no protection) to 6 (dustproof). The water-resistance rating goes from 0 (no protection) to 9 (protected against immersion and high pressure jets). When an X is used instead of a number, that means the product wasn't tested for resistance. If it's a waterproof speaker, it may have some innate resistance to solids, but there's no guarantee.
IP67 is a common rating these days indicating highly resistant and potentially rugged speakers often featured in audio products like outdoor speakers. These are safe for quick dunks in the pool or tub and should be more than OK in the rain or in the shower. They're also good options for the beach, playground and other rough environs.
Additionally, speakers with ports and a high rating will often include a tight-fitting cover over the charging or auxiliary ports. If you plan on using the ports, that may limit the product's rated ability to fend off the elements.
When looking for the best portable Bluetooth speaker, consider the IP rating and also how you plan to use your Bluetooth speaker when making your decision. It may be worth splurging on a better sounding model with a lower IP rating if you'll mostly be using it indoors, for instance.
Battery lifeThe focus of this guide is on the best portable speakers, and while "portable" can be a relative term, these devices are generally for people who are likely to find themselves far from a power outlet. These days, around 12 hours of playtime seems to be the baseline but obviously, the more battery life you can get out of a speaker, the better, especially if you plan to listen to podcasts or music on the go.
That said, be careful when looking at battery specs, as they frequently list a maximum runtime ("up to" x amount of hours). This usually means they tested at a low to mid volume. If you like your tunes loud with punchy bass, it can often end up cutting the expected usage time in half or more. Luckily, some manufacturers also list the expected hours of battery life when used at full volume and that transparency is appreciated. Bear in mind, however, that not all of the best Bluetooth speakers use the same charging port. Some support USB-C charging, while others use micro-USB, and some may even come with an adapter for added convenience.
Additionally, if your audio system or mini Bluetooth speaker also happens to have Wi-Fi connectivity, they're usually designed for always-on functionality. Unlike normal Bluetooth speakers that go to sleep after a short period without use, these will usually stay awake (to listen for your commands) and slowly run down the battery. If you're out and about, you'll want to remember to turn these speakers off manually when not in use to maximize battery life.
RangeBluetooth 5 offers better range and more reliable connectivity than its predecessors, making it a great feature to look for in the best Bluetooth speaker. That said, Bluetooth range can still be tricky. Some companies list their product's longest possible range, usually outdoors and in an unobstructed line-of-sight test environment. Other companies stick with a 30-foot range on the spec sheet and leave it at that, even though they may be running Bluetooth 4.x or 5.x. That's likely underselling the speaker's potential, but unpredictable environments can affect range and there's little point in promising the moon only to get complaints.
I've seen signal drop issues when crouching down, with my phone in the front pocket of my jeans, and barely 30 feet away from a speaker inside my apartment. I ran into this issue across several devices regardless of their listed Bluetooth connectivity range.
If you're hosting a patio party and duck inside, it's wise to keep any wireless Bluetooth speakers relatively close by just in case. It's hard to gauge what aspects of any environment may interfere with a Bluetooth signal. In general, take range specs around 100 feet or more as a perfect-world scenario.
LatencyThis is a minor mention for those out there who use a speaker for their computer output, or as a mini Bluetooth soundbar solution for setups like a monitor and streaming box. It's annoying to find that your speaker's latency isn't low enough to avoid lip sync issues. Luckily, it seems that most speakers these days don't often have these problems. Only a handful of the few dozen speakers I tried had persistent, noticeable lip-sync issues. Aside from occasional blips, all of our picks worked well in this regard.
If you plan to frequently use a speaker for video playback, look for devices with the most recent Bluetooth 5 technology and lower latency codecs like aptX. Also make sure the speaker is close to the source device as distance can be a factor. To avoid the issue altogether, though, consider getting one with a wired auxiliary input.
Extra featuresSome speakers don't just play music — they bring the party to life with built-in LED light effects and a full-on light show that syncs to your music. If you love a bit of visual flair with your tunes, it's worth checking out models that offer LED light customization options.
Sound quality also plays a huge role in picking the right speaker. The best Bluetooth speaker should deliver a balanced mix of punchy bass, clear highs and strong vocals. Many models also include customizable sound modes that let you tweak the EQ to better suit different genres — whether you're blasting EDM, listening to a podcast, or just want a more immersive experience that would impress even an audiophile.
If aesthetics matter, many models come in a tiny size that makes them extra portable, with plenty of color options to match your personal style. Whether you want a sleek black speaker or a vibrant eye-catching design, there are plenty of choices to fit your vibe.
Other portable Bluetooth speakers we tested Sonos RoamWhile there's a lot to like about the Sonos Roam, there are plenty of other Bluetooth speakers with more features and better battery life. In our review, we gave the Roam a score of 87, praising it for its good sound quality, durable waterproof design and ability to work well within an existing Sonos speaker ecosystem. But the price is just fine at $180, and we found Bluetooth speakers that offer more at lower price points. Plus, the Roam taps out at 10 hours of battery life, and all of our top picks can run for longer than that on a single charge.
Monoprice Soundstage3The Monoprice Soundstage3 offers relatively big sound at a midrange $250 price, with a variety of inputs rarely found on a portable Bluetooth speaker. The boxy, minimalist design is no nonsense, even if it's more of a less-rugged, bookshelf-styled homebody. While the speaker puts out crisp highs alongside booming lows, we found the bass can overpower the rest of the output, so it's not for everyone. And after using the speaker for many months, we also found the low-slung, poorly labeled button panel along the top can be a bit annoying to use. If you want a speaker for road trips, favor mids and highs, and plan on using physical buttons for volume control and input selections, there are better options out there.
JBL Boombox 3Fans of JBL's bluetooth speaker sound profile who want to crank up the volume, but also want a rugged and portable option, may enjoy the JBL Boombox 3. It's a decent grab-and-go speaker with a very loud output, although it's not as good as some of the loud-speaker styled options for long-throw sound and big outdoor areas. However, the price for this speaker line remains prohibitively expensive compared to other options with big sound that cover a bit more ground. If the JBL brand is your thing and you like the rugged, portable form factor, we recommend looking for discounts, or shopping around and exploring the available options including the (less portable) JBL PartyBox series.
Soundcore Motion X500Soundcore speakers have generally been good and often reasonably priced. The Motion X500 loosely falls into that category. It has a tall, metallic lunchbox vibe with a fixed handle and pumps out a respectable 40 watts of crisp, clear sound for its size. It can get pretty loud and serves up a good dose of bass, although its primarily a front-facing speaker.
There's LDAC hi-res audio support for Android users, but the main selling point on this is spatial audio. This is done through an EQ change and the activation of a small, up-firing driver. There's a slight benefit from this if you're up close and directly in front of it, but it's not a total game changer for your listening experience. The original pre-order price of $130 made it a decent option in terms of bang for your buck. But it went up to $170 at launch, making it less appealing even if it's still a good middle-of-the-road option if you want small-ish, clear and loud. If you can find one on sale for the lower price, it's definitely worth considering. There's also the larger and louder X600 ($200) if the overall concept is working for you.
Portable Bluetooth speaker FAQs How does a Bluetooth speaker work?Bluetooth technology lets devices connect and exchange data over short distances using ultra high frequency (UHF) radio waves. It's the frequency range that's carved out for industrial, scientific and medical purposes, called the 2.4GHz ISM spectrum band. This range is available worldwide, making it easy for companies to use with devices for global markets.
Bluetooth speakers include this tech, which lets them communicate with source devices like smartphones, tablets or computers in order to exchange data. The two devices pair by sharing a unique code and will work within the proscribed range for the device and Bluetooth version.
Ever since Bluetooth 4.0 was released over a decade ago, new iterations usually improve on range, use less power and offer expanded connectivity with features like multipoint (allowing more than one device to be connected at the same time, for instance).
Who should buy a Portable Bluetooth speaker?If you want to play music while you're out-and-about on something other than headphones, a portable Bluetooth speaker is probably what you want. There's a broad range of devices for all types of circumstances. Many adventurous people will want a relatively lightweight portable that's rugged enough to handle the elements while also packing enough charge to play for hours on end. Others may simply need a speaker they can move around the house or use in the backyard. In this case, you can choose larger less rugged models that may offer better sound.
This article originally appeared on Engadget at https://www.engadget.com/audio/speakers/best-portable-bluetooth-speakers-133004551.html?src=rssArtificial intelligence chatbots can be too chatty when answering questions on government services, swamping accurate information and making mistakes if told to be more concise, according to research.…
Interview Twenty-five years after 17 software developers gathered at a Utah ski resort to draft the the Agile Manifesto, artificial intelligence is once again reshaping how code gets written.…
A new agreement has been signed between Brembo and WorldSBK, with the braking system manufacturer becoming the Championship's Innovation Partner
laaps-records.com Happy Thursday, friends. Last year, I managed to put together only a handful of mixes, and, as usual, I found myself wondering whether it was still worth the time and energy. That's a conversation we can finally have properly now, over on Headphone Community. But for all the self-questioning, some rituals are too important to abandon. Today marks the arrival of the 18th…

Introduction: White Christian Nationalism and a Collapsing Civilization
America is experiencing a dangerous convergence of white Christian nationalism, authoritarian politics, and ecological disintegration that increasingly fits the contours of a soft fascism intertwined with late-stage industrial collapse. Far from standing outside this project, the Trump administration is deeply embedded in, and dependent on, white Christian nationalist networks: movement pastors, media ecosystems, and ideological think tanks that provide both its most reliable voters and its most disciplined institutional foot soldiers. Senior officials, judicial nominees, and agency heads have routinely been drawn from circles that preach a divinely mandated social order—patriarchal, heteronormative, and white—and that frame Trump himself as a providential instrument chosen to "restore" Christian America.
This essay should be read as Part Two of a broader analysis begun in "America's Oligarchic Techno‑Feudal Elite Are Attempting to Build a Twenty‑First‑Century Fascist State," which traced how oligarchs, Big Tech platforms, and security bureaucracies are constructing the material and institutional architecture of a new fascist order. Where that first essay mapped the class, technological, and carceral infrastructure of emergent techno‑feudal fascism, the present essay examines the complementary religious and cultural superstructure: how white Christian nationalism supplies the mythic narrative, moral cover, and mobilized base that allow this oligarchic system to consolidate power.
This fusion is not an aberration but an expression of deeper civilizational crisis: a political project to lock in racial-religious hierarchy and fossil-fueled growth precisely as the material basis of that order erodes. As industrial modernity runs up against ecological limits, and as decades of inequality hollow out democratic legitimacy, white Christian nationalism offers the regime a way to convert fear and precarity into loyalty—sanctifying extraction, demonizing pluralism, and recoding authoritarian measures as necessary acts of spiritual and national defense.
Defining white Christian nationalism and its fascist drift
White Christian nationalism is a political-religious ideology that claims the United States was founded as, and must remain, a Christian nation defined by whiteness, patriarchy, and a mythic past of cultural homogeneity. It is not simply "strong faith" or generic conservatism; it is a set of beliefs that link America's identity and legitimacy to a particular white, conservative, Christian order, and that treat deviation from that order as existential threat.
Core features typically include:
-
The myth that America was uniquely chosen by God and must be "restored" to its supposed Christian roots.
-
Idealization of patriarchal families and rigid gender roles.
-
Hostility to pluralism, immigration, and religious diversity.
-
Preference for authoritarian "law and order" and acceptance of state violence.
-
Deep suspicion of science, education, and independent media.
When compared to standard descriptions of fascism—mythic past, cult of victimhood, strongman leader, glorification of violence, and anti-pluralist nationalism—the overlaps are stark. Christian nationalist ideology strongly predicts support for a demagogic leader, acceptance of political violence, and rejection of democratic constraints, leading theologians and scholars to argue that "Christian nationalism" in the United States increasingly functions as a form of Christian fascism or "Christofascism."
Importantly, Lerone A. Martin's The Gospel of J. Edgar Hoover: How the FBI Aided and Abetted the Rise of White Christian Nationalism demonstrates that this fusion of militant nationalism and conservative Christianity is not new. Martin shows that, in the mid‑twentieth century, FBI director J. Edgar Hoover consciously fused anti‑communism, white supremacy, patriarchy, and biblical literalism into a civil religion he called "Americanism"—a white Christian nationalist vision in which the United States was "fundamentally a Christian nation" whose survival depended on preserving a racialized, gendered moral order. Hoover and the FBI, he argues, were "central to postwar religion and politics" and actively partnered with leading white evangelicals to make white Christian nationalism a legitimate and powerful force in American public life.
Seen through Hoover's "stained glass window," contemporary white Christian fascism appears not as a sudden deformation of an otherwise healthy evangelical tradition, but as the latest iteration of a much longer project in which state security power and white evangelical networks have marched together to defend a mythic Christian America.
Hoover's gospel of Americanism: a prehistory of Trump's Christian state
Martin's archival work reveals that the FBI under Hoover functioned as an early prototype of a Christianized security state. Hoover considered the United States divinely chosen, treated the Declaration and Constitution as quasi‑scripture, and defined "Americanism" as a fusion of citizenship, law, and conservative Protestant morality. To obey dominant social customs was to serve God; to dissent was both heresy and sedition.
Hoover built the FBI in his own image: an all‑white, male force of "Christian soldiers and ministers" whose federal duty, he told them, was to defend and perpetuate the nation's "Christian endowment." Agents attended FBI retreats and worship services led by sympathetic clergy; internal culture presented the Bureau as a quasi‑church charged with defending America's soul from subversives. Hoover's white Christian nationalism rejected theological hair‑splitting in favor of a broad, unified white Christian order: conservative Protestants and Catholics alike were to be mobilized as guardians of a Christian nation.
Modern white evangelicalism, Martin argues, did not stand apart from this project; it was shaped by it. Institutions like Christianity Today, the National Association of Evangelicals, and major white evangelical broadcasters forged close partnerships with Hoover, who published essays in their outlets (often with taxpayer support), lent them the prestige of the security state, and helped funnel evangelical college graduates into federal posts. Pastors preached Hoover's writings from the pulpit; laypeople used them in Bible studies. For many white evangelicals, Hoover functioned as "bishop" and "crusader," adjudicating which clergy were legitimate and which were dangerous radicals, and policing the boundaries of acceptable Christian politics.
Hoover's FBI also vigorously targeted civil-rights leaders and movements as subversive, equating demands for desegregation and voting rights with communist conspiracy. King, Fannie Lou Hamer, Dorothy Day, and others were framed not as prophets of justice but as enemies of Christian America. At the same time, Hoover and his allies promoted a supposedly "moderate" evangelical stance that rejected both "extremists on the right and the left," while materially reinforcing segregation and opposing civil-rights legislation. The pattern is highly familiar: egalitarian demands are recoded as existential threats to a fragile, divinely favored nation, and state repression is sanctified as defense of order.
In this light, the Trump administration's fusion of white evangelical networks, policing, and domestic intelligence looks less like a radical innovation and more like an intensification of a long‑standing structural arrangement: security agencies and white evangelicals acting as co‑custodians of a racialized Christian order.
The Trump administration and the Christian nationalist base
Within this historical frame, the present regime's dependence on white Christian nationalism is easier to see. The contemporary Republican coalition has been hollowed out to its core base: white Christian nationalists, including large segments of white evangelicals and conservative Catholics, whose political identity is bound up with a vision of America as a white Christian nation under siege.
The Trump years have seen:
-
Judicial appointments drawn heavily from networks that view law as an instrument for restoring traditional Christian morality and dismantling reproductive, LGBTQ+, and civil‑rights gains.
-
Executive policies crafted in close consultation with Christian nationalist think tanks and legal advocacy groups, from attacks on church-state separation to efforts to redefine religious "liberty" as the power to discriminate.
-
Cabinet‑level officials openly framing their work as carrying out God's will, and describing Trump as a Cyrus‑like figure raised up by God despite his flaws to rebuild Christian America.
This is the populist, religious face of what my first essay traces on the oligarchic and techno‑feudal side. Big donors, fossil‑fuel interests, and digital platform oligarchs provide the financial and technological skeleton; white Christian nationalism provides the flesh and spirit.
How white Christian fascism functions
White Christian fascism in America is best understood as a governing project that fuses racial hierarchy, authoritarian state power, and religious legitimation in the context of a declining industrial empire. It operates across at least four dimensions: myth, hierarchy, institutions, and theology.
Mythic past and sacred nationChristian nationalists sacralize an imaginary past in which America was homogeneous, virtuous, and governed by godly white men. That myth erases Indigenous genocide, slavery, and the long struggle of Black, Indigenous, and other marginalized communities to force the republic to honor its stated ideals. It presents civil-rights, feminist, queer, and immigrant movements not as democratic corrections but as incursions against a once‑pure order.
Hoover's Americanism was an early, powerful articulation of this myth: he explicitly described the Founders as divinely guided men who built a Christian republic, and warned that abandoning Christian foundations would mean national extinction. Today's Christian nationalists echo that narrative almost verbatim, casting pluralism and secularism as death sentences for America's God‑ordained role.
Strongman, hierarchy, and violenceWhite Christian nationalism strongly predicts support for strongman leaders, even when their personal lives starkly contradict basic Christian ethics. In both the Hoover and Trump eras, this has taken the form of "amoral pragmatism": religious leaders publicly proclaiming the importance of virtue while blessing, and even sacralizing, leaders whose actual conduct is lawless, cruel, and corrupt, so long as they deliver policy wins that entrench the desired order.
Hoover's admirers knew he ordered unlawful break‑ins, surveillance, and disinformation campaigns; court cases and leaks made this public. Yet white evangelicals dedicated stained‑glass windows to him, invoked him from their pulpits, and treated his word as near‑gospel. The same pattern holds today with a leader who boasts of sexual assault, incites political violence, and openly undermines the rule of law, yet is hailed as God's chosen instrument. The underlying logic is fascist: law, morality, and truth are subordinated to the leader's mission to protect the nation and its divine mandate.
Institutional capture and legal revolutionMy first essay details how oligarchic networks, tech platforms, and security agencies are being retooled to serve an emergent techno‑feudal order. White Christian fascism intersects with that process by targeting key institutions—courts, civil service, education, media—and either capturing them outright or delegitimizing them in the eyes of the base.
Hoover's FBI offers a mid‑century template. The Bureau became both arbiter and enforcer of acceptable religion and politics, channeling state resources to favored evangelical actors while surveilling and sabotaging those it deemed subversive. Evangelical elites, in turn, used federal power and Hoover's blessing to elevate their own institutions and marginalize liberal mainline Protestantism and radical Black Christianity.
Today's Project‑style blueprints generalize this approach: purge the civil service of non‑ideological professionals; stock agencies with loyalists; weaponize law enforcement and intelligence against perceived enemies; defund or undermine regulatory and rights‑enforcing bodies; and reshape education and culture in a Christian nationalist image. Elections and courts still formally exist, but real power increasingly resides in a single, interlocking bloc of Republican officials, state institutions, and white Christian nationalist organizations acting together as one ruling apparatus.
The theological pivot: salvation through dominationMartin emphasizes that white evangelicalism's core problem is not that it was "corrupted" by politics in the 1970s, but that its postwar form was always deeply entangled with white Christian nationalism. Salvation, for many adherents, has long been linked to preserving a specific social order: white supremacy, patriarchy, heteronormativity (the assumption that heterosexual, gender‑conforming relationships are the only normal standard), militarized anti‑communism, and capitalist property relations (laws and norms that treat private ownership by the wealthy as sacrosanct and organize society around protecting it).
Hoover's theology made this explicit. Liberty, he argued, required virtue; virtue was defined as obedience to traditional Christian norms; and the state's role was to cultivate virtuous souls and crush subversive tendencies. In that framework, civil-rights activism, feminist agitation, or radical economic demands become spiritual threats; suppressing them is not just political prudence but holy duty. Modern white Christian fascism inherits this political theology and extends it into every battleground: race, gender, sexuality, schooling, borders, and ecology.
Ecological crisis and the politics of denial
White Christian fascism does not merely coexist with ecological crisis; it feeds on it and deepens it. The same worldview that sacralizes human dominion and rigid hierarchy tends to deny ecological limits and delegitimize climate science.
Certain strands of evangelical and Christian nationalist belief—end‑times expectation, providential protection, and distrust of secular institutions—predict strong resistance to climate action. If God has a secret timetable for the world's end, or has promised never again to destroy the earth, then secular warnings about anthropogenic collapse can be dismissed as arrogance or deception. In this view, calls for decarbonization, degrowth, or global cooperation appear not as necessary survival strategies but as plots against God's people.
Moreover, white Christian nationalism is tightly intertwined with fossil capitalism. Christian nationalist politicians and donors routinely defend extractive industries as both economic necessity and divine gift, and denounce environmental regulation as an attack on prosperity and liberty. Fossil‑fueled abundance becomes part of the mythic past to which they promise to return, even as the ecological consequences of that abundance accelerate climate chaos, heat waves, fires, and resource conflicts.
This is where my two essays lock together: the oligarchic techno‑feudal elite seeks to preserve its power and lifestyle in a world of tightening ecological and economic constraints; white Christian fascism provides the moral narrative and mobilized base that makes this preservation project politically viable. Together, they generate sacrificial zones—regions, communities, and species written off as the cost of doing business—and cast the resulting suffering as either necessary discipline or regrettable but acceptable collateral damage.
Authoritarian drift as symptom of civilizational decline
Multiple analyses now frame America's authoritarian slide as part of a wider pattern of civilizational stress: rising inequality, energy and resource limits, ecological overshoot, and institutional decay. In this view, white Christian fascism is both a political project and a psychosocial response to the crumbling of modern industrial civilization.
Modern industrial society relies on dense networks of energy, finance, logistics, governance, and ecological stability. As energy returns decline, supply chains fray, diseases spread, and climate shocks intensify, these systems become brittle. The post‑war promise—that each generation will be better off than the last, that growth will solve conflicts, that liberal democracy can mediate class struggle—no longer matches lived reality.
Under such conditions, democratic politics becomes dangerous to entrenched elites. Electorates might embrace redistributive, decolonizing, or eco‑socialist programs that would shift power downward and constrain profit. Faced with this prospect, segments of capital and aligned political actors invest in authoritarian solutions: border walls, camps, paramilitary policing, and the slow erasure of democratic constraints.
White Christian nationalism offers these actors a ready‑made story: the crisis is not caused by fossil capitalism, globalization, or oligarchic plunder, but by moral decay, demographic change, and rebellion against God's order. The remedy is not redistribution and ecological repair, but repentance, purification, and strongman rule. In that sense, white Christian fascism is one plausible "endgame" ideology for a collapsing industrial empire: it justifies using the last surplus of energy and capacity not to build a just transition, but to fortify an unequal order through violence.
America as epicenter of intertwined collapse
Because of its military reach, carbon footprint, financial centrality, and cultural influence, the United States is a key node in the global system. When it embraces white Christian fascism at the very moment when cooperation, humility, and scientific literacy are most needed, it amplifies global risk.
Domestically, the movement undermines core pillars of the republic: free and fair elections, independent institutions, pluralism, and equal protection. It normalizes selective law enforcement, camps, and paramilitary policing. It teaches a large segment of the population to view fellow citizens—especially migrants, Muslims, Black activists, queer people, and environmentalists—as enemies of God who may legitimately be surveilled, dispossessed, or expelled.
Internationally, the same movement pulls the U.S. out of multilateral agreements, undermines climate diplomacy, and aligns it with illiberal regimes. This weakens collective responses to war, displacement, pandemics, and climate disruption, while emboldening reactionary forces elsewhere.
In ecological terms, a white Christian nationalist superpower committed to fossil extraction and hostile to climate science is a planetary hazard. In spiritual terms, it represents a tragic inversion of the best possibilities within the Christian tradition: instead of grounding humility, solidarity, and care for creation, the faith is harnessed to domination, denial, and cruelty.
Countercurrents and possibilities
The picture is bleak, but not static. The same Christian tradition being weaponized for fascism also contains strong counter‑traditions of prophetic dissent, liberation theology, ecological humility, and solidarity with the oppressed. Figures like James Talarico—an evangelical seminarian challenging Christian nationalism as idolatry and betrayal of Jesus's teachings—stand in a lineage that includes Black freedom‑church preachers, peace‑church radicals, and feminist and queer theologians.
Martin's work suggests that any serious attempt to confront white Christian fascism must be historically and institutionally literate. It is not enough to decry "politicized religion" in the abstract; the long alliance between security agencies and white evangelicalism must be named, interrogated, and unwound. Likewise, white evangelicals seeking to "exorcise the demons" of nationalism must grapple with the fact that their movement's modern foundations were laid, in part, through partnership with Hoover's FBI and its extralegal violence.
In tandem, my two essays sketch the contours of this challenge. The first maps the oligarchic techno‑feudal superstructure; the second exposes the white Christian nationalist super‑ideology that animates and stabilizes it. Together, they argue that resisting twenty‑first‑century fascism requires not only institutional reforms and economic restructuring, but also a profound struggle over myths, theologies, and moral imaginations at the end of an industrial empire.
References
Freedom From Religion Foundation. "Evangelical Climate Change Denial Is Killing Our Planet." September 19, 2024. https://ffrf.org/news/releases/evangelical-climate-change-denial-is-killing-our-planet/.
Heather Cox Richardson. "This Week in Politics | Explainer." February 18, 2026. https://www.youtube.com/watch?v=zp6q6sT0HQQ&t=1768s
Heyward, Carter. "Christofascism Is Everyone's Problem." Texas Observer, November 2, 2022. https://www.texasobserver.org/carter-heyward-white-christian-nationalism-book/.
Jemar Tisby. "It Can Happen Here: The Links Between White Christian Nationalism and Fascism." The Witness, April 26, 2023. https://jemartisby.substack.com/p/heres-how-white-christian-nationalism.
Martin, Lerone A. The Gospel of J. Edgar Hoover: How the FBI Aided and Abetted the Rise of White Christian Nationalism. Princeton, NJ: Princeton University Press, 2023. https://press.princeton.edu/books/hardcover/9780691175119/the-gospel-of-j-edgar-hoover.
Public Religion Research Institute. "The Faith Factor in Climate Change: How Religion Impacts American Attitudes on Climate and Environmental Policy." May 14, 2025. https://prri.org/research/the-faith-factor-in-climate-change-how-religion-impacts-american-attitudes-on-climate-and-environmental-policy/.
Pew Research Center. "Involvement by Religious Groups in Debates over Climate Change." November 16, 2022. https://www.pewresearch.org/religion/2022/11/17/sidebar-involvement-by-religious-groups-in-debates-over-climate-change/.
Stanford Humanities and Sciences. "The Gospel of J. Edgar Hoover: How the FBI Aided and Abetted the Rise of White Christian Nationalism - Lerone A. Martin." March 27, 2023. https://humsci.stanford.edu/feature/gospel-j-edgar-hoover-how-fbi-aided-and-abetted-rise-white-christian-nationalism-lerone.
Talarico, James. "Transcript: Rep. James Talarico on Confronting Christian Nationalism." Dan I. Smart (Substack), February 17, 2026. https://danismart.substack.com/p/transcript-rep-james-talarico-on.
Transnational Institute. "The Rise of Global Reactionary Authoritarianism." February 2, 2026. https://www.tni.org/en/article/the-rise-of-global-reactionary-authoritarianism.
Transnational Institute. "Follow the Money: The Business Interests Behind the Far Right." February 2, 2026. https://www.tni.org/en/article/follow-the-money-the-business-interests-behind-the-far-right.
Yale Center for Faith and Culture. "Violence, Fascism, and Christian Nationalism." April 16, 2025. https://faith.yale.edu/media/violence-fascism-and-christian-nationalism.

Probably needs a more anarchistic typeface. Something hand-lettered, maybe
Pershore is a small market town in Worcestershire and one of several fictional candidates for Borchester in The Archers. It's not quite in the Cotswolds, more the Vale of Evesham, a floodably fertile plain much favoured by market gardeners (as we saw yesterday). The river hereabouts is the Avon, as in Stratford-upon-, which was very much overspilling earlier in the week and thus limiting exploration potential somewhat. But I still got around to see many of the town's finest features, most of which you could list under the headings 'abbey', 'river' and 'Georgian'. [Visit Pershore] [town map] [18 photos]

abbey
Pershore's Saxon monastery got the full Abbey upgrade in the 12th century when the Normans piled in. Alas the building suffered several subsequent catastrophes including two fires, the collapse of the north transept and Henry VIII, so what's left is a stunted building that ought to be larger. The tower was saved by local townspeople after the Dissolution, also the quire where the monks sang which was reformulated into a nave, also the south transept. But the surviving chunk is still impressive enough and also free to wander round, that is once you've stopped admiring it from outside.

The nave has intricate ploughshare vaulting, also carved stone roof bosses which would look even more splendid had the Victorians not decided to 'clean' them by washing off the brightly coloured paint. The transept has effigy-topped tombs of abbots and crusaders nobody's quite sure of the name of. The bookstall has a particularly wide collection of cards for 80th, 90th and 100th birthdays, though not 20ths and 30ths hinting at the age of the congregation. The truly unique feature interior is the bell-ringing platform which is a cube-shaped chamber suspended 30m off the ground inside the tower, propped up only by four horizontal supports. It was added by George Gilbert Scott and can only be accessed via two spiral staircases, a walkway through the roof, a squeeze through a narrow passage and a see-through iron staircase down into the cage. Safer to just look up.

The abbey is surrounded by Pershore's only proper park and watched over by an iron horse. The Warhorse Memorial Sculpture was created by a local blacksmith, is made from recycled horseshoes is meant as a tribute to all the fallen animals across two worldwide conflicts. It was unveiled in 2019 (in pouring rain) and since then Armistice ceremonies have also been attended by a lot of poppy-clad folk on horseback. A few other sculptures are scattered around the wider site, my favourite being Peter Inchbald's two-sided Moon Goddess in St Andrew's Gardens (even if I'm not sure how the lunar disc can have a crescent hole).
river
The Avon rules life in Pershore which is why you can't see it from the town centre. Locals worked out centuries ago it was safest to live on the slightly higher land alongside and let their long gardens stretch down to the river because it didn't matter if they flooded. Pershore is also the sole bridging point for miles, the earliest wooden crossing finally replaced in stone in the 15th century after the Abbot got washed away and drowned. The five-arched sandstone bridge is a rare medieval survivor, although the central span had to be rebuilt after Royalist troops ineptly destroyed it while fleeing from Parliamentarians during the Civil War. The narrow span proved increasingly impractical for road traffic so a proper concrete span was built alongside in 1926, but you can still walk across the jaggedy original as a short deviation from the main road. Even during flooding, blimey.

I once passed under this bridge on a canal boat but you couldn't possibly do that at the moment because river levels are too high. Instead I watched an inexorable flow of brown water rushing through the central arch with maybe a metre's headroom, and understood why additional 'flood arches' had been built to either side to help ease peak flow. Normally this is a peaceful picnic spot with a footpath leading out across the meadows, and whilst the tables remained safely dry the path was a washout with substantial bankside undergrowth submerged beneath the water. It got worse than this in 2024 and far worse in 2007, the Avon occasionally capable of regional paralysis. But even at current levels the adjacent bridges at Eckington and Fladbury become impassable, and the Environment Agency employ flap-down yellow signs in the town centre to point to the diversions.

It could be worse were it not for the Avon Meadows Community Wetland a mile upriver. After the floods in 2007 additional water storage was carved out of the grass and several large reed beds dug as part of one of the UK's first urban sustainable drainage schemes. Not only does it do its job but it looks good too, doubles as a nature reserve and is intriguing to explore. I reached the boardwalk without too much trouble, stepping out through head-high reeds past a pair of inquisitive swans and a dipping pool. But the ground beyond was sodden, then decidedly underwater, so best come any time other than a wet winter if you want to see the river's edge where it should be, at its best.
Georgian
Pershore brands itself as a Georgian town and retains a very impressive run of period houses down the main street. They kick off abruptly by the Toll House on Bridge Street, where carts and coaches were once charged sixpence to cross the Avon if they were drawn by three horses, and which is currently on the market for £¼m. Further up the road The Star is a former coaching inn, The Angel contains salty Tudor boating timbers and The Brandy Cask used to be a wool warehouse. One of the most unusual buildings used to be The Three Tuns Hotel, hence the twiddly Regency ironwork, and has a plaque saying the future Queen Victoria stayed here overnight in 1830. It's now the town's most metropolitan pub and has been renamed after Claude Choules, the oldest combat veteran of the First World War, who was born in Bridge Street in 1901 and died in Australia at the record-breaking age of 110.

Some of the finer buildings don't have quite the pedigree you'd expect. The local arts centre (called Number 8) was created inside the innards of the former Co-op and now has raked seating. The Town Hall doesn't dazzle because it was originally commissioned as a post office, which to be fair is a decent size when you're only administering to a population of of 8500. Upstairs is where you'll find the town's museum, the Pershore Heritage Centre, although it only opens between Easter and October so I never got to see the Diamond Jubilee spade, the model train cabinet or the Titanic survivor's hat. But possibly the greatest surprise is that the large Georgian townhouse at the very start of Bridge Street is the home of former punkstress Toyah Willcox.

The Birmingham-born singer first grew to love the area when her parents bought a boat at nearby Wyre Marina, spending most of their weekends afloat. She moved here properly in 2002 along with husband Robert Fripp, King Crimson's offbeat guitarist, and has been known to kayak round her back garden if the river's high enough. You can catch a glimpse inside their quirky home by watching some of the couple's effusive Sunday lunch videos, seemingly recorded in the kitchen. Nobody can say It's A Mystery why she bought this pivotal property, it's because she loves living bang opposite the heart of a genuine market town. Alas these days Broad Street only looks like a marketplace once a month when stalls replace the usual stripe of car park so I didn't see it at its best, also the temporary traffic lights outside Tesco led to far too many queueing vehicles in many of my photographs.
Wychavon
Pershore is the administrative centre of Wychavon, largest and most southeasterly of the six Worcestershire districts. Though the town's much smaller than Droitwich and Evesham it's also more central, hence the council decided to build their Civic Centre here in 1991. With local government reorganisation imminent Wychavon's days are numbered, and I wonder how long it'll take this quirky name to disappear off signs, buildings and bins.

plums
Dip into the basket of market garden produce and you'll find Pershore is best known for its plums. Legend says a publican called George Crook discovered the famous Yellow Egg plum while walking through Tiddesley Woods in 1827 and within a few years it was being farmed widely in the area. Then in 1877 a Diamond/Prolific cross created the Pershore Purple, and these days a multitude of varieties are grown locally. Several plum-themed pubs and tearooms can be found in the town, but to get truly stoned best visit on August Bank Holiday weekend to experience the annual Plum Festival at which the mascots Prunella (purple) and Eggbert (yellow) invariably make an appearance.
station
Pershore station is a big disappointment, a single track halt served by hourly trains whose buildings were all demolished in the 1960s before the line was ultimately reprieved. It's also a mile and a half from the town centre with barely any bus connections, indeed officially in the neighbouring village of Pinvin, and surrounded not by houses but a large industrial estate. On the bright side it has a nice heritage sign in bold block capitals and Sir John Betjeman once wrote a poem about it, but otherwise substandard in every way.
» 18 photos of Pershore on Flickr
I've lived through many internet ages. In each stage of where the internet evolves and where humans spend their time, businesses and political actors step in and try to "game the system" for their benefit. It's not all about eyeballs and money, but, eventually, that's almost always what anything popular ... [continued]
The post Hacking AI — In Simple Ways — To Spread Misinformation appeared first on CleanTechnica.
Yes, he betrayed the national interest in his dealings with Jeffrey Epstein - but also in his sanctioned role as enabler of corporate power
History is being rewritten. The story we are told is that an evil man called Peter Mandelson, pursuing his own interests, went rogue to collaborate with a serial abuser of girls and women, undermining the good work of people seeking to defend the public interest. All this is true. But - and I fear many will find this hard to accept - it is only half the story.
The much harder truth is that Mandelson's disgraceful dealings with Jeffrey Epstein were less a betrayal of his brief than an unauthorised extension of it. In 2009 - just as, we now know, Mandelson was passing sensitive information to Epstein - I argued that the government department he ran, called Business, Enterprise and Regulatory Reform (Berr), "functions as a fifth column within government, working for corporations to undermine democracy and the public interest".
George Monbiot is a Guardian columnist
Do you have an opinion on the issues raised in this article? If you would like to submit a response of up to 300 words by email to be considered for publication in our letters section, please click here.
Continue reading...Starmer could improve our unfair electoral system to stop the hard right, but he won't. All the party has left are threats about 'splitting the vote'
Don't let the Labour party say one more word about "splitting the vote", in the forthcoming byelection or at any other time. With proportional representation, no one would ever need to worry about splitting the vote again. No one would need to choose the lesser evil to keep the greater evil out of office. We could vote for the parties we actually wanted. But the Labour government won't hear of it. It insists we retain the unfair, ridiculous first-past-the-post system, then blames us for the likely results.
This is not because proportional representation is unpopular - far from it. Last year's British Social Attitudes survey showed that 36% of people want to keep the electoral system as it is, while 60% want to change it. But as we are not allowed to vote on how we should vote, the decision is left in the hands of the corrupt old system's beneficiaries.
George Monbiot is a Guardian columnist
Continue reading...It took an FOI request to bring this national security assessment to light. For 'doomsayers' like us, it is the ultimate vindication
I know it's almost impossible to turn your eyes away from the Trump show, but that's the point. His antics, ever-grosser and more preposterous, are designed to keep him in our minds, to crowd out other issues. His insatiable craving for attention is a global-threat multiplier. You can't help wondering whether there's anything he wouldn't do to dominate the headlines.
But we must tear ourselves away from the spectacle, for there are other threats just as critical that also require our attention. Just because you're not hearing about them doesn't mean they've gone away.
George Monbiot is a Guardian columnist
Continue reading...There are many excuses for failing to tax the ultra-wealthy. The truth is that governments don't tackle the problem because they don't want to
There is one political problem from which all others follow. It is the major cause of Donald Trump, of Nigel Farage, of the shocking weakness of their opponents, of the polarisation tearing societies apart, of the devastation of the living world. It is simply stated: the extreme wealth of a small number of people.
It can also be quantified. The World Inequality Report (WIR) 2026 shows that about 56,000 people - 0.001% of the global population - corral three times more wealth than the poorest half of humanity. They afflict almost every country. In the UK, for example, 50 families hold more wealth than 50% of the population combined.
George Monbiot is a Guardian columnist
Continue reading...The three remaining hunger strikers have been convicted of nothing. Yet with astonishing cruelty, ministers refuse to listen to their reasonable demands
They are far into the lethal zone. Three people who are being held in prison on charges connected with the protest group Palestine Action have been on hunger strike for 45, 59 and 66 days. A fourth prisoner, Teuta Hoxha, ended her strike this week, after 58 days. She could suffer lifelong health effects. The remaining strikers, Heba Muraisi, Kamran Ahmed and Lewie Chiaramello, could pass away at any time. The 10 IRA and INLA hunger strikers who died in 1981 survived for between 46 and 73 days. Muraisi, whose strike has lasted the longest, is, according to supporters, now struggling to breathe and suffering uncontrollable muscle spasms - possible signs of neurological damage. Yet the government refuses to engage.
It created this situation. The Crown Prosecution Service states that the maximum time a prisoner can spend on remand is 182 days (six months). Yet Muraisi and Ahmed were arrested in November 2024, and are not due to be tried until June at the earliest, which means they will be remanded for 20 months. Chiaramello, who was arrested in July 2025, has a provisional court date in January 2027, which means 18 months in prison without trial.
George Monbiot is a Guardian columnist
Do you have an opinion on the issues raised in this article? If you would like to submit a response of up to 300 words by email to be considered for publication in our letters section, please click here.
Continue reading...From merrily dismissing climate science, to promoting irresponsible health claims, the podcast was an unintentional warning for our times
Looking back on this crazy year, one event, right at the start, seems to me to encapsulate the whole. In January, recording his podcast in a studio in Austin, Texas, the host, Joe Rogan, and the actor Mel Gibson merrily dissed climate science. At the same time, about 1,200 miles away in California, Gibson's $14m home was being incinerated in the Palisades wildfire. In this and other respects, their discussion could be seen as prefiguring the entire 12 months.
The loss of his house hadn't been confirmed at the time of the interview, but Gibson said his son had just sent him "a video of my neighbourhood, and it's in flames. It looks like an inferno." According to World Weather Attribution, January's fires in California were made significantly more likely by climate breakdown. Factors such as the extreme lack of rainfall and stronger winds made such fires both more likely to happen and more intense than they would have been without human-caused global heating.
Continue reading...European legislators may ban plant-based products from using the name to prevent 'confusion'. Just don't mention beef tomatoes or buffalo wings
Most of what you eat is sausages. I mean, if we're going to get literal about it. Sausage derives from the Latin salsicus, which means "seasoned with salt". You might think of a sausage as a simple thing, but on this reading it is everything and nothing, a Borgesian meta-concept that retreats as you approach it.
From another perspective, a sausage is an offal-filled intestine, or the macerated parts of an electrocuted or asphyxiated pig or other animal - generally parts that you wouldn't knowingly eat - mixed with other ingredients that, in isolation, you might consider inedible. For some reason, it is seldom marketed as such.
Continue reading...Plummeting birth rates mean that without attracting immigration, many countries are sliding towards collapse
I know what "civilisational erasure" looks like: I've seen the graph. The European Commission published it in March. It's a chart of total fertility rate: the average number of children born per woman. After a minor bump over the past 20 years, the EU rate appears to be declining once more, and now stands at 1.38. The UK's is 1.44. A population's replacement rate is 2.1. You may or may not see this as a disaster, but the maths doesn't care what you think. We are gliding, as if by gravitational force, towards the ground.
Civilisational erasure is the term the Trump administration used in its new national security strategy, published last week. It claimed that immigration, among other factors, will result in the destruction of European civilisation. In reality, without immigration there will be no Europe, no civilisation and no one left to argue about it.
Continue reading...I knew that a revolution in our understanding of soil could change the world. Then came a eureka moment - and the birth of the Earth Rover Program
It felt like walking up a mountain during a temperature inversion. You struggle through fog so dense you can scarcely see where you're going. Suddenly, you break through the top of the cloud, and the world is laid out before you. It was that rare and remarkable thing: a eureka moment.
For the past three years, I'd been struggling with a big and frustrating problem. In researching my book Regenesis, I'd been working closely with Iain Tolhurst (Tolly), a pioneering farmer who had pulled off something extraordinary. Almost everywhere, high-yield farming means major environmental harm, due to the amount of fertiliser, pesticides and (sometimes) irrigation water and deep ploughing required. Most farms with apparently small environmental impacts produce low yields. This, in reality, means high impacts, as more land is needed to produce a given amount of food. But Tolly has found the holy grail of agriculture: high and rising yields with minimal environmental harm.
George Monbiot is a Guardian columnist
Continue reading...The case of a planned Cumbrian coalmine shows how governments around the world are being threatened by litigation in shadowy offshore courts
How do you reckon our political system works? Perhaps something like this. We elect MPs. They vote on bills. If a majority is achieved, the bills becomes law. The law is upheld by the courts. End of story. Well, that's how it used to work. No longer.
Today, foreign corporations, or the oligarchs who own them, can sue governments for the laws they pass, at offshore tribunals composed of corporate lawyers. The cases are held in secret. Unlike our courts, these tribunals allow no right of appeal or judicial review. You or I cannot take a case to them, nor can our government, or even businesses based in this country. They are open only to corporations based overseas.
George Monbiot is a Guardian columnist
Continue reading...Climate sceptics tell us that more people die of extreme cold than extreme heat. What's the truth?
I began by trying to discover whether or not a widespread belief was true. In doing so, I tripped across something even bigger: an index of the world's indifference. I already knew that by burning fossil fuels, gorging on meat and dairy, and failing to make even simple changes, the rich world imposes a massive burden of disaster, displacement and death on people whose responsibility for the climate crisis is minimal. What I've now stumbled into is the vast black hole of our ignorance about these impacts.
What I wanted to discover was whether it's true that nine times as many of the world's people die of cold than of heat. The figure is often used by people who want to delay climate action: if we do nothing, some maintain, fewer will die. Of course, they gloss over all the other impacts of climate breakdown: the storms, floods, droughts, fires, crop failures, disease and sea level rise. But is this claim, at least, correct?
George Monbiot is a Guardian columnist
Continue reading...The fundamental problem is this: that most of the means of communication are owned or influenced by the very rich
If this were just a climate crisis, we would fix it. The technology, money and strategies have all been at hand for years. What stifles effective action is a deadly conjunction: the climate crisis running headlong into the epistemic crisis.
An epistemic crisis is a crisis in the production and delivery of knowledge. It's about what we know and how we know it, what we agree to be true and what we identify as false. We face, alongside a global threat to our life-support systems, a global threat to our knowledge-support systems.
George Monbiot is a Guardian columnist
Continue reading...Money talks - and his essay denouncing 'near-term emissions goals' at Cop30 mostly argues the case for letting the ultra-rich off the hook
Let's begin with the fundamental problem: Bill Gates is a politics denier. Though he came to it late, he now accepts the realities of climate science. But he lives in flat, embarrassing denial about political realities. His latest essay on climate, published last week, treats the issue as if it existed in a political vacuum. He writes as if there were no such thing as political power, and no such thing as billionaires.
His main contention is that funds are very limited, so the delegates at this month's climate summit in Brazil should direct money away from "near-term emissions goals" towards climate "adaptation" and spending on poverty and disease.
George Monbiot is a Guardian columnist
Continue reading...It means breaking with hundreds of years of tradition, but it can't wait. As hard-right figures spread division and laud autocrats, a fail-safe is vital
After two years in Brazil, I felt I understood its political system better than I understand the UK's. The reason is a short book in simple language that almost everyone owned: the constitution, published in 1988. Admittedly, I discovered the document's limitations while trying to explain its principles to a furious captain of the military police with a pump-action shotgun. But at least I knew exactly which of my rights he was infringing.
To achieve a similar grasp of rights and powers in the UK, you'd need to be a professor of constitutional law. They are contained in a vast and contradictory morass of legal statutes, court precedents, codes of conduct, scholarly opinions, treaties, traditions, gentlemen's agreements and unwritten rules. They are rendered still less intelligible by arcane parliamentary procedures and language so opaque that we need a translation app.
George Monbiot is a Guardian columnist
Continue reading...The government's new planning bill is tearing down environmental protections to benefit developers. This nation of nature lovers won't stand for it
Crucial to the government's war on nature is the "cauldron principle". If a species is to be blamed for "holding up development", it must be one you might find in a witch's cauldron. The culprits are never dormice, otters, water voles, nightingales, turtle doves or orchids, widely considered cute or beautiful. They are bats, newts, snails and spiders.
Bats and newts have been blamed by successive governments for nastily "standing in the way" of growth. In March, Keir Starmer claimed that "jumping spiders" had stopped "an entire new town". He added: "I've not made that example up." I think you can guess what comes next.
Continue reading...The rights we enjoy in the UK, and the movement the PM purports to lead, were built on protest. Those rights are in dire peril
Imagine a movement arising in this country that seeks to overthrow established power. Imagine that it begins with a series of rebellions, in Scotland and south Wales perhaps, that shut down workplaces, confront police and soldiers (sometimes peaceably, sometimes with crude weapons), set up roadblocks and lay siege to the places where fellow protesters are imprisoned and government officials are meeting.
Imagine that this movement goes on to smash or disable machinery across the country. Imagine that it organises a general strike, nixing much of the UK's economic activity for three months. Imagine that it keeps protesting in the same places by the same means, gradually eroding the resistance of the state.
George Monbiot is a Guardian columnist
Do you have an opinion on the issues raised in this article? If you would like to submit a response of up to 300 words by email to be considered for publication in our letters section, please click here.
Continue reading...Fixing that hole could have cost under £100; the cost of not doing so is limitless. My prang highlights the neoliberal folly of false economies
I was lucky. Last week, I was cycling downhill when I hit a pothole. The front wheel folded into an infinity symbol. I went over the handlebars and, with no time to put my hands out, landed on my face. My helmet and glasses took most of the impact. I emerged, remarkably, with just a few cuts and bruises.
My glasses were banjaxed, my bike needed major repairs and my clothes were torn. Altogether, that pothole has cost me about £450. Again, I'm lucky - I can afford it. But the point is this: fixing a pothole costs us between £45 and £90. Not fixing it costs us far more. God knows how many other people have pranged their bikes or wrecked their car tyres in the same hole. Between us, we may have paid hundreds of times the cost of its repair. If people have suffered significant injuries, so must the NHS. One of my correspondents tells me: "I'm three months into recovery from a cycling accident with a pothole that left me being airlifted to hospital with potentially life-threatening injuries. As well as a brain haemorrhage (despite a helmet), I had numerous broken bones and can't yet walk without crutches." The cost to the health service must be huge; the cost to him incalculable.
George Monbiot is a Guardian columnist
Continue reading...Consider the annihilation of agricultural land alongside the genocide - and grasp the chilling totality of this attempt to eliminate all life
A landless people and a peopleless land: these, it appears, are the aims of the Israeli government in Gaza. There are two means by which they are achieved. The first is the mass killing and expulsion of the Palestinians. The second is rendering the land uninhabitable. Alongside the crime of genocide, another great horror unfolds: ecocide.
While the destruction of buildings and infrastructure in Gaza is visible in every video we see, less visible is the parallel destruction of ecosystems and means of subsistence. Before the 7 October atrocity that triggered the current assault on Gaza, about 40% of its land was farmed. Despite its extreme population density, Gaza was mostly self-sufficient in vegetables and poultry, and met much of the population's demand for olives, fruit and milk. But last month the UN reported that just 1.5% of its agricultural land now remains both accessible and undamaged. That's roughly 200 hectares - the only remaining area directly available to feed more than 2 million people.
George Monbiot is a Guardian columnist
Do you have an opinion on the issues raised in this article? If you would like to submit a response of up to 300 words by email to be considered for publication in our letters section, please click here.
Continue reading...Once, I believed that humanity's problem was an information deficit. Now, I know you can't speak truth to power if power controls your words
The BBC I joined on my first day of professional journalism - 40 years ago this week - is unrecognisable today. While, for most of its history, the corporation had largely defended the status quo, under the director general at the time, Alasdair Milne, its journalists were sometimes allowed to stick it to power. This, I believe, is what journalism exists to do - and seldom does.
As a student, I'd hammered on the doors of the BBC's Natural History Unit, insisting there was a major gap in its coverage: investigative environmental reporting. If they took me on, I argued, I could help them fill it. The phone rang as I was leaving the house for one of my final exams. It was the head of the unit, saying: "You're so fucking persistent you've got the job."
George Monbiot is a Guardian columnist
Continue reading...Who is running the government's 'growth school' for civil servants? The answer surpassed my worst fears
Forgive me if I've got this wrong, but I seem to recall the country voting the Tories out last year. Part of the reason, if I remember correctly, was their staggering incompetence and insouciance, epitomised by Liz Truss's mini-budget. That catastrophe was, like Truss's political career, formed and steered by the neoliberal junktanks of Tufton Street.
But now I begin to doubt my recollections. We booted them out through the front door, right? Yet they still appear to be in the house. Perhaps they came round the back. After taking an interest in the Department for Business and Trade's "growth school" speaker sessions for civil servants, I sent a freedom of information request. Given that Keir Starmer, like Truss, has placed his growth "mission" at the centre of policy, and that this department is responsible for delivering it, the instruction given to its officials is crucial to the economic and political direction the country takes.
George Monbiot is a Guardian columnist
The Guardian's climate assembly with George Monbiot and special guests On 16 September, join George Monbiot, Mikaela Loach, Emma Pinchbeck and Zack Polanski as they discuss the forces driving the big climate pushback, with a welcome from Katharine Viner and special address from Feargal Sharkey
Continue reading...This report belongs to a weekly series summarising the Covid situation across the UK's home nations and other countries.
Thanks for reading Seeing The Forest for the Trees! Subscribe for free to receive new posts and support my work.
This week's report covers the latest weekly indicators of respiratory illness activity for England, along with the most recent data for Scotland, Wales, and Northern Ireland. The report also presents the data on Covid levels in selected countries in Europe and North America.
Charts for the USA were updated on Friday, Feb 13 to reflect the latest available data.
Summary.
This week the main Covid indicators in England, Scotland, Wales, and Northern Ireland stayed low, indicating a low level of risk.
Flu activity has continued to fall across all home nations, indicating that this year's Flu season is over. However, there's still a chance of some late seasonal activity.
In England, all main indicators of Covid activity remained well within the baseline activity level. Flu activity has fallen from its recent peak and is now circulating at low activity levels.
In Scotland, all indicators for Covid remained stable and within baseline levels though the slight rise in test positivity continued. Positivity rates and hospital admissions for Flu and RSV have fallen significantly from the recent peak and are at low levels.
In the past week, Covid hospital admissions in Wales stayed at low levels. Flu admissions continued to fall this week and are now at low activity levels.
In Northern Ireland, Covid activity increased slightly across some surveillance indicators but remained at low levels. Flu and RSV activity has fallen across all indicators.
Covid levels in wastewater remained low in most European countries that still report this data.
Covid activity in the USA remained broadly stable this week and is at a moderate level of activity nationwide, though there are significant variations from state to state. Flu activity continued to fall, but is still high in some states.
At the close of the Autumn 2025 booster campaign, coverage is highest among residents in care homes, but much lower for immunosuppressed individuals at risk. Scotland recorded the highest coverage, while Northern Ireland had the lowest.
The NHS Spring 2026 Covid booster campaign will use the same eligibility criteria as the Autumn 2025 campaign and is set to run from April 13 to June 30, 2026.
As always, it's important to remember that the risk of hospitalisation from Covid increases significantly with age and for the clinically vulnerable. Therefore, it is important to take appropriate measures such as self-isolating when experiencing Covid symptoms and enhancing ventilation or wearing masks whenever possible.
Status of main respiratory diseases in England.
This section starts with the latest data on test positivity rates for Covid in England. It's important to note that positivity is different from prevalence, which reflects the overall percentage of Covid cases in the general population. Appendix 1 offers a more detailed explanation of the distinction.
The following chart shows the test positivity rate for all Covid tests taken mapped against the UKHSA activity thresholds. The thresholds are based on the historical trend for Covid test positivity and, consequently, represent a relative risk. More details on this approach can be found in the Guide to Covid Surveillance Metrics.
The chart shows that the test positivity rate increased slightly this week and continues to be well below the baseline level, indicating a low risk. Positivity rates remained low in all regions, with only slight differences between them.
The next chart highlights four key indicators of Covid in hospitals: weekly Emergency Department visits for Covid-like symptoms, test positivity rates among patients with respiratory issues, hospital admission rates, and admission rates for intensive care.
While all key hospital indicators for Covid activity remained at historically low levels there were slight increase in the positivity rate.
The following chart shows hospital admission rates per 100,000 for the three main respiratory viruses. Covid admissions are at historic lows, while Flu and RSV cases have peaked and are now dropping to low activity levels. Both remain slightly higher than Covid, suggesting they currently pose a bit more of a risk.
While the activity levels for most respiratory viruses are falling, Human metapneumovirus (hMPV) levels increased but remained at a moderate level.
Scotland weekly hospital admissions and test positivity
Public Health Scotland (PHS) continue to publish weekly data on Covid hospital admissions and test positivity as well as wastewater monitoring data. The latest Viral respiratory diseases in Scotland surveillance report can be accessed here.
The following panel chart presents the most recent data for Covid levels in wastewater in blue, weekly Covid test positivity shown in red, Covid hospital admissions depicted in orange, and beds occupied by Covid patients in brown.
Once again, all Covid indicators in Scotland stayed low this week, suggesting the risk from the virus remains low, though there was a slight rise in test positivity for the second week in a row.
The final chart in this section compares the test positivity rates for hospital patients with respiratory symptoms for Covid, Flu, and RSV. While Flu positivity rates have continued to fall to low levels they remain higher than for Covid.
Despite influenza levels peaking earlier than expected this season, high activity has not been sustained, with continued decreases seen across all measures.
This week, Covid laboratory test positivity increased from 3.5 to 4% in week 6, though activity remained at baseline levels. Activity remains higher in those aged 1-14 compared to other age groups. Hospitalisations remained stable.
Flu cases remained at baseline activity overall, though with an increase in test positivity in those aged 5-14. Hospital admissions remained stable, with individuals aged 75 years and older accounting for 29.4% of admissions.
RSV cases continued to fall, remaining at a low activity level overall. Hospital admissions due to RSV also fell from 142 to 109, with the highest proportion reported in the 1-4 age group (33%).
Wales Covid hospital admissions.
During the winter season, Public Health Wales publishes a weekly respiratory infection report, which is available here. The following chart provides the latest trend for weekly hospital admissions for the main respiratory viruses in Wales up to week ending Feb 8, 2026.
Covid hospital admissions have stayed fairly steady over the past few months and remain very low. Flu cases needing hospitalisation continue to fall and are now lower than for Covid. RSV admissions also fell and are approaching low levels.
This weeks Weekly Acute Respiratory Infection Report shows that Flu activity has returned to low levels. Confirmed case numbers have decreased in the current week, as has test positivity.
In addition, GP consultations for influenza-like illness remained stable and are well below the 'low intensity' threshold. Respiratory Syncytial Virus (RSV) activity is decreasing overall but remains at medium intensity levels. Covid case numbers have remained broadly stable in recent weeks.
Status of main respiratory diseases in Northern Ireland.
Public Health Northern Ireland publish a weekly surveillance report on influenza, respiratory syncytial virus (RSV), and Covid providing an overview of these infections within Northern Ireland.
Covid activity fell across all surveillance indicators and remains at low levels. Flu activity also has fallen across all surveillance indicators and is now at low levels, while RSV activity remained stable across the majority of surveillance indicators and is circulating at moderate levels.
The following chart shows the test positivity rates in Northern Ireland for the main respiratory illnesses — Flu, RSV, and Covid and RSV. Shading represents 95% confidence intervals.
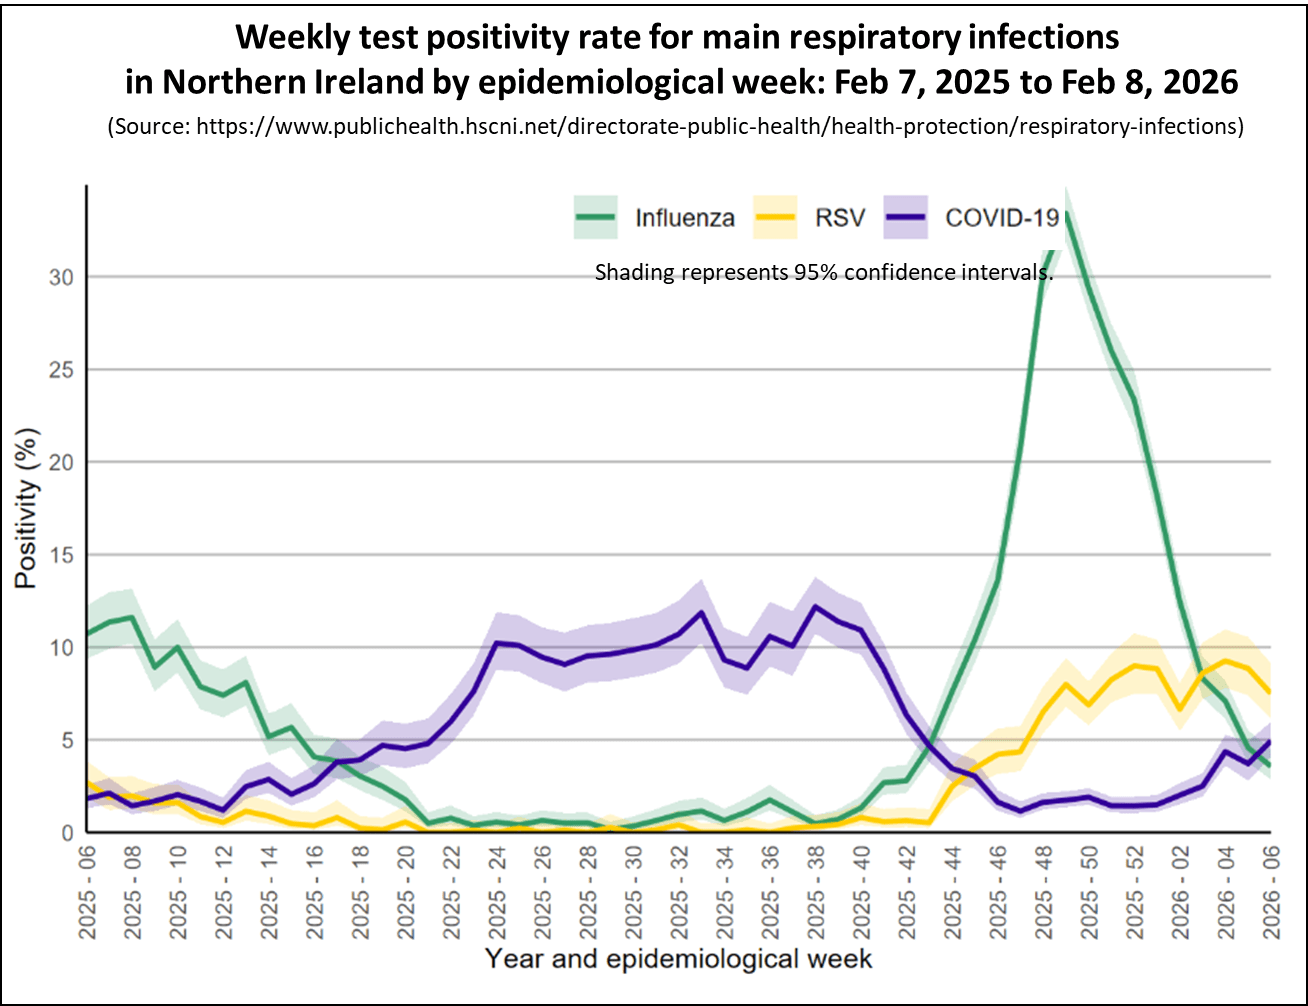
The chart shows that the Covid test positivity rate for patients with respiratory illnesses, marked in blue, increased slightly this week and stayed relatively low. Covid activity increased across the majority of surveillance indicators but remains low.
Flu test positivity, shown in green, has continued to fall along with all other surveillance indicators indicating that the winter Flu wave is over.
Covid Levels in Europe and North America.
This section looks at the latest data on Covid activity in Europe and North America. Covid levels have fallen in most countries across these regions and remain lower than those observed during earlier waves.
The following chart shows latest levels of Covid up to week ending February 5, 2026 as measured by monitoring wastewater in a number of European countries that still publish this information.
This week, Covid levels in wastewater remained low in most European countries that still share this data, with only Denmark staying at moderate levels.
Updated on Friday, February 13 to reflect the latest published data.
As of week ending February 7, 2026 Covid activity in the USA remained stable, though the situation varies across different parts of the country.
The following chart shows the weekly trend for the national key Covid indicators covering wastewater activity levels, percent of emergency department visits due to Covid, test positivity, and the hospital admission rate in the USA.
The panel chart shows Covid levels in wastewater remained stable and are at moderate activity for the week ending February 7, 2026. Emergency department visits and hospital admissions fell slightly, while Covid test positivity remained broadly unchanged.
Wastewater analysis shows that Covid levels are highest Mid West and Northeast states, while staying relatively low in the South and West regions, as illustrated in the following map. Each state is coloured based on activity levels, ranging from very high (dark red) to very low (light green), with grey indicating no data available. States with increasing activity levels are marked with cross-hatching.
The interactive map lets you hover over any state using your cursor to see more details about wastewater viral activity levels. It shows data from states nationwide for the week ending February 7, 2026.
The next chart compares the percentage of Emergency Department visits caused by Covid and Flu. It indicates that while activity for Covid is moderate, Flu activity has has continued to fall and is now at a low level nationally.
However, Flu activity varies across states, with cases increasing in 21 and decreasing in 27. While most states are experiencing moderate or low activity levels, six are still facing high or very high activity, as shown on the interactive map.
Finally, the latest data from Canada, up to January 31, 2026, shows that Covid wastewater levels are holding steady at moderate levels, flu activity has dropped to low, while RSV activity fell this week after last weeks rise.
UK Autumn 2025 Covid Booster Campaign Update
The NHS Autumn 2025 Covid booster campaign closed on January 31, 2026 across all Home Nations. The campaign provided free vaccinations for all individuals aged 75 years and older; residents in care homes for older adults; and immunosuppressed individuals aged 6 months and above.
The following chart shows the coverage for these three eligible groups at the end of the campaign.
Overall, coverage is the highest among residents in care homes, but much lower for immunosuppressed individuals at risk. Scotland recorded the highest coverage, while Northern Ireland had the lowest.
The next chart highlights the overall coverage trends for each booster campaign carried out in England.
Until this booster campaign, coverage had been declining for both the Autumn and Spring campaigns in England. However, for those aged 75 and over, the Autumn 2025 campaign matched the coverage levels seen in Autumn 2024.
The chart shows that, unlike past Autumn campaigns, people aged 65 to 74 weren't eligible for Covid boosters. On top of that, the rules for being considered immunosuppressed were made stricter, which meant far fewer people qualified for the Autumn 2025 campaign compared to previous years. As a result, in England the number of boosters given during the Autumn 2025 campaign (4.7 million) was just under half of those administered in Autumn 2024 (9.8 million).
Finally, the NHS Spring 2026 Covid booster campaign will use the same eligibility criteria as the Autumn 2025 campaign and is set to run from April 13 to June 30, 2026.
In conclusion
Although the amount of data currently being published is reduced, the information available for all home nations show that Covid activity is relatively low. Flu activity had fallen from its recent peak although and is now at low levels.
Covid levels in wastewater are low across European countries In the USA, Covid activity also fell slightly but remains at high levels in a some states. Flu activity in both the USA and Canada is falling.
As always, if you have any comments on this Covid Situation Report or suggestions for topics to cover, please post a message below.
Thanks for reading Seeing The Forest for the Trees! Subscribe for free to receive new posts and support my work.
Appendix 1. Test positivity rates and prevalence
Positivity rates are derived from the results of hospital laboratory tests conducted on patients exhibiting symptoms of respiratory diseases. Test positivity is the percentage of patients who test positive for Covid of the total number of patients tested. Since the individuals tested for this measure are not a representative sample of the general population it differs from prevalence, which is derived from a representative sample of the population.
This report belongs to a weekly series summarising the Covid situation across the UK's home nations and other countries.
Thanks for reading Seeing The Forest for the Trees! Subscribe for free to receive new posts and support my work.
This week's report covers the latest weekly indicators of respiratory illness activity for England, along with the most recent data for Scotland, Wales, and Northern Ireland. The report also presents the data on Covid levels in selected countries in Europe and North America.
Charts for the USA were updated on Friday, Feb 6 to reflect the latest available data.
Summary.
This week the main Covid indicators in England, Scotland, Wales, and Northern Ireland remained low, indicating a low level of risk.
Flu activity has continued to fall across all home nations, indicating that this year's Flu season is over. However, there's still a chance of some late seasonal activity.
In England, the all main indicators of Covid activity remained well within the baseline activity level. Flu activity has again fallen from its recent peak and is now circulating at low activity levels. Hospital admissions remain highest among those over 85 years old with Flu and children under 5 years with RSV.
In Scotland, although all indicators for Covid remained stable and within baseline levels. Positivity rates and hospital admissions for Flu and RSV have fallen significantly from the recent peak and are at low levels of activity.
In the past week, Covid hospital admissions in Wales stayed at low levels. Flu admissions continued to fall this week and are now at low activity levels.
In Northern Ireland, Covid activity remained stable across all surveillance indicators and remains at low levels. Flu and RSV activity has fallen across all indicators.
Covid levels in wastewater remained low in most European countries that still report this data.
Covid activity in the USA again fell slightly last week and is at a moderate level of activity nationwide, though there are significant variations from state to state. Flu activity continued to fall, but is still high in some states.
As always, it's important to remember that the risk of hospitalisation from Covid increases significantly with age and for the clinically vulnerable. Therefore, it is important to take appropriate measures such as self-isolating when experiencing Covid symptoms and enhancing ventilation or wearing masks whenever possible.
Status of main respiratory diseases in England.
This section begins with the latest data on test positivity rates for Covid in England. It's important to note that positivity is different from prevalence, which reflects the overall percentage of Covid cases in the general population. Appendix 1 offers a more detailed explanation of the distinction.
The following chart shows the test positivity rate for all Covid tests taken mapped against the UKHSA activity thresholds. The thresholds are based on the historical trend for Covid test positivity and, consequently, represent a relative risk. More details on this approach can be found in the Guide to Covid Surveillance Metrics.
The chart shows that the test positivity rate fell slightly this week and continues to be well below the baseline level, indicating a low risk. Positivity rates remained low in all regions, with only slight differences between them.
The next chart highlights four key indicators of Covid in hospitals: weekly Emergency Department visits for Covid-like symptoms, test positivity rates among patients with respiratory issues, hospital admission rates, and admission rates for intensive care.
While all key hospital indicators for Covid activity remained at historically low levels there were slight increase in Emergency Department visits.
The following chart shows hospital admission rates per 100,000 for the three main respiratory viruses. Covid admissions are historically low, while Flu and RSV admissions have peaked and are returning to low activity levels. Both still remain higher than Covid, indicating that Flu and RSV currently pose a slightly greater risk. If you're experiencing Covid-like symptoms, there's a good chance it is Flu or RSV.
While hospital admissions are falling, they still differ by age. Below are the hospital admission rates per 100,000 people by age group for Covid, Flu, and RSV for the week ending February 1, 2026.
The chart shows that the risk of hospitalisation remains highest among the very youngest age group and the elderly for both Flu and RSV. While current hospital admissions for Covid are much lower, the elderly remain more likely to be hospitalised.
While the activity levels for most respiratory viruses are falling, Human metapneumovirus (hMPV) levels have remained at a moderate level.
Scotland weekly hospital admissions and test positivity
Public Health Scotland (PHS) continue to publish weekly data on Covid hospital admissions and test positivity as well as wastewater monitoring data. The latest Viral respiratory diseases in Scotland surveillance report can be accessed here.
The following panel chart presents the most recent data for Covid levels in wastewater in blue, weekly Covid test positivity shown in red, Covid hospital admissions depicted in orange, and beds occupied by Covid patients in brown.
Once again, all Covid indicators in Scotland stayed stable and low this week, indicating the risk from the virus remains low.
The final chart in this section compares the test positivity rates for hospital patients with respiratory symptoms for Covid, Flu, and RSV. While Flu positivity rates have continued to fall to low levels they remain higher than for Covid.
Despite influenza levels peaking earlier than expected this season, high activity has not been sustained, with continued decreases seen across all measures.
Laboratory-confirmed Flu cases continued to fall to 125 from the peak of 1,994, with overall activity remaining at baseline for this week. Test positivity also fell and hospital admissions for Flu also decreased from 139 to 82, with individuals aged 75 years and older accounting for 29.3% of admissions.
RSV laboratory‑confirmed cases fell to low levels this week with test positivity falling to 8.1% from 9.9%. Hospital admissions due to RSV also decreased; the highest proportion occurred in under 1 age group followed by the 1-4 age group.
Although Covid test positivity increased slightly this week, overall activity remained stable and within baseline levels. Activity rose from low to medium among 5-14 year olds, while dropping to low in children under four. Hospitalisations also declined, falling to 77 from 85 the week before.
Wales Covid hospital admissions.
During the winter season, Public Health Wales publishes a weekly respiratory infection report, which is available here. The following chart provides the latest trend for weekly hospital admissions for the main respiratory viruses in Wales up to week ending Feb 1, 2026.
Covid hospital admissions have stayed fairly steady over the past few months and remain very low. Flu cases needing hospitalisation continue to fall and are now lower than for Covid. RSV admissions also fell but remain at moderate levels.
This weeks Weekly Acute Respiratory Infection Report shows that Flu activity has returned to low levels, but warns that the potential remains for late seasonal activity. Confirmed case numbers have decreased in the current week, as has test positivity.
In addition, GP consultations for influenza-like illness have fallen below the 'low intensity' threshold. Respiratory Syncytial Virus (RSV) activity is decreasing overall but remains at medium intensity levels. Covid case numbers have remained broadly stable in recent weeks.
Status of main respiratory diseases in Northern Ireland.
Public Health Northern Ireland publish a weekly surveillance report on influenza, respiratory syncytial virus (RSV), and Covid providing an overview of these infections within Northern Ireland.
Covid activity fell across all surveillance indicators and remains at low levels. Flu activity also has fallen across all surveillance indicators and is now at low levels, while RSV activity remained stable across the majority of surveillance indicators and is circulating at moderate levels.
The following chart shows the test positivity rates in Northern Ireland for the main respiratory illnesses — Flu, RSV, and Covid and RSV. Shading represents 95% confidence intervals.
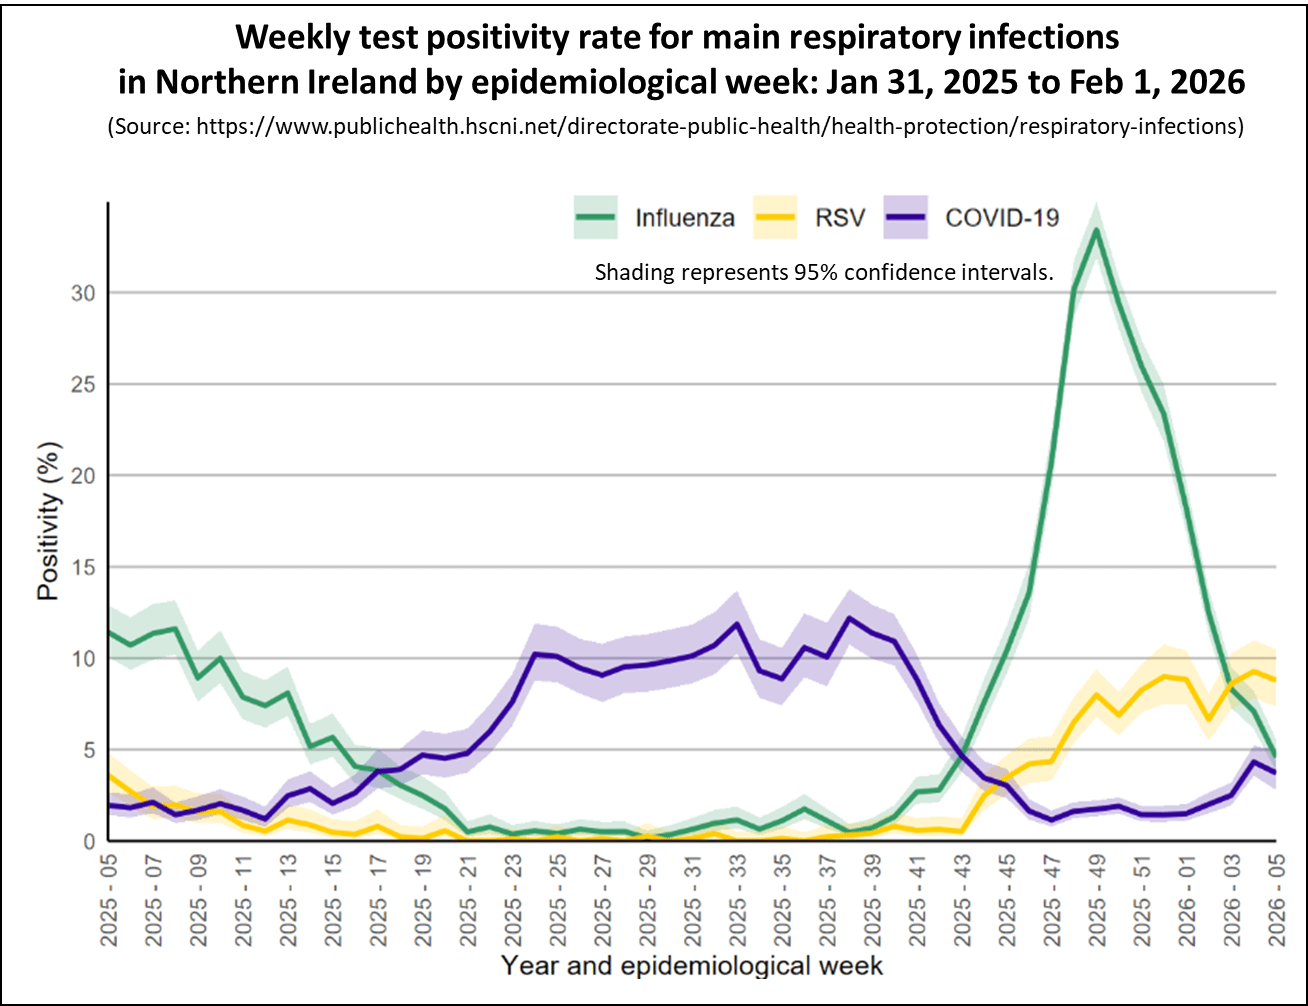
The chart shows that the Covid test positivity rate for patients with respiratory illnesses, marked in blue, fell slightly this week and stayed relatively low. Flu test positivity, shown in green, has continued to fall indicating that the winter Flu wave is over.
Covid Levels in Europe and North America.
This section looks at the latest data on Covid activity in Europe and North America. Covid levels have fallen in most countries across these regions and remain lower than those observed during earlier waves.
The following chart shows latest levels of Covid up to week ending January 29, 2026 as measured by monitoring wastewater in a number of European countries that still publish this information.
This week, Covid levels in wastewater dropped in most European countries that still share this data, with only Denmark and Sweden reporting increases while staying at moderately low levels.
Updated on Friday, February 6 to reflect the latest published data.
As of week ending January 31, 2026, Covid activity in the USA continued to fall, though the situation varies across different parts of the country.
The following chart shows the weekly trend for the national key Covid indicators covering wastewater activity levels, percent of emergency department visits due to Covid, test positivity, and the hospital admission rate in the USA.
The panel chart shows Covid levels in wastewater remained stable and are at moderate activity for the week ending January 31, 2026. Emergency department visits and hospital admissions also fell, while Covid test positivity remained broadly unchanged.
Wastewater analysis shows that Covid levels are highest Mid West and Northeast states, while staying relatively low in the South and West regions, as illustrated in the following map. Each state is coloured based on activity levels, ranging from very high (dark red) to very low (light green), with grey indicating no data available. States with increasing activity levels are marked with cross-hatching.
The interactive map lets you hover over any state using your cursor to see more details about wastewater viral activity levels. It shows data from states nationwide for the week ending January 31, 2026.
The next chart compares the percentage of Emergency Department visits caused by Covid and Flu. It indicates that while activity for Covid is moderate, Flu activity has has continued to fall and is now at a moderate level.
Flu activity varies across states, with cases increasing in 24 and decreasing in 23. While most states are experiencing moderate levels, seven are still facing high or very high activity, as shown on the interactive map.
Finally, the latest data from Canada, up to January 24, 2026, shows that Covid wastewater levels are holding steady at moderate levels, flu activity has dropped to low, but RSV activity is on the rise.
In conclusion
Although the amount of data currently being published is reduced, the information available for all home nations show that Covid activity is relatively low. Flu activity had fallen from its recent peak although and is now at low levels.
Covid levels in wastewater are dropping across European countries and are low in most areas. In the USA, Covid activity also fell slightly but remains at high levels in a some states. Flu activity in both the USA and Canada is falling.
As always, if you have any comments on this Covid Situation Report or suggestions for topics to cover, please post a message below.
Thanks for reading Seeing The Forest for the Trees! Subscribe for free to receive new posts and support my work.
Appendix 1. Test positivity rates and prevalence
Positivity rates are derived from the results of hospital laboratory tests conducted on patients exhibiting symptoms of respiratory diseases. Test positivity is the percentage of patients who test positive for Covid of the total number of patients tested. Since the individuals tested for this measure are not a representative sample of the general population it differs from prevalence, which is derived from a representative sample of the population.
This report belongs to a weekly series summarising the Covid situation across the UK's home nations and other countries.
Thanks for reading Seeing The Forest for the Trees! Subscribe for free to receive new posts and support my work.
This week's report covers the latest weekly indicators of respiratory illness activity for England, along with the most recent data for Scotland, Wales, and Northern Ireland. The report also presents the data on Covid levels in selected countries in Europe and North America.
Charts for the USA were updated on Friday, January 30 to reflect the latest available data.
Summary.
This week the main Covid indicators in England, Scotland, Wales, and Northern Ireland remained low, indicating a low level of risk. However, there were slight increases in some indicators for England and Northern Ireland.
Flu activity has continued to fall across all home nations, indicating that this years winter Flu season is almost over.
In England, the Covid test positivity rate and key hospital indicators showed mixed trends this week, but remain well within the baseline activity level. Flu activity has again fallen from its recent peak and is now circulating at low activity levels. Hospital admissions remain highest among those over 85 years old with Flu and children under 5 years with RSV.
In Scotland, all indicators of Covid activity remained at low levels of activity this week. Positivity rates and hospital admissions for Flu have fallen significantly from the recent peak and are at low levels of activity.
In the past week, Covid hospital admissions in Wales stayed at low levels. Flu admissions continued to fall this week and are returning to low activity levels.
In Northern Ireland, Covid activity increased across some surveillance indicators but remains at low levels. Flu activity has fallen across all indicators.
Covid levels in wastewater fell in most European countries that still report this data.
Covid activity in the USA again fell slightly last week and is at a medium level of activity nationwide, though there are significant variations from state to state. Flu activity continued to fall, but is still high in some states.
As always, it's important to remember that the risk of hospitalisation from Covid increases significantly with age and for the clinically vulnerable. Therefore, it is important to take appropriate measures such as self-isolating when experiencing Covid symptoms and enhancing ventilation or wearing masks whenever possible.
Status of main respiratory diseases in England.
This section begins with the latest data on test positivity rates for Covid in England. It's important to note that positivity is different from prevalence, which reflects the overall percentage of Covid cases in the general population. Appendix 1 offers a more detailed explanation of the distinction.
The following chart shows the test positivity rate for all Covid tests taken mapped against the UKHSA activity thresholds. The thresholds are based on the historical trend for Covid test positivity and, consequently, represent a relative risk. More details on this approach can be found in the Guide to Covid Surveillance Metrics.
The chart shows that the test positivity rate increased slightly this week but continues to be well below the baseline level, indicating a low risk. Positivity rates remained low in all regions, with only slight differences between them.
The next chart highlights four key indicators of Covid in hospitals: weekly Emergency Department visits for Covid-like symptoms, test positivity rates among patients with respiratory issues, hospital admission rates, and admission rates for intensive care.
While all key hospital indicators for Covid activity remained at historically low levels there were slight increases in Emergency Department visits and the positivity rate.
The following chart shows hospital admission rates per 100,000 for the three main respiratory viruses. Covid admissions are historically low, while Flu and RSV admissions have peaked and are returning to low activity levels. Both still remain higher than Covid, indicating that Flu and RSV currently pose a slightly greater risk. If you're experiencing Covid-like symptoms, there's a good chance it is Flu or RSV.
While hospital admissions are falling, they still differ by age. Below are the hospital admission rates per 100,000 people by age group for Covid, Flu, and RSV for the week ending January 25, 2026.
The chart shows that the risk of hospitalisation remains highest among the very youngest age group and the elderly for both Flu and RSV. While current hospital admissions for Covid are much lower, the elderly remain more likely to be hospitalised.
While the activity levels for most respiratory viruses are falling, Human metapneumovirus (hMPV) levels have increased recently although they remain at a moderately low level.
Scotland weekly hospital admissions and test positivity
Public Health Scotland (PHS) continue to publish weekly data on Covid hospital admissions and test positivity as well as wastewater monitoring data. The latest Viral respiratory diseases in Scotland surveillance report can be accessed here.
The following panel chart presents the most recent data for Covid levels in wastewater in blue, weekly Covid test positivity shown in red, Covid hospital admissions depicted in orange, and beds occupied by Covid patients in brown.
Once again, all Covid indicators in Scotland stayed stable and low this week, indicating the risk from the virus remains low.
The final chart in this section compares the test positivity rates for hospital patients with respiratory symptoms for Covid, Flu, and RSV. While Flu positivity rates have continued to fall to low levels they remain higher than for Covid.
Despite influenza levels peaking earlier than expected this season, high activity has not been sustained, with continued decreases seen across all measures.
Wales Covid hospital admissions.
During the winter season, Public Health Wales publishes a weekly respiratory infection report, which is available here. The following chart provides the latest trend for weekly hospital admissions for the main respiratory viruses in Wales up to week ending Jan 25, 2026.
Covid hospital admissions have stayed fairly steady over the past few months and remain very low at baseline levels. Flu cases needing hospitalisation are falling, while RSV admissions remain stable at moderate levels.
This weeks Weekly Acute Respiratory Infection Report shows that Flu activity is returning to low levels, but potential remains for late seasonal activity. Confirmed case numbers have decreased in the current week, as has test positivity.
In addition, GP consultations for influenza-like illness have fallen below the 'low intensity' threshold. Respiratory Syncytial Virus (RSV) activity is decreasing overall but remains at medium intensity levels. Covid case numbers have remained broadly stable in recent weeks.
Status of main respiratory diseases in Northern Ireland.
Public Health Northern Ireland publish a weekly surveillance report on influenza, respiratory syncytial virus (RSV), and Covid providing an overview of these infections within Northern Ireland.
Covid activity increased across some surveillance indicators but remains at low levels. Meanwhile, Flu activity has fallen across all surveillance indicators and is reaching low levels, while RSV activity increased slightly across the majority of surveillance indicators and is circulating at moderate levels.
The following chart shows the test positivity rates in Northern Ireland for the main respiratory illnesses — Flu, RSV, and Covid and RSV. Shading represents 95% confidence intervals.
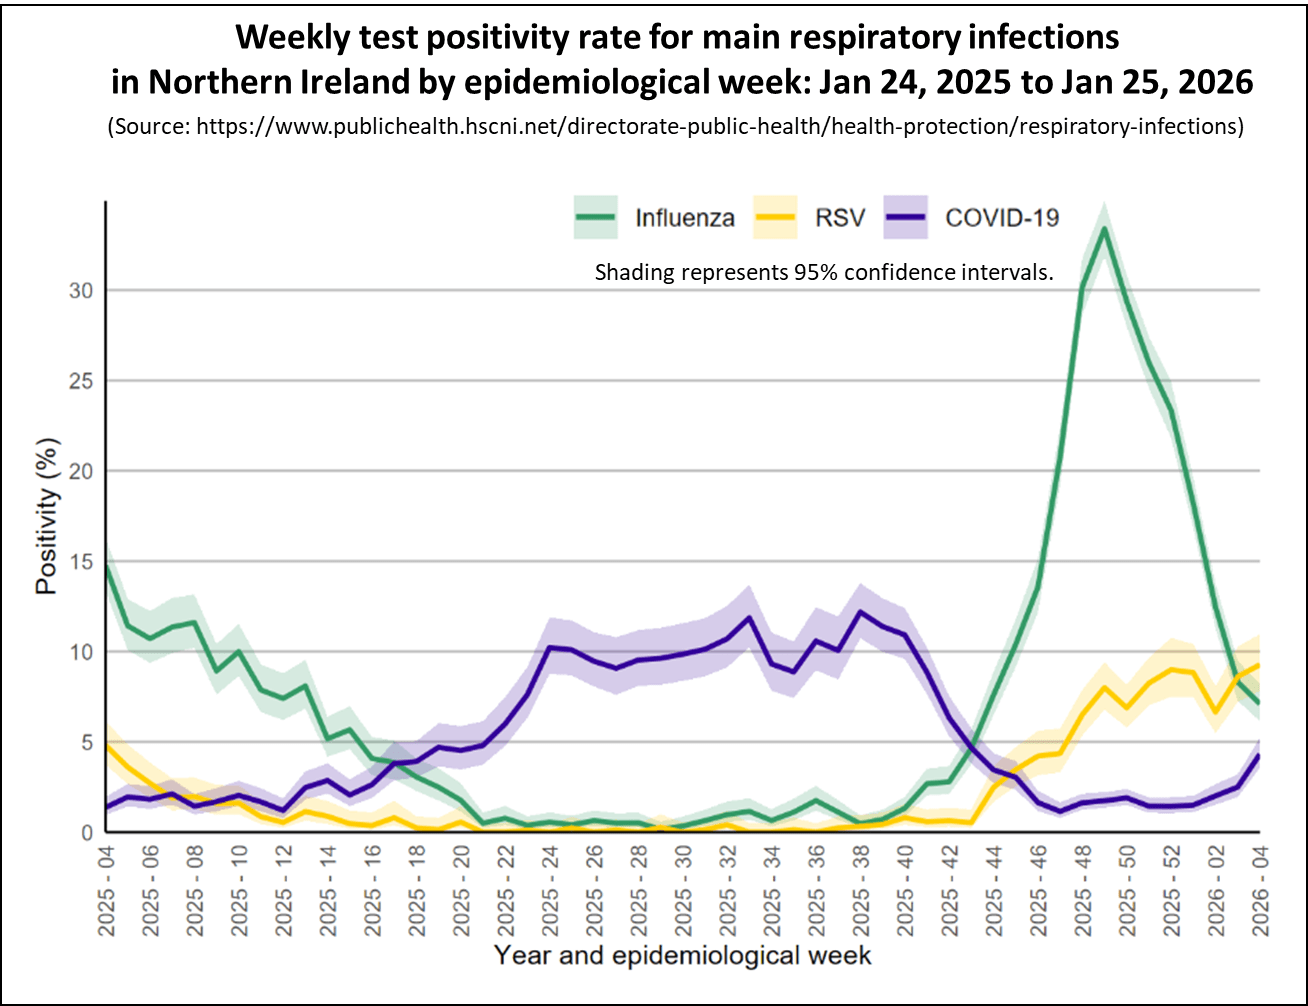
The chart shows that the Covid test positivity rate for patients with respiratory illnesses, marked in blue, increased slightly this week although remaining relatively low. Flu test positivity, shown in green, has continued to fall confirming that the winter Flu wave is over.
Covid Levels in Europe and North America.
This section looks at the latest data on Covid activity in Europe and North America. Covid levels have fallen in most countries across these regions and remain lower than those observed during earlier waves.
The following chart shows latest levels of Covid up to week ending January 22, 2026 as measured by monitoring wastewater in a number of European countries that still publish this information.
This week, Covid levels in wastewater dropped in most European countries that still share this data, with only Denmark and Austria reporting increases while staying at moderate levels.
Updated on Friday, January 30 to reflect the latest published data.
As of week ending January 24, 2026, Covid activity in the USA continued to fall, though the situation varies across different parts of the country.
The following chart shows the weekly trend for the national key Covid indicators covering wastewater activity levels, percent of emergency department visits due to Covid, test positivity, and the hospital admission rate in the USA.
The panel chart shows Covid levels in wastewater fell slightly and are now moderate for the week ending January 24, 2026. Emergency department visits and hospital admissions also fell, while Covid test positivity remained broadly unchanged.
Wastewater analysis shows that Covid levels are highest Mid West and Northeast states, while staying relatively low in the South and West regions, as illustrated in the following map. Each state is coloured based on activity levels, ranging from very high (dark red) to very low (light green), with grey indicating no data available. States with increasing activity levels are marked with cross-hatching.
The interactive map lets you hover over any state using your cursor to see more details about wastewater viral activity levels. It shows data from states nationwide for the week ending January 24, 2026.
The next chart compares the percentage of Emergency Department visits caused by Covid and Flu. It indicates that while activity for Covid is moderate, Flu activity has has continued to fall and is now at a moderately low level.
Flu activity varies across states, with cases falling in 29 states, with only 6 still seeing high or very high levels, as shown on the interactive map.
Finally, the latest data from Canada, up to January 17, 2026, shows that Covid wastewater levels remain steady at moderate levels, while flu activity has fallen to low activity levels.
In conclusion
Although the amount of data currently being published is reduced, the information available for all home nations show that Covid activity is relatively low. Flu activity had fallen from its recent peak although and is now at low levels.
Covid levels in wastewater are dropping across European countries and are low in most areas. In the USA, Covid activity also fell slightly but remains at high levels in a some states. Flu activity in both the USA and Canada is falling.
As always, if you have any comments on this Covid Situation Report or suggestions for topics to cover, please post a message below.
Thanks for reading Seeing The Forest for the Trees! Subscribe for free to receive new posts and support my work.
Appendix 1. Test positivity rates and prevalence
Positivity rates are derived from the results of hospital laboratory tests conducted on patients exhibiting symptoms of respiratory diseases. Test positivity is the percentage of patients who test positive for Covid of the total number of patients tested. Since the individuals tested for this measure are not a representative sample of the general population it differs from prevalence, which is derived from a representative sample of the population.
This report belongs to a weekly series summarising the Covid situation across the UK's home nations and other countries.
Thanks for reading Seeing The Forest for the Trees! Subscribe for free to receive new posts and support my work.
This week's report covers the latest weekly indicators of respiratory illness activity for England, along with the most recent data for Scotland, Wales, and Northern Ireland. The report also presents the data on Covid levels in selected countries in Europe and North America.
Online version updated on January 23, 2026 with latest USA data.
Summary.
2026 continues with good news as the main Covid indicators in England, Scotland, Wales, and Northern Ireland remain low, signalling a low level of risk.
Flu activity has continued to fall across all home nations, indicating that this years winter Flu season is almost over.
In England, the Covid test positivity rate and key hospital indicators stayed steady this week, well within the baseline activity level. Flu activity has again fallen from its recent peak and is now circulating at low activity levels. Hospital admissions remain highest among those over 85 years old with Flu and children under 5 years with RSV.
In Scotland, all indicators of Covid activity remained at low levels of activity this week. Positivity rates and hospital admissions for Flu have fallen significantly from the recent peak and are approaching low levels of activity.
In the past week, Covid hospital admissions in Wales stayed at low levels. Flu hospital admissions continued to fall this week but remain at medium activity levels.
In Northern Ireland, Covid activity was stable across all surveillance indicators in the past week and remains at low levels. Flu activity has fallen across all indicators.
Covid levels in wastewater fell in most European countries that still report this data.
Covid activity in the USA fell slightly this week and has returned to a medium level of activity nationwide, though there are significant variations from state to state. Flu activity is starting to fall, but is still high in many states.
Free vaccinations in the Autumn 2025 booster campaign will be available for adults aged 75 and older; residents in care homes for older adults; and immunosuppressed individuals aged 6 months and above until January 31, 2026.
People registered with a GP surgery in England can check their eligibility and book a vaccination appointment through this link.
Details of booking a free NHS Covid vaccination in Scotland can be found here, for Wales here, and in Northern Ireland here.
As always, it's important to remember that the risk of hospitalisation from Covid increases significantly with age and for the clinically vulnerable. Therefore, it is important to take appropriate measures such as self-isolating when experiencing Covid symptoms and enhancing ventilation or wearing masks whenever possible.
Status of main respiratory diseases in England.
This section begins with the latest data on test positivity rates for Covid in England. It's important to note that positivity is different from prevalence, which reflects the overall percentage of Covid cases in the general population. Appendix 1 offers a more detailed explanation of the distinction.
The following chart shows the test positivity rate for all Covid tests taken mapped against the UKHSA activity thresholds. The thresholds are based on the historical trend for Covid test positivity and, consequently, represent a relative risk. More details on this approach can be found in the Guide to Covid Surveillance Metrics.
The chart shows that the test positivity rate remained stable this week and continues to be well below the baseline level, indicating a low risk. Positivity rates remained low in all regions, with only slight differences between them.
The next chart highlights four key indicators of Covid in hospitals: weekly Emergency Department visits for Covid-like symptoms, test positivity rates among patients with respiratory issues, hospital admission rates, and admission rates for intensive care.
All key hospital indicators for Covid activity remained stable this week and overall activity is at historically low levels.
The following chart shows hospital admission rates per 100,000 for the three main respiratory viruses. Covid admissions are historically low, while Flu and RSV admissions have peaked and are close to low activity levels. However, both remain higher than Covid, indicating that Flu and RSV currently pose a greater risk. If you're experiencing Covid-like symptoms, there's a good chance it is Flu or RSV.
While hospital admissions are falling, they still differ by age. Below are the hospital admission rates per 100,000 people by age group for Covid, Flu, and RSV for the week ending January 18, 2026.
The chart shows that the risk of hospitalisation remains highest among the very youngest age group and the elderly for both Flu and RSV. While current hospital admissions for Covid are much lower, the elderly remain more likely to be hospitalised.
Although the activity levels for most respiratory viruses are falling, Human metapneumovirus (hMPV) levels are increasing although it remains at a moderately low level.
Finally, while Flu activity is falling, it's still a good idea to check your eligibility and book a free vaccination through the following link if you have not already done so.
Scotland weekly hospital admissions and test positivity
Public Health Scotland (PHS) continue to publish weekly data on Covid hospital admissions and test positivity as well as wastewater monitoring data. The latest Viral respiratory diseases in Scotland surveillance report can be accessed here.
The following panel chart presents the most recent data for Covid levels in wastewater in blue, weekly Covid test positivity shown in red, Covid hospital admissions depicted in orange, and beds occupied by Covid patients in brown.
Once again, all Covid indicators in Scotland stayed stable and low this week, indicating the risk from the virus remains low.
The final chart in this section compares the test positivity rates for hospital patients with respiratory symptoms for Covid, Flu, and RSV. While Flu positivity rates have continued to fall they remain higher than for Covid.
Despite influenza levels peaking earlier than expected this season, high activity has not been sustained, with continued decreases seen across all measures. Confirmed cases fell by 33%, from 505 last week to 335 this week, remaining at low activity overall. There were 179 hospital admissions due to Flu this week, down from 239 in the previous week; more than 39% were among those aged 75 years and older. Influenza A(H3N2) continues to dominate.
RSV case rates have fallen this week, although test positivity increased slightly from 8.9% to 9.1%. RSV test positivity increased in children 1-5 years and those aged over 75 years but decreased or remained stable in all other ages groups. Hospital admissions due to RSV decreased to 134; the highest proportion occurred in infants under 1 year, followed by children aged 1-4 years and adults aged 75 and over.
Although the Flu season is coming to an end in Scotland, it's still possible to check if you're eligible for a free Flu vaccination here. If you haven't been contacted yet, you can still book your vaccination using the following link.
Wales Covid hospital admissions.
During the winter season, Public Health Wales publishes a weekly respiratory infection report, which is available here. The following chart provides the latest trend for weekly hospital admissions for the main respiratory viruses in Wales up to week ending Jan 18, 2026.
Covid hospital admissions have stayed fairly steady over the past few months and remain very low at baseline levels. Flu cases needing hospitalisation are falling, while RSV admissions remain stable at moderate levels.
This weeks Weekly Acute Respiratory Infection Report shows that Flu whilst activity is at a medium level it is returning to low intensity levels. Confirmed case numbers have decreased in the current week, as has test positivity. In the week ending January 11, 2026, GP consultations for influenza-like illness are now at baseline levels.
Respiratory Syncytial Virus (RSV) activity is also on the decline, though at a slower pace, and remains at medium intensity levels.
Free Flu vaccinations are still available for individuals aged 65 and older, certain young children, pregnant women, and those with specific medical conditions. You can check your eligibility and book a vaccination through the provided link.
Status of main respiratory diseases in Northern Ireland.
Public Health Northern Ireland publish a weekly surveillance report on influenza, respiratory syncytial virus (RSV), and Covid providing an overview of these infections within Northern Ireland.
Covid activity activity has remained stable and at low levels across all surveillance indicators. Meanwhile, Flu activity has fallen across all surveillance indicators and is approaching low levels, while RSV activity has decreased across most surveillance indicators and is circulating at moderate levels.
The following chart shows the test positivity rates in Northern Ireland for the main respiratory illnesses — Flu, RSV, and Covid and RSV. Shading represents 95% confidence intervals.
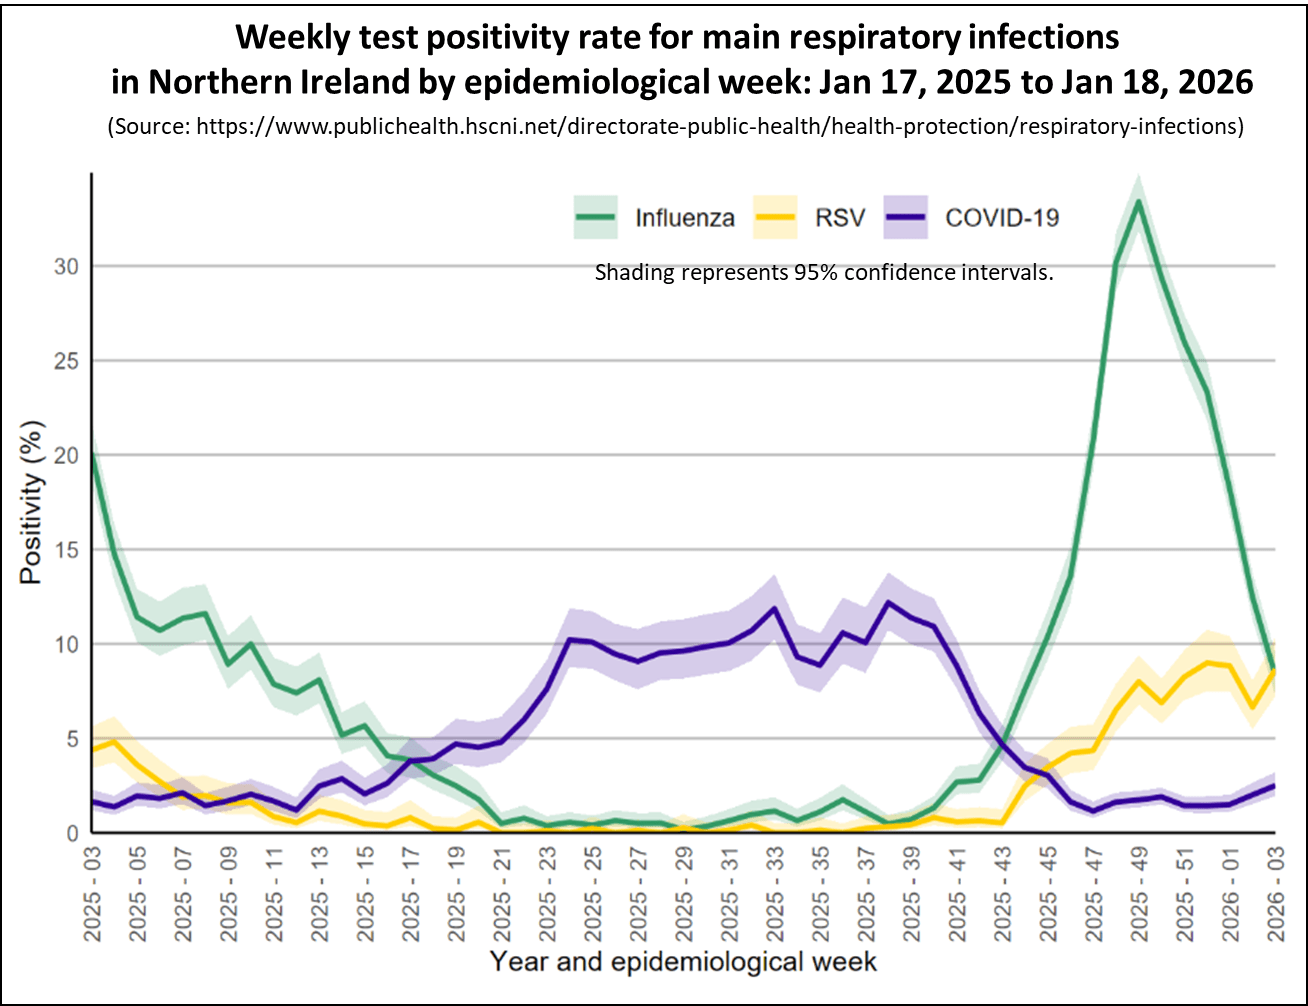
The chart shows that the Covid test positivity rate for patients with respiratory illnesses, marked in blue, has again remained stable this week, indicating a low level of Covid activity. Flu test positivity, shown in green, has continued to fall confirming that this wave has peaked.
Information about who qualifies for free flu vaccinations and how to schedule an appointment can be found at the provided link.
Flu vaccinations in Northern Ireland
Covid Levels in Europe and North America.
This section looks at the latest data on Covid activity in Europe and North America. Covid levels have fallen in most countries across these regions and remain lower than those observed during earlier waves.
The following chart shows latest levels of Covid up to week ending January 15, 2026 as measured by monitoring wastewater in a number of European countries that still publish this information.
This week, Covid levels in wastewater dropped in most European countries that still share this data, with only Denmark and Austria reporting increases while staying at moderate levels.
As of week ending January 17, 2026, Covid activity in the USA continued to fall, though the situation varies across different parts of the country.
The following chart shows the weekly trend for the national key Covid indicators covering wastewater activity levels, percent of emergency department visits due to Covid, test positivity, and the hospital admission rate in the USA.
The panel chart shows Covid levels in wastewater fell slightly and are now moderate for the week ending January 17, 2026. Emergency department visits and hospital admissions also fell, while Covid test positivity remained broadly unchanged.
Wastewater analysis shows that Covid levels are highest Mid West and Northeast states, while staying relatively low in the South and West regions, as illustrated in the following map. Each state is coloured based on activity levels, ranging from very high (dark red) to very low (light green), with grey indicating no data available. States with increasing activity levels are marked with cross-hatching.
The interactive map lets you hover over any state using your cursor to see more details about wastewater viral activity levels. It shows data from states nationwide for the week ending January 17, 2026.
The next chart compares the percentage of Emergency Department visits caused by Covid and Flu. It indicates that while activity for Covid is moderate, Flu activity has has continued to fall and is now at a moderate level.
Flu activity varies across states, with cases falling in 42 states, with only 6 still seeing high or very high levels, as shown on the interactive map.
Finally, the latest data from Canada, up to January 10, 2026, shows that Covid wastewater levels remain steady at moderate levels, while flu activity has peaked.
In conclusion
Although the amount of data currently being published is reduced, the information available for all home nations show that Covid activity is relatively low. Flu activity had fallen from its recent peak although and is approaching low levels.
Covid levels in wastewater are falling in most European countries. In the USA, Covid activity also fell slightly but remains at high levels in a some states. Flu activity in both the USA and Canada has started to fall.
As always, if you have any comments on this Covid Situation Report or suggestions for topics to cover, please post a message below.
Thanks for reading Seeing The Forest for the Trees! Subscribe for free to receive new posts and support my work.
Appendix 1. Test positivity rates and prevalence
Positivity rates are derived from the results of hospital laboratory tests conducted on patients exhibiting symptoms of respiratory diseases. Test positivity is the percentage of patients who test positive for Covid of the total number of patients tested. Since the individuals tested for this measure are not a representative sample of the general population it differs from prevalence, which is derived from a representative sample of the population.
This report belongs to a weekly series summarising the Covid situation across the UK's home nations and other countries.
Thanks for reading Seeing The Forest for the Trees! Subscribe for free to receive new posts and support my work.
This week's report covers the latest weekly indicators of respiratory illness activity for England, along with the most recent data for Scotland, Wales, and Northern Ireland. The report also presents the data on Covid levels in selected countries in Europe and North America.
Summary.
2026 continues the good news with the main Covid indicators in England, Scotland, Wales, and Northern Ireland remaining low, indicating a low level of risk.
Flu and RSV activity has fallen to medium levels for all home nations, indicating that this years winter Flu season has peaked.
In England, the Covid test positivity rate and key hospital indicators stayed steady this week, well within the baseline activity level. Although Flu activity has fallen from its recent peak and is now circulating at medium levels. Hospital admissions remain highest among those over 85 years old with Flu and children under 5 years with RSV.
In Scotland, all indicators of Covid activity remained at low levels of activity this week. Positivity rates and hospital admissions for Flu have fallen significantly from the recent peak but remain at medium levels of activity.
In the past week, Covid hospital admissions in Wales remained at low levels of activity. Flu hospital admissions fell this week but are still at medium activity levels.
In Northern Ireland, Covid activity was stable across all surveillance indicators in the past week and remains at low levels. Flu activity has fallen across all indicators.
Covid levels in wastewater fell in most European countries that still report this data.
Covid activity in the USA continued to increase and is now at a high level nationwide, though there are significant variations from state to state. Flu activity has risen sharply and is at high levels in many states.
Free vaccinations in the Autumn 2025 booster campaign will be available for adults aged 75 and older; residents in care homes for older adults; and immunosuppressed individuals aged 6 months and above until January 31, 2026.
People registered with a GP surgery in England can check their eligibility and book a vaccination appointment through this link.
Details of booking a free NHS Covid vaccination in Scotland can be found here, for Wales here, and in Northern Ireland here.
As always, it's important to remember that the risk of hospitalisation from Covid increases significantly with age and for the clinically vulnerable. Therefore, it is important to take appropriate measures such as self-isolating when experiencing Covid symptoms and enhancing ventilation or wearing masks whenever possible.
Status of main respiratory diseases in England.
This section begins with the latest data on test positivity rates for Covid in England. It's important to note that positivity is different from prevalence, which reflects the overall percentage of Covid cases in the general population. Appendix 1 offers a more detailed explanation of the distinction.
The following chart shows the test positivity rate for all Covid tests taken mapped against the UKHSA activity thresholds. The thresholds are based on the historical trend for Covid test positivity and, consequently, represent a relative risk. More details on this approach can be found in the Guide to Covid Surveillance Metrics.
The chart shows that the test positivity rate remained stable this week and continues to be well below the baseline level, indicating a low risk. Positivity rates remained low in all regions, with only slight differences between them.
The next chart highlights four key indicators of Covid in hospitals: weekly Emergency Department visits for Covid-like symptoms, test positivity rates among patients with respiratory issues, hospital admission rates, and admission rates for intensive care.
All key hospital indicators for Covid activity remained stable this week and overall activity is at historically low levels.
The following chart shows hospital admission rates per 100,000 for the three main respiratory viruses. Covid admissions are historically low, while Flu and RSV admissions have peaked and are at medium activity levels. However, both remain higher than Covid, indicating that Flu and RSV currently pose a greater risk. If you're experiencing Covid-like symptoms, there's a good chance it is Flu or RSV.
The last chart in this section shows hospital admission rates per 100,000 people by age group for Covid, Flu, and RSV for the week ending January 11, 2026.
The chart clearly shows that the risk of hospitalisation remains highest among the very youngest age group and the elderly for both Flu and RSV. While current hospital admissions for Covid are much lower, the elderly remain more likely to be hospitalised.
Although Flu activity is falling, it's still a good idea to check your eligibility and book a free vaccination through the following link if you have not already done so.
Scotland weekly hospital admissions and test positivity
Public Health Scotland (PHS) continue to publish weekly data on Covid hospital admissions and test positivity as well as wastewater monitoring data. The latest Viral respiratory diseases in Scotland surveillance report can be accessed here.
The following panel chart presents the most recent data for Covid levels in wastewater in blue, weekly Covid test positivity shown in red, Covid hospital admissions depicted in orange, and beds occupied by Covid patients in brown.
Once again, all Covid indicators in Scotland stayed stable and low this week, indicating the risk from the virus remains low.
The final chart in this section compares the test positivity rates for hospital patients with respiratory symptoms for Covid, Flu, and RSV. While Flu positivity rates have continued to fall they remain higher than for Covid.
Although Flu levels peaked earlier than expected this season, the high activity hasn't lasted, with steady drops across all measures. Confirmed cases fell by 18.3%, from 602 last week to 492 this week, keeping overall activity low. Hospital admissions also declined, with 226 this week compared to 303 the week before; over 38% were among people aged 75 and older. Influenza A(H3N2) remains the dominant strain.
RSV case rates have dropped compared to the previous week, with test positivity falling from 11.4% to 8.7%. Test positivity is going down among children under 14 and in the 15-44 and 65-74 age groups, but it's still rising in adults aged 45-64 and those over 75. Hospital admissions due to RSV are down to 169, with infants under 1 year making up 28.4% of admissions and adults 75 and older accounting for 25.4%.
Although the Flu season is coming to an end in Scotland, it's still possible to check if you're eligible for a free Flu vaccination here. If you haven't been contacted yet, you can still book your vaccination using the following link.
Wales Covid hospital admissions.
During the winter season, Public Health Wales publishes a weekly respiratory infection report, which is available here. The following chart provides the latest trend for weekly hospital admissions for the main respiratory viruses in Wales up to week ending Jan 11, 2026.
Covid hospital admissions have stayed fairly steady over the past few weeks and remain very low. Flu cases needing hospitalisation are falling, while RSV admissions remain stable at moderate levels.
This weeks Weekly Acute Respiratory Infection Report shows that Flu activity remains at a medium level. Confirmed case numbers have decreased in the current week, as has test positivity. In the week ending January 4, 2026, GP consultations for influenza-like illness dropped to low levels.
Respiratory Syncytial Virus (RSV) activity is also decreasing and is now at medium intensity levels.
Free Flu vaccinations are still available for individuals aged 65 and older, certain young children, pregnant women, and those with specific medical conditions. You can check your eligibility and book a vaccination through the provided link.
Status of main respiratory diseases in Northern Ireland.
Public Health Northern Ireland publish a weekly surveillance report on influenza, respiratory syncytial virus (RSV), and Covid providing an overview of these infections within Northern Ireland.
Covid activity activity has remained stable and at low levels across all surveillance indicators. Meanwhile, Flu activity has fallen across all surveillance indicators while RSV activity has decreased across most surveillance indicators and is circulating at moderately low levels.
The following chart shows the test positivity rates in Northern Ireland for the main respiratory illnesses — Flu, RSV, and Covid and RSV. Shading represents 95% confidence intervals.
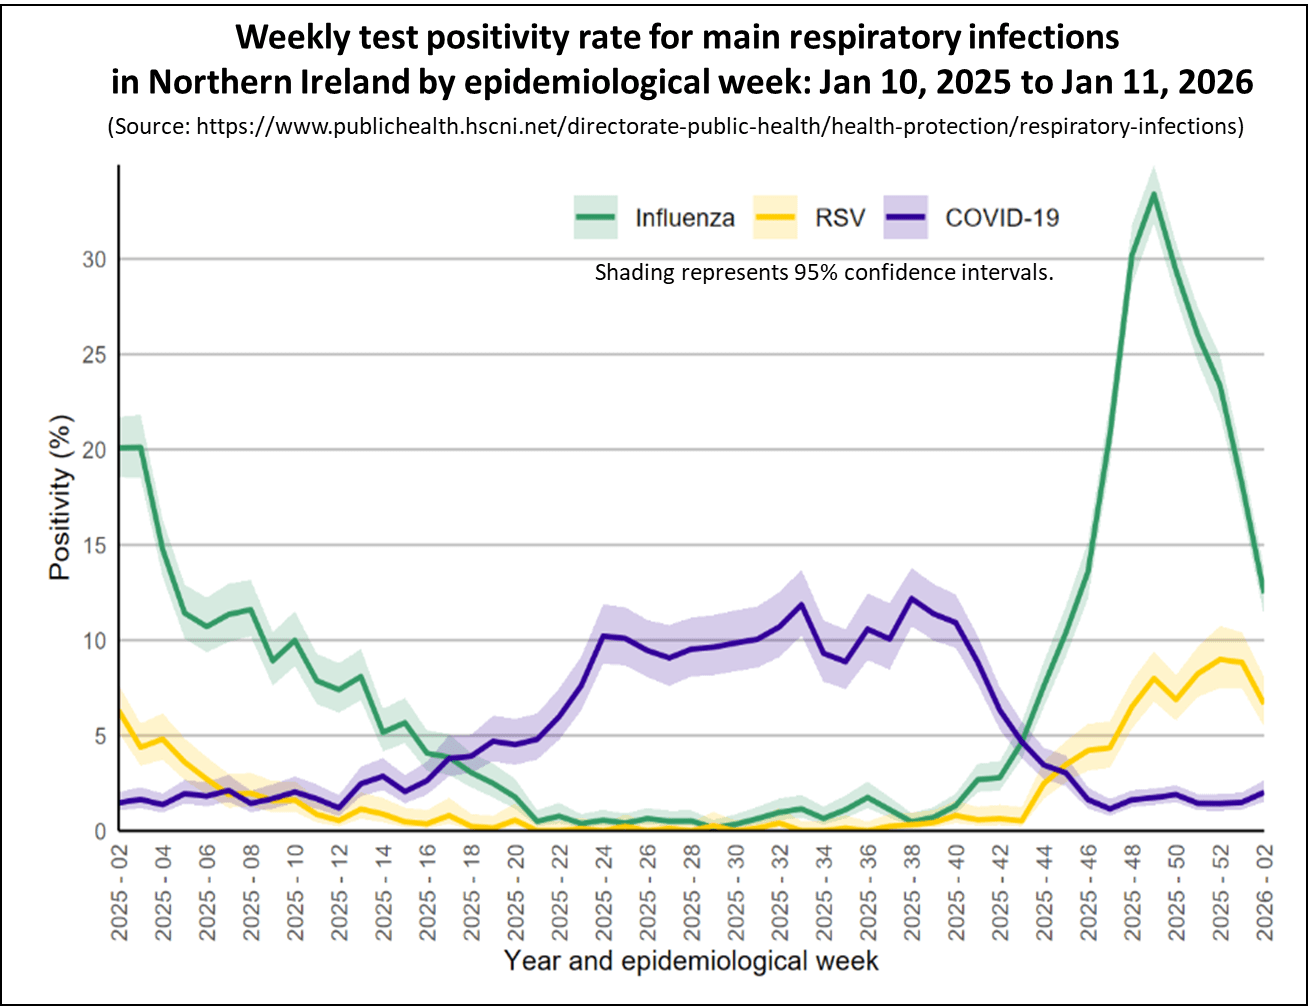
The chart shows that the Covid test positivity rate for patients with respiratory illnesses, marked in blue, has again remained stable this week, indicating a low level of Covid activity. Flu test positivity, shown in green, has continued to fall confirming that this wave has peaked.
Information about who qualifies for free flu vaccinations and how to schedule an appointment can be found at the provided link.
Flu vaccinations in Northern Ireland
Covid Levels in Europe and North America.
This section looks at the latest data on Covid activity in Europe and North America. While Covid levels have increased in several countries across these regions, they generally remain lower than those observed during earlier waves.
The following chart shows the latest levels of Covid up to week ending January 8, 2026 as measured by monitoring wastewater in a number of European countries that still publish this information.
This week, Covid levels in wastewater dropped in most European countries that still share this data, with only France seeing a slight increase but staying at low levels.
As of week ending January 3, 2026, Covid activity in the USA continues to increase, though the situation varies across different parts of the country.
The following chart shows the weekly trend for the national key Covid indicators covering wastewater activity levels, percent of emergency department visits due to Covid, test positivity, and the hospital admission rate in the USA.
The panel chart shows Covid levels in wastewater have climbed and are now high for the week ending January 3, 2026. Emergency department visits and Covid test positivity have also increased to moderate levels, while hospital admissions remain relatively low.
Wastewater analysis shows that Covid levels are highest in the Northeast and Mid West states, while staying relatively low in the South and West regions, as illustrated in the map below. Each state is coloured based on activity levels, ranging from very high (dark red) to very low (light green), with grey indicating no data available. States with increasing activity levels are marked with cross-hatching.
The interactive map lets you hover over any state using your cursor to see more details about wastewater viral activity levels. It shows data from states nationwide for the week ending January 3, 2026.
The next chart compares the percentage of Emergency Department visits caused by Covid and Flu. It indicates that while activity for Covid is moderate, Flu activity has continued to increase significantly and is at a high level.
Flu activity levels also differ across states, as shown on the following interactive map, with cases on the rise in 28 states, including 21 experiencing high or very high levels.
Finally, the latest data from Canada, up to December 27, 2025, shows that Covid wastewater levels remain steady at moderate levels, while flu activity may have peaked.
In conclusion
Although the amount of data currently being published is reduced, the information available for all home nations show that Covid activity is relatively low. Flu activity had fallen from its recent peak although is still at moderate levels.
Covid levels in wastewater are falling in most European countries. In the USA, Covid activity is increasing and at high levels with a few states showing very high levels. Flu activity in both the USA and Canada has increased significantly over the past few weeks.
As always, if you have any comments on this Covid Situation Report or suggestions for topics to cover, please post a message below.
Thanks for reading Seeing The Forest for the Trees! Subscribe for free to receive new posts and support my work.
Appendix 1. Test positivity rates and prevalence
Positivity rates are derived from the results of hospital laboratory tests conducted on patients exhibiting symptoms of respiratory diseases. Test positivity is the percentage of patients who test positive for Covid of the total number of patients tested. Since the individuals tested for this measure are not a representative sample of the general population it differs from prevalence, which is derived from a representative sample of the population.
This report belongs to a weekly series summarising the Covid situation across the UK's home nations and other countries.
As this is the first report of 2026, I'd like to welcome readers back after the break and wish everyone a happy and healthy New Year!
Thanks for reading Seeing The Forest for the Trees! Subscribe for free to receive new posts and support my work.
This week's report covers the latest weekly indicators of respiratory illness activity for England, along with the most recent data for Scotland, Wales, and Northern Ireland. The report also presents the data on Covid levels in selected countries in Europe and North America. Finally, there's an update on the latest status of the Autumn 2025 Covid booster campaign including data on inequalities in coverage across England.
Summary.
2026 starts with the main Covid indicators in England, Scotland, Wales, and Northern Ireland remaining low, indicating a low level of risk.
Flu and RSV activity remains at medium levels for all home nations, although there are signs that this years winter Flu season has peaked.
In England, the Covid test positivity rate and key hospital indicators stayed steady this week, well within the baseline activity level. Although Flu activity has fallen from its recent peak and is now circulating at medium levels, this weeks activity showed mixed trends. Hospital admissions remain highest among people over 85 years old with Flu and children under 5 years with RSV.
In Scotland, all indicators of Covid activity remained at low levels of activity this week. Positivity rates and hospital admissions for Flu have fallen significantly from the recent peak but remain at medium levels of activity.
In the past week, Covid hospital admissions in Wales remained at low levels of activity. Flu-related hospital admissions have dropped from their recent peak but held steady this week, staying at medium activity levels.
In Northern Ireland, Covid activity was stable across all surveillance indicators in the past week and remains at low levels. Flu activity has fallen across most indicators.
This week sees a mixed picture for European countries reporting Covid levels in wastewater. Levels increased in some countries, though activity levels varied considerable between countries.
This week, Covid activity in the USA has risen to a moderate level nationwide, though there are significant variations from state to state. Flu activity has risen sharply and is at high levels in many states.
The NHS Autumn Covid booster campaign started on October 1, 2025 with the aim of completing most vaccinations by the end of November 2025. While there's been reasonably good progress for those aged 75 and older, immunosuppressed individuals still have much lower coverage.
In England, coverage among the immunosuppressed for all age groups remains much lower at just 38%. There are also significant differences in coverage between regions, ethnic groups, and more deprived areas.
Free vaccinations in the Autumn 2025 booster campaign will be available for adults aged 75 and older; residents in care homes for older adults; and immunosuppressed individuals aged 6 months and above until January 31, 2026.
People registered with a GP surgery in England can check their eligibility and book a vaccination appointment through this link.
Details of booking a free NHS Covid vaccination in Scotland can be found here, for Wales here, and in Northern Ireland here.
As always, it's important to remember that the risk of hospitalisation from Covid increases significantly with age and for the clinically vulnerable. Therefore, it is important to take appropriate measures such as self-isolating when experiencing Covid symptoms and enhancing ventilation or wearing masks whenever possible.
Status of main respiratory diseases in England.
This section begins with the latest data on test positivity rates for Covid in England. It's important to note that positivity is different from prevalence, which reflects the overall percentage of Covid cases in the general population. Appendix 1 offers a more detailed explanation of the distinction.
The following chart shows the test positivity rate for all Covid tests taken mapped against the UKHSA activity thresholds. The thresholds are based on the historical trend for Covid test positivity and, consequently, represent a relative risk. More details on this approach can be found in the Guide to Covid Surveillance Metrics.
The chart shows that the test positivity rate remained stable this week and continues to stay well below the baseline level, indicating a low risk. Positivity rates remained low in all regions, with only slight differences between them.
The next chart highlights four key indicators of Covid in hospitals: weekly Emergency Department visits for Covid-like symptoms, test positivity rates among patients with respiratory issues, hospital admission rates, and admission rates for intensive care.
All key hospital indicators for Covid activity remained stable this week and overall activity is at historically low levels.
The following chart shows hospital admission rates per 100,000 for the three main respiratory viruses. Covid admissions are historically low, while Flu and RSV admissions appear to have peaked at medium activity levels. However, both are now much higher than Covid, indicating that Flu and RSV currently pose a greater risk. If you're experiencing Covid-like symptoms, there's a good chance it is Flu or RSV.
The last chart in this section shows hospital admission rates per 100,000 people by age group for Covid, Flu, and RSV for the week ending January 4, 2026.
The chart clearly shows that the risk of hospitalisation remains highest among the very youngest age group and the elderly for both Flu and RSV. While current hospital admissions for Covid are lower, the elderly remain more likely to be hospitalised.
Finally, the UKHSA released a study this week on how effective this year's Flu vaccine is at preventing visits to Emergency Departments and hospitalisations. The study concluded that despite the emergence of a drifted influenza A(H3N2) strain driving an unusually early 2025/26 Flu season, early estimates provide reassurance that current vaccines provide protection in children, adolescents and adults in the early period post-vaccination. However, they were less protective in those aged 65 years and older.
With the Flu season underway, it's a good idea to check your eligibility and book a free vaccination through the following link.
Scotland weekly hospital admissions and test positivity
Public Health Scotland (PHS) continue to publish weekly data on Covid hospital admissions and test positivity as well as wastewater monitoring data. The latest Viral respiratory diseases in Scotland surveillance report can be accessed here.
The following panel chart presents the most recent data for weekly Covid test positivity shown in red, Covid levels in wastewater in blue, Covid hospital admissions depicted in orange, and beds occupied by Covid patients in brown.
Covid indicators in Scotland stayed stable and low this week, indicating the risk from the virus remains low.
The final chart in this section compares the test positivity rates for hospital patients with respiratory symptoms for Covid, Flu, and RSV. While Flu positivity rates have started to fall rapidly they remain higher than for Covid.
Despite Flu levels peaking earlier than expected this season, high activity has not been sustained, with decreases seen across all measures. Influenza A(H3N2) continues to dominate.
RSV laboratory confirmed case rates have fallen overall in the past two weeks, though test positivity continued to increase to 10.8%. Through both measures, RSV activity has since decreased in children aged under 5 but continues to rise in adults aged 45 plus. Hospital admissions due to RSV decreased to 242, driven by decreases in those aged under 5. This is typical of RSV seasonality, with peaks observed first in infants before older adults.
With the Flu season well underway in Scotland, now is the time to check if you're eligible for a free Flu vaccination here. If you haven't been contacted yet, you can still book your vaccination using the following link.
Wales Covid hospital admissions.
During the winter season, Public Health Wales publishes a weekly respiratory infection report, which is available here. The following chart provides the latest trend for weekly hospital admissions for the main respiratory viruses in Wales up to week ending Jan 4, 2026.
Covid hospital admissions have remained broadly stable for the past few weeks and are at low levels. Flu and RSV admissions show signs of increasing, but remain at moderate levels.
This weeks Weekly Acute Respiratory Infection Report shows that Flu activity remains at a medium level. Although hospital admissions for Flu increased slightly, confirmed case numbers have decreased in the current week, as has test positivity. Respiratory Syncytial Virus (RSV) is decreasing but remains at very high intensity levels. Covid case numbers have remained broadly stable and low in recent weeks.
Free Flu vaccinations are still available for individuals aged 65 and older, certain young children, pregnant women, and those with specific medical conditions. You can check your eligibility and book a vaccination through the provided link.
Status of main respiratory diseases in Northern Ireland.
Public Health Northern Ireland publish a weekly surveillance report on influenza, respiratory syncytial virus (RSV), and Covid providing an overview of these infections within Northern Ireland.
Covid activity activity has remained stable and at low levels across all surveillance indicators. Meanwhile, Flu activity has decreased across the majority of surveillance indicators although rates are highest in young children. RSV activity has decreased across some surveillance indicators and is circulating at moderately low levels.
The following chart shows the test positivity rates in Northern Ireland for the main respiratory illnesses — Flu, RSV, and Covid and RSV. Shading represents 95% confidence intervals.
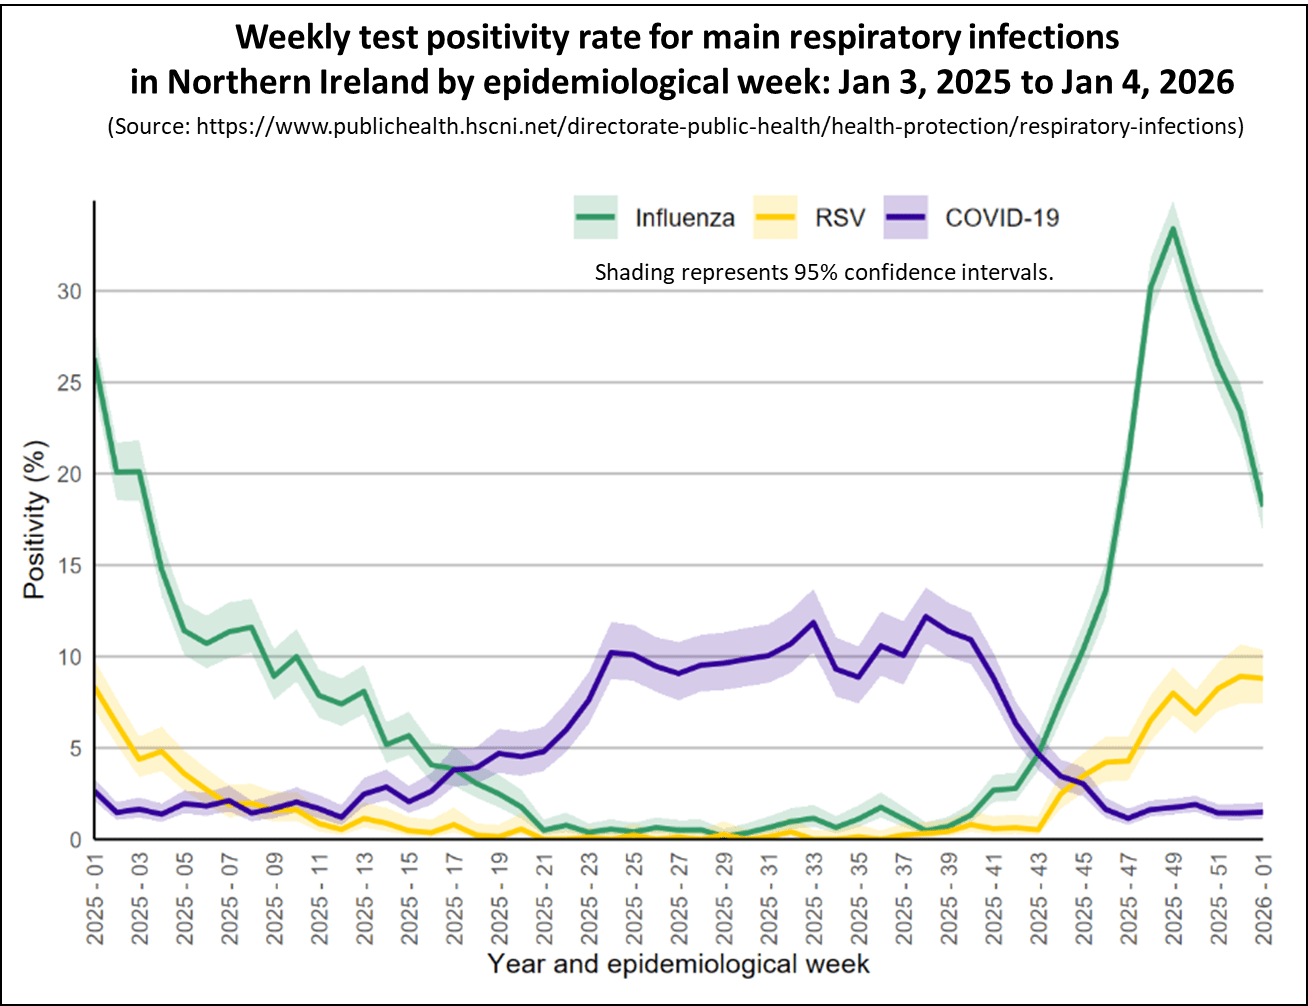
The chart shows that the Covid test positivity rate for patients with respiratory illnesses, marked in blue, has stayed about the same this week, indicating a low level of Covid activity. Flu test positivity, shown in green, has continued to fall indicating that this wave has peaked.
Information about who qualifies for free flu vaccinations and how to schedule an appointment can be found at the provided link.
Flu vaccinations in Northern Ireland
Covid Levels in Europe and North America.
This section looks at the latest data on Covid activity in Europe and North America. While Covid levels have increased in several countries across these regions, they generally remain lower than those observed during earlier waves.
The following chart shows the latest levels of Covid as measured by monitoring wastewater in a number of European countries that still publish this information. Unfortunately, due to the end of year holidays. data for the last week of 2025 has not been published for Germany, Denmark, and France.
Once again, it's a mixed picture for European countries reporting Covid levels in wastewater. While Covid levels in wastewater rose in Germany and Sweden, activity varied quite considerably, with Austria and France experiencing relatively low levels.
As of week ending December 27, 2025, Covid activity in the USA is on the rise, though the situation varies across different parts of the country.
The following chart shows the weekly trend for the national key Covid indicators covering test positivity, wastewater activity levels, percent of emergency department visits due to Covid, and the hospital admission rate in the USA.
The panel chart shows that Covid levels in wastewater and emergency department visits have risen to moderate levels, whereas test positivity and hospital admissions remain relatively low.
Wastewater analysis shows that Covid levels are highest in the Northeast and Mid West states, while staying relatively low in the South and West regions, as illustrated in the map below. Each state is coloured based on activity levels, ranging from very high (dark red) to very low (light green), with grey indicating no data available. States with increasing activity levels are marked with cross-hatching.
The interactive map lets you hover over any state to see more details about wastewater viral activity levels. It displays data for states across the country for the week ending Dec 27, 2025.
The next chart shows the percentage of Emergency Department visits caused by Covid and Flu. It indicates that while activity for Covid is moderate, Flu activity has increased significantly and is at a high level.
Flu activity levels differ across states, as shown on the following interactive map, with cases on the rise in 39 states, including 23 experiencing high or very high levels.
Finally, the latest data from Canada, up to December 20, 2025, shows that Covid wastewater levels remain steady at moderate levels, while flu activity is rising fast.
Autumn 2025 Covid Booster campaign.
The NHS Autumn Covid booster campaign started on October 1, 2025. This year's Autumn vaccination campaign is set to end earlier in England than in previous years, with the majority of vaccinations scheduled to be completed by the end of November. However, outreach efforts to administer vaccines in underserved communities will continue after this date.
The next chart in this section compares the latest Covid vaccination coverage by Home Nation for the two main eligible groups. It shows that coverage is much lower for immunosuppressed individuals compared to those aged 75 and older.
This week, NHS England shared more details about the Autumn 2025 Covid booster campaign, pointing out the uneven coverage across the country as the campaign nears its end. The following chart illustrates the regional difference in coverage for the two main eligible groups.
The chart shows a clear regional difference with London having the lowest coverage for both eligible groups. This is consistent with the pattern seen in previous campaigns.
The final chart in this section shows the inequality in coverage by deprivation level and ethnicity.
Just like in previous campaigns, people in the most deprived areas are far less likely to be vaccinated compared to those in the least deprived areas. Likewise, vaccination rates continue to be much lower among individuals from ethnic minority groups.
In conclusion
Although the amount of data currently being published is reduced, the information available for all home nations show that Covid activity is relatively low. Flu activity had fallen from its recent peak although is still at moderate levels.
Covid activity in Europe is showing a mixed picture with some countries increasing, particularly in Germany. In the USA, Covid activity levels is now moderate with a few states showing high levels. Flu activity in both the USA and Canada has increased significantly over the past few weeks.
As always, if you have any comments on this Covid Situation Report or suggestions for topics to cover, please post a message below.
Thanks for reading Seeing The Forest for the Trees! Subscribe for free to receive new posts and support my work.
Appendix 1. Test positivity rates and prevalence
Positivity rates are derived from the results of hospital laboratory tests conducted on patients exhibiting symptoms of respiratory diseases. Test positivity is the percentage of patients who test positive for Covid of the total number of patients tested. Since the individuals tested for this measure are not a representative sample of the general population it differs from prevalence, which is derived from a representative sample of the population.
This report belongs to a weekly series summarising the Covid situation across the UK's home nations and other countries.
Wishing all readers a Merry Christmas and a Happy New Year.
This is the last report of the year as we head into the holiday break. The next Situation Report will be out on January 8, 2026 when regular service resumes.
Thanks for reading Seeing The Forest for the Trees! Subscribe for free to receive new posts and support my work.
This week's report covers the latest weekly indicators of respiratory illness activity for England, along with the most recent data for Scotland, and Wales. The report also presents the data on Covid and Flu levels in the USA.
Summary.
Once again, the main Covid indicators in England, Scotland, and Wales stayed low, indicating a low level of risk.
Flu activity fell across all home nations, indicating this years winter Flu season has peaked. However, Flu is still circulating at medium levels so take care over the holiday period.
In England, the Covid test positivity rate stayed steady this week, well within the baseline activity level. The main hospital indicators also remained unchanged, indicating a low level of risk. Flu activity fell this week, with declines in both hospital admissions and test positivity rates, though levels remain at a medium activity level.
In Scotland, all indicators of Covid activity remained at low levels of activity this week. Positivity rates and hospital admissions for Flu have continued to fall but remain at medium levels of activity.
In the past week, Covid hospital admissions in Wales fell slightly and remain at low levels of activity. Hospital admissions for Flu also fell but remain at medium activity levels.
All indicators show that Covid activity in the USA is low although some states are seeing increased activity. Flu indicators continue to increase and are at moderate levels.
As always, it's important to remember that the risk of hospitalisation from Covid increases significantly with age and for the clinically vulnerable. Therefore, it is important to take appropriate measures such as self-isolating when experiencing Covid symptoms and enhancing ventilation or wearing masks whenever possible. Taking these precautions also reduces the risk of passing on Flu or RSV.
Status of main respiratory diseases in England.
This section begins with the latest data on test positivity rates for Covid in England. It's important to note that positivity is different from prevalence, which reflects the overall percentage of Covid cases in the general population. Appendix 1 offers a more detailed explanation of the distinction.
The following chart shows the test positivity rate for all Covid tests taken mapped against the UKHSA activity thresholds. The thresholds are based on the historical trend for Covid test positivity and, consequently, represent a relative risk. More details on this approach can be found in the Guide to Covid Surveillance Metrics.
The chart shows that the test positivity rate has dropped to its lowest point in three years and is now well below the baseline level of activity, indicating a low risk level. Positivity rates fell across all regions, showing only small differences between them.
The next chart highlights four key indicators of Covid in hospitals: weekly Emergency Department visits for Covid-like symptoms, test positivity rates among patients with respiratory issues, hospital admission rates, and admission rates for intensive care.
All key hospital indicators for Covid activity remained stable this week and overall activity is at historically low levels.
The final chart shows hospital admission rates per 100,000 for the three main respiratory viruses. Covid admissions are historically low, while Flu admissions are falling but remains at medium activity levels. RSV admissions have started to rise again but remain at moderate levels. However, both are now much higher than Covid, indicating that Flu and RSV currently pose a greater risk. If you're experiencing Covid-like symptoms, there's a good chance it is Flu or RSV.
With the Flu season continuing, it's a good idea to check your eligibility and book a free vaccination through the following link.
Scotland weekly hospital admissions and test positivity
Public Health Scotland (PHS) continue to publish weekly data on Covid hospital admissions and test positivity as well as wastewater monitoring data. The latest Viral respiratory diseases in Scotland surveillance report can be accessed here.
The following panel chart presents the most recent data for weekly Covid test positivity shown in red, Covid levels in wastewater in blue, Covid hospital admissions depicted in orange, and beds occupied by Covid patients in brown.
Covid indicators in Scotland stayed stable and low this week, indicating the risk from the virus remains low.
The final chart in this section compares the test positivity rates for hospital patients with respiratory symptoms for Covid, Flu, and RSV. While Flu positivity rates have started to fall they remain moderately high and much higher than for Covid.
Flu activity in Scotland has dropped again across most measures, holding at a medium level overall based on lab-confirmed cases. Reported cases fell by 35% to 1,297 from 1,994, though activity stayed high in the 1-4 and 5-14 age groups. This week saw 678 Flu-related hospital admissions, down from 950 last week. There's no sign of more severe illness based on deaths or excess mortality, though reporting delays remain.
With the Flu season still underway in Scotland, now is the time to check if you're eligible for a free Flu vaccination here. If you haven't been contacted yet, you can book your vaccination using the following link.
Wales Covid hospital admissions.
During the winter season, Public Health Wales publishes a weekly respiratory infection report, which is available here. The following chart provides the latest trend for weekly hospital admissions for the main respiratory viruses in Wales up to week ending Dec 21, 2025.
Covid hospital admissions have remained broadly stable for the past few weeks and are at low levels. Flu and RSV admissions fell slightly, but remain at moderate levels.
This weeks Weekly Acute Respiratory Infection Report shows that while flu admissions have fallen slightly, it is still circulating at medium intensity. Respiratory Syncytial Virus (RSV) is currently circulating in the community, with confirmed cases in children under 5 years old at high levels, although the incidence decreased in the most recent week.
Free Flu vaccinations are available for individuals aged 65 and older, certain young children, pregnant women, and those with specific medical conditions. With the Flu season continuing, it's a good idea to check your eligibility and book a vaccination through the provided link.
Covid Levels in USA.
This section reviews the latest data on Covid levels in the USA, showing that levels mostly remain low across the country. However, some states are starting to see signs of increasing activity.
The following chart shows the weekly trend up to December 13 for key national Covid indicators, including test positivity, wastewater activity levels, the percentage of emergency department visits related to Covid, and the hospital admission rate.
Whilst there has been a slight increase across all indicators, Covid activity remains relatively low nationally.
The next chart shows the regional wastewater activity trends for Covid, highlighting that levels are climbing the fastest in the Northeast and Mid West regions.
Wastewater analysis reveals that although Covid levels remain low or very low in most US states, many are starting to see increases, as shown in the map below. Each state is coloured based on activity levels, ranging from very high (dark red) to very low (light green), with grey indicating no data available. States with increasing activity levels are marked with cross-hatching.
The interactive map lets you hover over any state to see more details about wastewater viral activity levels. It displays data for states across the country for the week ending Dec 13, 2025.
The interactive map shows wastewater activity levels increased in 24 states last week, down from 40 the week before, while 34 states remained at low or very low activity levels, down from 38 the previous week.
The final chart for the USA shows the percentage of Emergency Department visits caused by the main respiratory illnesses—Covid and Flu. It indicates that activity levels for these viruses are currently low, though Flu cases are continuing to increase.
In conclusion
Although the amount of data currently being published is reduced, the information available for all home nations show that Covid activity is relatively low. The recent rise in Flu activity has peaked but is still at medium levels of activity.
In the USA, Covid activity levels remain low although some states are seeing increased activity. Flu activity have increased indicating that the Winter Flu season has started
As always, if you have any comments on this Covid Situation Report or suggestions for topics to cover, please post a message below.
Thanks for reading Seeing The Forest for the Trees! Subscribe for free to receive new posts and support my work.
Appendix 1. Test positivity rates and prevalence
Positivity rates are derived from the results of hospital laboratory tests conducted on patients exhibiting symptoms of respiratory diseases. Test positivity is the percentage of patients who test positive for Covid of the total number of patients tested. Since the individuals tested for this measure are not a representative sample of the general population it differs from prevalence, which is derived from a representative sample of the population.
This report belongs to a weekly series summarising the Covid situation across the UK's home nations and other countries.
This is the last full report of the year, as there will be limited data over the Christmas period; however, I plan to publish a shortened report on Wednesday, December 24, covering the available information.
Thanks for reading Seeing The Forest for the Trees! Subscribe for free to receive new posts and support my work.
This week's report covers the latest weekly indicators of respiratory illness activity for England, along with the most recent data for Scotland, Wales, and Northern Ireland. The report also presents the data on Covid levels in selected countries in Europe and North America. Finally, there is an update latest status on the Autumn 2025 Covid Booster campaign.
Summary.
Once again, the main Covid indicators in England, Scotland, Wales, and Northern Ireland stayed low, indicating a low level of risk.
Flu and RSV activity remained broadly stable but at medium levels for all home nations, indicating this years winter Flu season may have peaked.
Public Heath Scotland report that early seasonal Flu vaccine effectiveness data shows the vaccine is providing good protection against the currently circulating variant. The data shows a 78% reduced risk of hospitalisation in ages 2-17 and 37% in those 65 and over. Similar results were observed in pooled estimates from Scotland, Northern Ireland and Wales, and with early estimates from England.
In England, the Covid test positivity rate stayed steady this week, well within the baseline activity level. The main hospital indicators also remained unchanged, indicating a low level of risk. Flu activity has stopped increasing, with both hospital admissions stable and test positivity rates starting to fall. Hospital admissions remain highest among people over 85 years old with Flu and children under 5 years with RSV.
In Scotland, all indicators of Covid activity remained at low levels of activity this week. Positivity rates and hospital admissions for Flu have started to fall and are now at medium levels of activity.
In the past week, Covid hospital admissions in Wales fell slightly and remain at low levels of activity. Hospital admissions for Flu also fell but remain at medium activity levels.
In Northern Ireland, Covid activity remained stable across all surveillance indicators in the past week and are at low levels. Flu and RSV activity levels have stabilised and are likely to have peaked.
This week is again a mixed picture for European countries reporting Covid levels in wastewater. Levels increased across all countries, though activity levels varied considerable between countries.
CDC data have resumed publishing data this week and all indicators show that Covid activity in the USA is low although some states are seeing increased activity. Flu indicators are increasing albeit from low levels.
The NHS Autumn Covid booster campaign started on October 1, 2025 with the aim of completing most vaccinations by the end of November 2025. While there's been reasonably good progress for those aged 75 and older, immunosuppressed individuals still have much lower coverage.
Free vaccinations in the Autumn 2025 booster campaign will be available for adults aged 75 and older by January 31, 2026; residents in care homes for older adults; and immunosuppressed individuals aged 6 months and above.
People registered with a GP surgery in England can check their eligibility and book a vaccination appointment through this link.
Details of booking a free NHS Covid vaccination in Scotland can be found here, for Wales here, and in Northern Ireland here.
As always, it's important to remember that the risk of hospitalisation from Covid increases significantly with age and for the clinically vulnerable. Therefore, it is important to take appropriate measures such as self-isolating when experiencing Covid symptoms and enhancing ventilation or wearing masks whenever possible.
Status of main respiratory diseases in England.
This section begins with the latest data on test positivity rates for Covid in England. It's important to note that positivity is different from prevalence, which reflects the overall percentage of Covid cases in the general population. Appendix 1 offers a more detailed explanation of the distinction.
The following chart shows the test positivity rate for all Covid tests taken mapped against the UKHSA activity thresholds. The thresholds are based on the historical trend for Covid test positivity and, consequently, represent a relative risk. More details on this approach can be found in the Guide to Covid Surveillance Metrics.
The chart indicates that the test positivity rate was again stable this week and is well below the baseline level of activity, indicating a low level of risk. Positivity rates decreased across all regions, showing only small differences between them.
The next chart highlights four key indicators of Covid in hospitals: weekly Emergency Department visits for Covid-like symptoms, test positivity rates among patients with respiratory issues, hospital admission rates, and admission rates for intensive care.
All key hospital indicators for Covid activity remained stable this week and overall activity is at historically low levels.
The final chart shows hospital admission rates per 100,000 for the three main respiratory viruses. Covid admissions are historically low, while Flu and RSV admissions appear to have peaked at medium activity levels. However, both are now much higher than Covid, indicating that Flu and RSV currently pose a greater risk. If you're experiencing Covid-like symptoms, there's a good chance it is Flu or RSV.
The last chart in this section shows hospital admission rates per 100,000 people by age group for Covid, Flu, and RSV for the week ending December 14, 2025.
The chart clearly shows that the risk of hospitalisation remains highest among the very youngest age group and the elderly for both Flu and RSV. While current hospital admissions for Covid are lower, the elderly remain more likely to be hospitalised.
With the Flu season underway, it's a good idea to check your eligibility and book a free vaccination through the following link.
Scotland weekly hospital admissions and test positivity
Public Health Scotland (PHS) continue to publish weekly data on Covid hospital admissions and test positivity as well as wastewater monitoring data. The latest Viral respiratory diseases in Scotland surveillance report can be accessed here.
The following panel chart presents the most recent data for weekly Covid test positivity shown in red, Covid levels in wastewater in blue, Covid hospital admissions depicted in orange, and beds occupied by Covid patients in brown.
Covid indicators in Scotland stayed stable and low this week, indicating the risk from the virus remains low.
The final chart in this section compares the test positivity rates for hospital patients with respiratory symptoms for Covid, Flu, and RSV. While Flu positivity rates have started to fall they remain much higher than for Covid.
Flu activity in Scotland has steadied or decreased across most measure, returning to medium activity overall based on reporting of laboratory-confirmed cases. Cases decreased by 20% to 1918 from 2410, and activity level dropped to high (from very high) in the 1-4 and 5-14 age groups. There were 912 hospital admissions due to Flu this week, down from 1039 in the previous week. There are no indications of more severe disease as measured by deaths or excess mortality, although there are reporting lags. Influenza A(H3N2) continues to dominate.
With the Flu season well underway in Scotland, now is the time to check if you're eligible for a free Flu vaccination here. If you haven't been contacted yet, you can book your vaccination using the following link.
Wales Covid hospital admissions.
During the winter season, Public Health Wales publishes a weekly respiratory infection report, which is available here. The following chart provides the latest trend for weekly hospital admissions for the main respiratory viruses in Wales up to week ending Dec 14, 2025.
Covid hospital admissions have remained broadly stable for the past few weeks and are at low levels. Flu and RSV admissions fell slightly, but remain at moderate levels.
This weeks Weekly Acute Respiratory Infection Report shows that while flu admissions have fallen slightly, it is still circulating at medium intensity, with increases in test positivity and confirmed cases. Presentations of acute respiratory infections to GPs increased in most age groups. Respiratory Syncytial Virus (RSV) is currently circulating, with confirmed cases in children under 5 years old at very high levels, although the incidence decreased in the most recent week.
Free Flu vaccinations are available for individuals aged 65 and older, certain young children, pregnant women, and those with specific medical conditions. With the Flu season in full swing, it's a good idea to check your eligibility and book a vaccination through the provided link.
Status of main respiratory diseases in Northern Ireland.
Public Health Northern Ireland publish a weekly surveillance report on influenza, respiratory syncytial virus (RSV), and Covid providing an overview of these infections within Northern Ireland.
Covid activity activity has remained stable and at low levels across all surveillance indicators. Meanwhile, Flu activity has decreased across the majority of surveillance indicators although rates are highest in young children. RSV activity has decreased across some surveillance indicators and is circulating at moderately low levels.
The following chart shows the test positivity rates in Northern Ireland for the main respiratory illnesses — Flu, RSV, and Covid and RSV. Shading represents 95% confidence intervals.
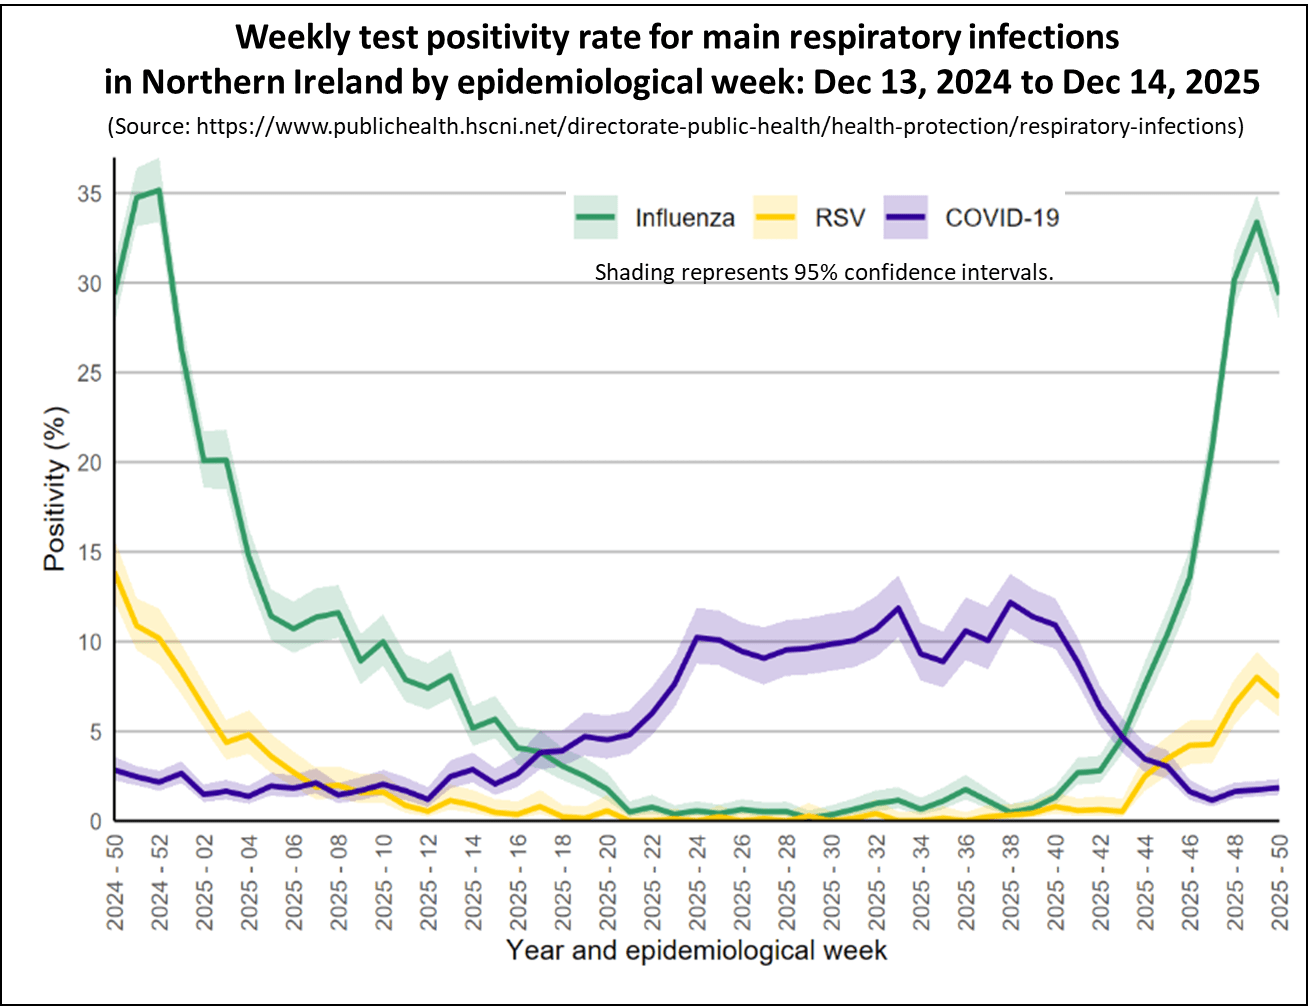
The chart shows that the Covid test positivity rate for patients with respiratory illnesses, marked in blue, has stayed about the same this week at 1.8%, compared to 1.7% last week, indicating a low level of Covid activity.
Flu test positivity, shown in green, has stopped suggesting that this wave has peaked. This week, Flu positivity reached 29.3%, down from 33.4% in the prior week. The highest rate remains in the 5-14 age group, with 48.4% testing positive.
Information about who qualifies for free flu vaccinations and how to schedule an appointment can be found at the provided link.
Flu vaccinations in Northern Ireland
Covid Levels in Europe and North America.
This section looks at the latest data on Covid activity in Europe and North America. While Covid levels have increased in several countries across these regions, they generally remain lower than those observed during earlier waves.
The following chart shows the latest levels of Covid as measured by monitoring wastewater in a number of European countries that still publish this information.
Once again, it's a mixed picture for European countries reporting Covid levels in wastewater. While Covid levels in wastewater rose across all countries, activity varied quite considerably, with Denmark seeing moderately high levels and France experiencing relatively low levels. The situation in Austria is presently uncertain due to recent changes in their reporting methods is making the data difficult to interpret.
The CDC has resumed publishing U.S. health metrics after the government shutdown, and the latest data shows Covid activity remains low nationwide. However, some areas are showing signs of increasing activity.
The following chart presents the weekly trend for the national key Covid indicators covering test positivity, wastewater activity levels, percent of emergency department visits due to Covid, and the hospital admission rate. Whilst there has been a slight increase across all indicators, Covid activity remains relatively low nationally.
This chart shows the regional wastewater activity trends for Covid, highlighting that levels are climbing the fastest in the Northeast.
Wastewater analysis reveals that although Covid levels remain low or very low in most US states, many are starting to see increases, as shown in the map below. Each state is coloured based on activity levels, ranging from very high (dark red) to very low (light green), with grey indicating no data available. States with increasing activity levels are marked with cross-hatching.
The interactive map lets you hover over any state to see more details about wastewater viral activity levels. It displays data for states across the country for the week ending Dec c, 2025.
The interactive map shows wastewater activity levels increased in 40 states last week, up from 21 the week before, while 33 states remained at low or very low activity levels, down from 44 the previous week.
The final chart for the USA shows the percentage of Emergency Department visits caused by the main respiratory illnesses—Covid and Flu. It indicates that activity levels for these viruses are currently low, though Flu cases are continuing to increase.
Finally, the latest data from Canada shows that Covid wastewater levels are steady at moderate levels, while flu levels are rising fast.
Autumn 2025 Covid Booster campaign.
The NHS Autumn Covid booster campaign started on October 1, 2025. This year's Autumn vaccination campaign is set to end earlier in England than in previous years, with the majority of vaccinations scheduled to be completed by the end of November. However, outreach efforts to administer vaccines in underserved communities will continue after this date.
The following chart shows the number of Covid vaccinations given by week for each of the booster campaigns in England.
In the week ending December 14, there were 48,117 booster doses administered, down from 62,492 the previous week, bringing the total to 4.61 million doses as the campaign comes to a close.
The next chart in this section compares the latest Covid vaccination coverage by Home Nation for the two main eligible groups. It shows that coverage is much lower for immunosuppressed individuals compared to those aged 75 and older.
In conclusion
Although the amount of data currently being published is reduced, the information available for all home nations show that Covid activity is relatively low. The recent rise in Flu activity appears to have peaked at moderate levels.
Covid activity in Europe is showing some early signs of increasing, particularly in Germany. In the USA, activity levels remain low although some states are seeing increased activity.
As always, if you have any comments on this Covid Situation Report or suggestions for topics to cover, please post a message below.
Thanks for reading Seeing The Forest for the Trees! Subscribe for free to receive new posts and support my work.
Appendix 1. Test positivity rates and prevalence
Positivity rates are derived from the results of hospital laboratory tests conducted on patients exhibiting symptoms of respiratory diseases. Test positivity is the percentage of patients who test positive for Covid of the total number of patients tested. Since the individuals tested for this measure are not a representative sample of the general population it differs from prevalence, which is derived from a representative sample of the population.