
Young people and women most at risk, study finds, as researchers call for vegan products to be fortified with iodine in particular
Switching from dairy products to plant-based alternatives could lead to deficiencies in vital micronutrients, especially among young people and women, a study has found.
Even moving partly to vegan alternatives to milk, cheese and yoghurt could lead to falls in iodine, calcium, riboflavin and vitamin B12 if the substitutes, often based on soya, almonds or oats, are not fortified, scientists said.
Continue reading...Access to our £37,000 deposit in a savings account is restricted after a 'routine security review'
My wife's Revolut account was frozen in what it calls a "routine security review" over a week ago. Nothing has been requested from her - no documents, the source of funds, or ID - yet, as a result, our house deposit of £37,000 in a joint savings account is also restricted.
We're approaching the completion of our property purchase and have given notice on our rental home. Direct debits are bouncing and we're concerned about our credit records.
Continue reading...I grew up with spinal conditions that solidified my sense of being 'weak and weird'. By my late 30s, I was feeling burnt out. But an invitation from a colleague set me on an unexpected and exhilarating new path
In 2023, I was in the Alps trekking the 80-mile Tour du Mont Blanc when there came a moment I was no longer trekking, exactly. I was on my hands and knees. Frozen. And then I started to cry. Others were casually bopping past me, up and over like water around a stone. But I was stuck. Why can't I move? I thought.
I was not always fit enough to trek 80 miles in the Alps. As a child, I was the one who always got picked last in gym class. I would have picked me last too: by any measure, I was the most physically awkward kid in my year group. Other students bullied me and I was ashamed of my body. I felt weird, weak and sad.
Continue reading...Are you getting your RDA (recommended dose of art)? Along with 10,000 steps and five fruit and veg a day, this small, enjoyable change could make you much healthier - and happier
Name: Art.
Age: Art has been around for thousands of years. The drawings in Blombos Cave in South Africa, for example, are estimated to be about 73,000 years old. But this is less about how old and more about how often, and for how long.
Continue reading...I thought about her a lot after our friendship imploded. When our birthdays rolled around, I wondered what we'd be doing if we were still in touch
I was 26 when I lost my childhood friend. By that point, I'd known her for almost two-thirds of my life.
Our first conversation was at an ice-skating party when we were nine years old. I'd been nervous in the weeks leading up to the party because I couldn't ice-skate. Every time the Spice Girls' 2 Become 1 music video came on, the sight of Victoria Beckham singing on an ice rink filled me with impending doom. I was sure I would disgrace myself at the party.
Continue reading...He needs a dialysis machine to survive, but on a flight it was first damaged, then it was lost
My father suffers from terminal renal failure and relies on a highly specific dialysis machine every night to survive. British Airways' check-in staff twice insisted on checking this fragile 20kg lifeline into the aircraft hold where it was first damaged, then lost.
When his outbound flight arrived at Heathrow, it was returned broken resulting in a frantic search for a loan unit and hours spent in A&E so my father's blood could be monitored. On the return flight to Rome, the machine could not be found. My parents waited until 2am before being told to go home without the equipment that keeps my father alive.
Continue reading...A hot toddy might make you feel toasty, but drinking in cold conditions can be risky
Hot toddies, red wine, a dram of whisky: alcohol has long been a go-to remedy for keeping warm. But while a drink might make you feel warmer, does it actually help? "There's a perception of warmth, but in reality, it doesn't occur," says Winston Morgan, professor of toxicology, equity and inclusive practice at the University of East London.
Alcohol affects the body's temperature-regulating system. Our core body temperature is controlled by the hypothalamus, a region of the brain that helps regulate how we respond to changes in temperature. When we get too hot, blood vessels near the surface of the skin widen, a process known as vasodilation. This allows more warm blood to flow close to the skin, where heat can escape into the surrounding air. When we get too cold, the opposite happens. The blood vessels narrow, or constrict, reducing blood flow to the skin and helping to conserve heat.
Continue reading...Getting older and losing your autonomy is even harder without family around. You need to consider both the practical and emotional issues involved
My wife and I are in our late 70s, and have been married for more than 40 years. We didn't have kids and were rather traumatised after failed IVF.
My wife is Asian and has no UK-based family. I do, but they are not close geographically, nor are they people who would be able to give any support if needed. Friends are of a similar age and so have their own issues to deal with. My wife and I have always been a self-reliant unit, and we're both reasonably healthy, but I'm increasingly aware that there will soon come a time when help is needed.
Continue reading...Relying on technology can make us forgetful, but there are some simple ways to sharpen your recall. Memory experts describe the tricks and habits that can help
Memory can worsen as we age, but it is often possible to do something about it. Here, memory experts share their advice on how to improve your power of recall.
Continue reading...
This report belongs to a weekly series summarising the Covid situation across the UK's home nations and other countries.
Thanks for reading Seeing The Forest for the Trees! Subscribe for free to receive new posts and support my work.
This week's report highlights the latest trends in respiratory illness activity across England, Scotland, Wales, and Northern Ireland. It also shares provides details on recent Covid activity for selected countries in Europe, North America, and Asia.
Charts for the USA will be updated on Friday, Oct 30 to reflect the latest published data.
Summary.
This week, Covid trends in the UK show a mixed picture. In England, most indicators fell slightly, suggesting the risk stays low and isn't growing. In Scotland, all indicators increased slightly, with overall activity now at a medium level. Wales continues to see slow increases, with levels sitting at moderate. In Northern Ireland, the data is mixed, but activity remains low.
In England, most key indicators for Covid fell slightly this week indicating a lower risk of Covid. Positivity rates for all tests carried are falling at a national level as well as in most regions. After rising earlier than previous years, Flu test positivity in England has stabilised and is returning to a more normal seasonal pattern.
All key Covid indicators in Scotland increased slightly this week and overall are now at medium levels of activity. Flu levels are rising earlier than previous years,
This week, Covid admissions in Wales again increased and are now at moderate levels, while Flu and RSV hospitalisations remained stable and low.
In Northern Ireland, Covid indicators presented a mixed picture but activity remained low. All indicators for Flu increased but remained at low levels of activity.
Covid levels in wastewater continue to increase slowly this week across most European countries still reporting data, but overall they are still relatively low apart from France which has moderate levels.
For the week ending Oct 17, Covid activity in the USA is likely falling slowly with hospital indicators falling. While wastewater levels remaining unchanged at a moderate level, most states are still seeing low levels overall. Meanwhile, Flu activity continues to rise.
Covid levels remain low in Hong Kong and Singapore, but Flu levels are still high.
The UK's Autumn 2026 Covid Booster campaign started on Oct 1 and details of who is is eligible and how to arrange a vaccination can be found at the following links - England, Scotland, Wales, and Northern Ireland.
By week four of the campaign, vaccine coverage in England had climbed to 42% for people aged 75 and above, and 18% for those who are immunosuppressed. At present, coverage remains lower across the other home nations.
Free Flu vaccinations for those eligible are also available from Oct 1, 2026. Further details can be found at the following links - England, Scotland (invitation letter required), Wales, and Northern Ireland.
As always, it's important to remember that the risk of hospitalisation from Covid increases significantly with age and for the clinically vulnerable. Therefore, it is important to take appropriate measures such as self-isolating when experiencing Covid symptoms and enhancing ventilation or wearing masks whenever possible.
Status of main respiratory diseases in England.
UKHSA have moved to publishing the Flu and COVID-19 surveillance reports fortnightly over the summer so data is only available from the Covid Dashboard this week.
This section starts with the latest data on test positivity rates for Covid in England. It's important to note that positivity is different from prevalence, which reflects the overall percentage of Covid cases in the general population. Appendix 1 offers a more detailed explanation of the distinction.
The following chart shows the test positivity rate for all Covid tests taken mapped against the UKHSA activity thresholds. The thresholds are based on the historical trend for Covid test positivity and, consequently, represent a relative risk. More details on this approach can be found in the Guide to Covid Surveillance Metrics.
The chart shows that the test positivity rate has started to fall, but is still at a low activity level. The rate remains highest at 11.1% for those aged 85 and above, then falls to just 1.9% for individuals aged 5 to 14 years.
The next chart shows that positivity rates for all tests carried out differ between regions. While most regions experienced a fall in test positivity rates, the North East continues to rise fast. Nevertheless, all regions stayed at a low level of activity apart from London which is now has the lowest rate, just within the baseline level of activity. Rates are holding steady in the North West, East Midlands, and Yorkshire and the Humberside.
The following chart highlights the key indicators of Covid in hospitals: weekly visits to Emergency Departments, test positivity rates among patients with respiratory issues, hospital admission and intensive care rates.
This week, hospital indicators for Covid activity again showed a mixed picture but remained relatively low. While test positivity and Emergency Department visits remained broadly unchanged, hospital and intensive care admissions continued to rise slowly.
The next chart in this section compares the positivity rate for hospital patients for the main respiratory viruses. Covid positivity rates fell slightly, while Flu rates stayed the same, with both still at low activity levels. The Rhinovirus rate fell slightly but stayed at the medium activity level. Meanwhile, RSV remains at out of season levels but is starting to increase.
However, the final chart in this section shows that although Flu rates for this year started rising earlier than in previous years they are now returning to a more normal seasonal pattern.
Scotland weekly hospital admissions and test positivity
Public Health Scotland has now returned to publishing the Viral Respiratory Diseases in Scotland surveillance report weekly.
The latest edition, published on Oct 29, reported that indicators of respiratory infections are rising slowly, typical for this time in the season.
Flu activity has increased slightly this week, with laboratory confirmed cases activity level moving from baseline to low overall. This increase is reflected by a 40% increase in the number of influenza hospital admissions, which are higher than at the same period in previous seasons.
Covid activity has increased marginally across laboratory surveillance, moving from low to medium activity overall. Increased activity for Covid has also been observed at GPs for a second week. There has been a slight increase in the number of Covid hospital admissions.
The following panel chart presents the latest data for Covid levels in wastewater in blue, weekly Covid test positivity shown in red, Covid hospital admissions depicted in orange, and beds occupied by Covid patients in brown.
All key Covid indicators in Scotland increased slightly this week and overall are now at medium levels of activity. However it remains likely that this wave may be smaller than earlier ones.
The next chart in this section compares the test positivity rates for hospital patients with respiratory symptoms for Covid, Flu, and RSV. Covid positivity rates increased to 6.5% from 5.5% in the previous week, while RSV rates remained below baseline levels. Flu rates rose slightly and remain higher than for Covid.
The final chart in this section shows that hospital admissions for Flu are higher than at the same time in previous years, indicating an early start to the Flu season this year.
Wales Covid hospital admissions.
The following chart provides the latest trend for weekly hospital admissions for the main respiratory viruses in Wales up to week ending Oct 25, 2026.
Hospital admissions for Covid have increased over the past few weeks but remain at moderate levels.
The weekly Weekly Surveillance Report showed that test positivity increased to 11.6% in hospitals and GP practices for week ending Oct 25, 2026. Finally, the report confirmed that Flu circulation remains at low levels, while Respiratory Syncytial Virus (RSV) is holding steady at baseline intensity.
Status of main respiratory diseases in Northern Ireland.
Public Health Northern Ireland's respiratory surveillance report covering Covid activity has now returned to being published weekly. The latest report covers data through to the week ending Oct 25, 2026 and the chart below highlights the test positivity rates for Covid, Flu, and RSV.
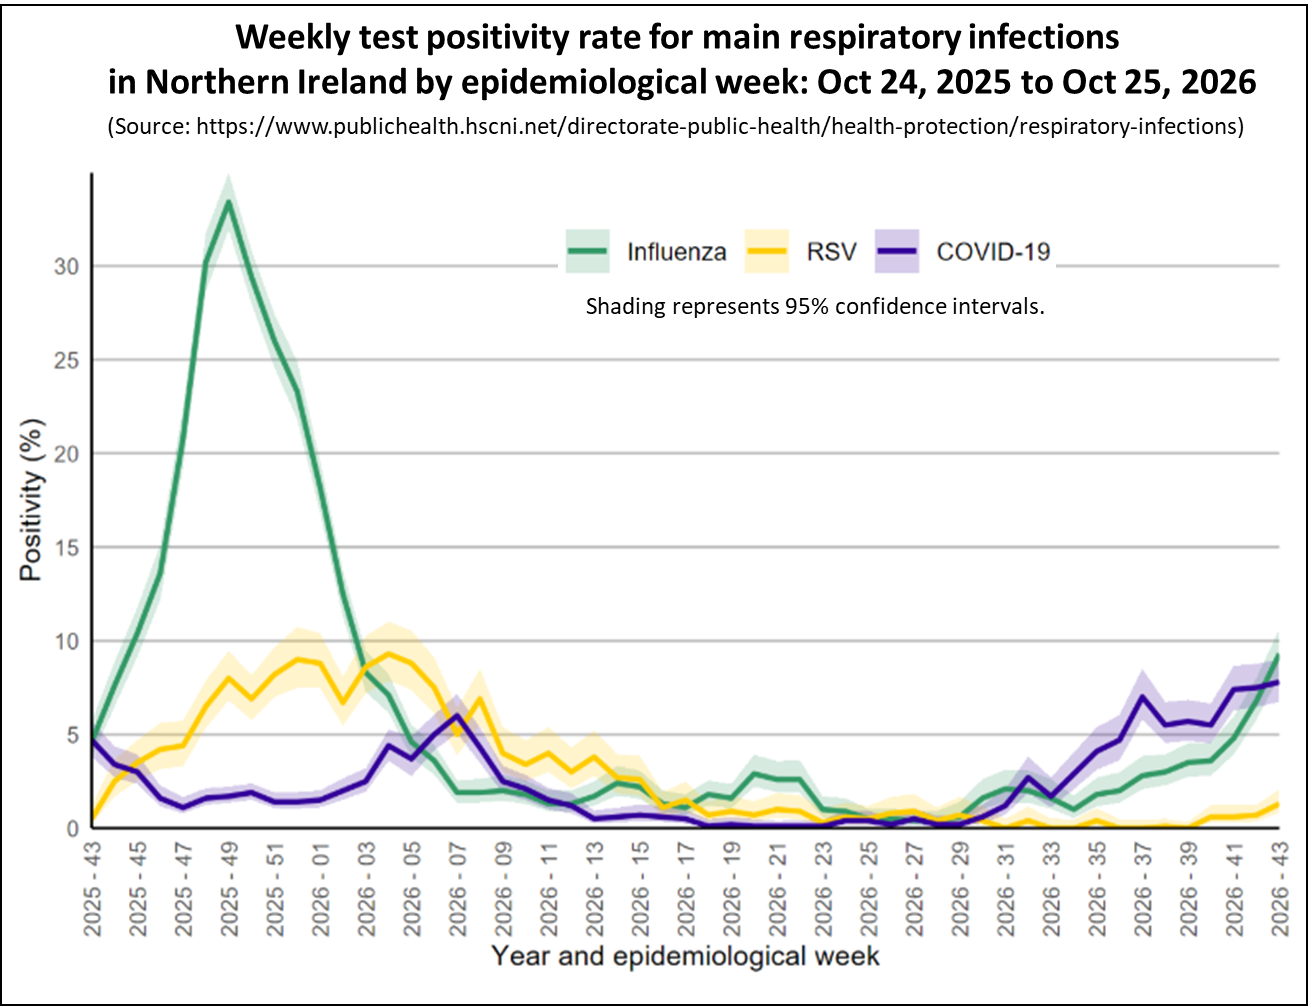
Test positivity was highest among the 5-14 age group for Flu (22.5%), the 0-4 age group for RSV (7.8%), and the 75+ age group for Covid (9.3%).
Overall, Flu activity has increased across all surveillance indicators but still remains low. Covid activity showed a more mixed trend across surveillance indicators and remains low. RSV activity also remained at baseline levels although some surveillance indicators have increased.
Covid Activity in Europe.
This section looks at the latest Covid trends in Europe and examines how wastewater patterns align with prevalence and hospital data in selected countries.
The following chart shows the latest levels of Covid up to week ending Oct 22, 2026 as measured by monitoring wastewater in a number of European countries that still publish this information.
This week, Covid levels in wastewater increased in most European countries still sharing this data but remained relatively low apart from in France which is at moderate levels.
Wastewater levels are not the only measures of Covid activity published by these countries and it is valuable to see how well the wastewater trends compare to the other key indicators.
Wastewater levels in Germany and France, when compared with hospital trends, show similar patterns. Interestingly, the Netherlands stands out as the only country in Europe that shares data on Covid prevalence in the population through a weekly survey, which also aligns closely with wastewater trends.
The two charts on the left show Germany's wastewater trends compared to their Covid hospital admissions, while the charts in the middle display France's wastewater levels against the percentage of Emergency Department visits due to Covid. The two charts on the right show waste water levels in the Netherland and the estimated prevalence of Covid in the population based on the weekly survey.
The latest data shows that Covid activity continues to rise slowly in Germany, France and the Netherlands across both sets of measures, confirming that Covid wastewater trends are a reliable indicator of Covid activity.
Covid Activity in North America.
This section provides details of Covid activity in USA and Canada.
Charts for the USA will be updated on Friday, Oct 30 to reflect the latest information.
As of the week ending Oct 17, 2026, Covid indictors of activity in the USA present a mixed picture. While hospital indicators show falling levels of activity that are low, wastewater activity levels remained at moderate levels. While the risk remains low in most states, those in the Southeast and West are showing higher levels of activity.
The following chart shows the weekly trend for the national key Covid indicators covering wastewater activity levels, percent of emergency department visits due to Covid, test positivity, and the hospital admission rate in the USA.
The panel chart shows that the hospital indicators of Covid activity have continued to fall in the week ending Oct 17, 2026, and are at relatively low levels. However, although Covid levels in wastewater were stable they remained at moderate levels although this may be due to the addition of new testing sites.
While Covid levels are likely falling, Flu activity is increasing earlier than in past years, though it remains at low levels, as illustrated in the following chart.
The next chart shows the Covid trends by state as estimated by the CDC for Oct 20, 2026. Most States are showing a declining trend, depicted in green, or no change as highlighted in grey. This week, only 10 states are showing a likely growing or growing trend, marked in orange or red, just like last week. All states have low or very low levels of Emergency Department visits for Covid.
A reminder that the trend represents the direction of activity only and does not indicate the level of activity. Consequently, this map should be used in conjunction with other data like the percent of Emergency Department visits due to Covid.
States marked with vertical bars have low percent of visits to Emergency Departments (ED) for Covid and those marked with horizontal bars have very low percent of visits. More details information is available by hovering your cursor over any State.
The final map for the USA presents wastewater analysis for week ending Oct 17, 2026 presents a contrasting picture. While Wastewater activity levels for Covid are low in many States, several are showing high or very high activity levels. For example, wastewater activity levels in Florida remain very high, whereas Emergency Department visits for Florida are low and falling.
Each State is coloured based on activity levels, ranging from very high (dark red) to very low (light green), with grey indicating no data available. States with increasing activity levels are marked with cross-hatching. It is important to understand that the wastewater activity level is relative to the lowest levels seen in the past two years. Consequently, it is not a fixed absolute scale across all years. It is primarily a measure of how current wastewater viral levels compare with recent low levels in that State.
Activity levels are low in most States but are higher in some States in the West and Southeast regions.
In Canada, data for the week ending Oct 10, 2026, shows that Covid wastewater levels stayed at moderate levels, although levels in the western provinces are higher. Flu A activity is starting to rise and is now at a moderate level.
The weekly Canadian respiratory virus surveillance report provides further details on the activity of respiratory viruses. The latest report, covering data through the week ending Oct 17, 2026, indicates that Flu activity has continued to rise earlier than normally expected. Flu test positivity has reached 6.5%, surpassing the seasonal threshold of 5%, marking the official start of the Flu season. Meanwhile, test positivity for Covid and RSV remains stable and at low activity levels.
Status of main respiratory diseases in Asia.
This section provides the latest information on Covid and Flu activity levels in Hong Kong and Singapore.
The following chart displays the key Covid indicators for Hong Kong up to the week ending Oct 24, 2026. Although Covid levels in wastewater samples increased in July, the latest hospital surveillance data shows that the overall local activity of Covid has fallen to very low levels and the recent wave is over.
However, Flu presents a very different picture and the following chart shows that the Flu levels in Hong Kong are presently very high.
The next chart presents the weekly Covid positivity rate for tests carried out on patients with respiratory symptoms in Singapore up to week ending Oct 10, 2026. It shows that Covid activity peaked in May, consistent with the previous two years, and has now fallen to low levels.
However, although Flu activity is falling in Singapore it remains moderately high, similar to Hong Kong.
Spring 2026 Covid Booster campaign.
The NHS Autumn Covid booster campaign started on October 1, 2026. People aged 75 years and older, residents in care homes for older people, and those aged 6 months and over with a weakened immune system will be offered a dose of the Covid vaccine this spring. These are same criteria used for the Spring 2026 and Autumn 2025 booster campaigns.
Full details of eligibility and the vaccines being used for the Spring campaign can be found in the UK Governments Green Book published here.
The following chart shows the number of Covid vaccinations given by week for each of the booster campaigns in England.
During the first four weeks of the Autumn 2026 campaign in England, 3,063,101 booster doses were given, providing 42% coverage for people aged 75 and older and 18% coverage for those who are immunosuppressed. This is slightly higher than the first four weeks of the Spring 2026 campaign but 497,908 fewer than the Autumn 2025 campaign, which had the same group of people eligible.
The final chart in this section shows the Autumn 2026 Covid booster coverage for each of the eligible cohorts by home nation. Coverage is generally highest in England, but coverage for the immunosuppressed group is lowest in all four home nations,
In conclusion
Although the amount of data currently being published is reduced, the information available for all home nations show that Covid activity is low in England. However, Scotland is seeing increases and is now at medium activity levels. Wales and Northern Ireland are seeing slow increases but remain relatively low.
Covid levels in wastewater are low but rising slowly across most European countries, particularly in France. In the USA, Covid activity is staring to fall and is at low levels, except in a few states.
Flu levels are starting to rise earlier than in previous years in some countries.
As always, if you have any comments on this Covid Situation Report or suggestions for topics to cover, please post a message below.
Thanks for reading Seeing The Forest for the Trees! Subscribe for free to receive new posts and support my work.
Appendix 1. Test positivity rates and prevalence
Positivity rates are derived from the results of hospital laboratory tests conducted on patients exhibiting symptoms of respiratory diseases. Test positivity is the percentage of patients who test positive for Covid of the total number of patients tested. Since the individuals tested for this measure are not a representative sample of the general population it differs from prevalence, which is derived from a representative sample of the population.
A game is not a moral exemption to your usual self. Sometimes the best way to puncture 'it's just a game' is to show people that you're judging them in reality
Read more Leading questions
My sister-in-law is nearly 40 but cannot handle losing at board games. No matter how high or low the stakes, she has to win. When she doesn't, she becomes explosive with rage, and often upends the game, sweeps dice off the table, or storms off in a rage. She is otherwise a normal and lovely person, with whom I get on very well. Seeing this side of her makes me deeply uncomfortable and it feels really childish and inappropriate. Will she behave that way with me if I say or do something she doesn't like?
I think in an effort to smooth the tension, my husband's family always laughs and teases her about her reaction. It's like her "special little characteristic" that everyone pretends to love. I wish there was a way to address it but everyone seems to just sweep it under the rug. My husband is aware of how I feel about this.
Continue reading...It involves the fracturing of a patient's ribs, before they spend three months laced into a corset. Some of those who have had this cosmetic procedure say it is like being 'hit by a bus'. Why is it becoming more popular?
Daniela Cesin was 14 when she began thinking about her looks. "I was a little bit chubby and I started to work out at home and lose weight. I saw the difference in my body: my abs, the muscles in my arms, and I started liking it," she says. By 31, she had the slim, toned body she had hoped for, but something was still missing. "I wanted to have that guitar hourglass shape."
In August, Cesin travelled from Miami, where she has lived for the past 15 years, to her native Venezuela for liposuction and a fat transfer to her hips. She met her cosmetic surgeon for the first time the day before the procedure, and he realised she didn't have enough fat to go ahead with it. Instead, he offered to perform RibXcar: a rib remodelling surgery that would involve fracturing three of her lower ribs on each side and binding them in a corset for three months, to set the ribs in a new position and give her a wasplike waist.
Continue reading...No matter what the cause, airports are ruthless in issuing PCNs if a car stops in a red zone. But there is a get-out clause
I had to stop my car for 18 seconds in a red zone at Leeds Bradford airport to deal with a wasp. It was buzzing in front of my face and making safe-driving impossible.
The result was a £100 parking charge notice (PCN) sent to my wife (the registered keeper) by Vehicle Control Services (VCS).
Continue reading...Your feelings are understandable. Exploring and accepting them may help you move on
I was with my ex-partner for more than 20 years. We were mostly happy and I expected us to be together for life. For well over half the relationship, I was the sole breadwinner and, at my ex's request, managed our finances. We were reasonably well off, with savings and without a mortgage. We even had a holiday home, albeit a static caravan.
I retired early, and the problems we had in our relationship grew. We had both loved travel, but I was repeatedly told we couldn't afford it, which I knew was nonsense. I went back to work in a demanding new field, but my ex showed no interest. I spent more time away from home and began therapy (my suggestion of couples' therapy was rejected). After a year of therapy, I said I was leaving.
Continue reading...
This report belongs to a weekly series summarising the Covid situation across the UK's home nations and other countries.
Thanks for reading Seeing The Forest for the Trees! Subscribe for free to receive new posts and support my work.
This week's report highlights the latest trends in respiratory illness activity across England, Scotland, Wales, and Northern Ireland. It also shares provides details on recent Covid activity for selected countries in Europe, North America, and Asia.
Charts for the USA will be updated on Friday, Oct 23 to reflect the latest published data.
Summary.
This week, Covid trends in the UK again present a mixed picture. In England, all Covid indicators fell slightly, indicating that the risk remains low and is likely not increasing. In Scotland, Covid indicators fell slightly and activity may have plateaued. Data from Wales and Northern Ireland shows Covid levels are likely rising slowly but remain moderately low.
In England, most key indicators for Covid fell slightly this week indicating a low risk of Covid. Positivity rates for all tests carried out have stopped rising and are now falling in some regions that previously had the highest rates. After rising earlier than previous years, Flu test positivity in England has stabilised and is returning to a more normal seasonal pattern.
This week, Covid activity indicators in Scotland fell slightly and remain relatively low overall. Flu activity, which had started rising earlier than usual, has now settled back into normal seasonal patterns and is at baseline levels.
This week, Covid admissions in Wales increased and are now at moderate levels, while Flu and RSV hospitalisations remained stable and low.
In Northern Ireland, all surveillance indicators for Flu increased but remained at low levels of activity. Covid indicators presented a mixed picture but activity remained low.
Covid levels in wastewater increased slowly this week across most European countries still reporting data, but overall they are still relatively low apart from France which has moderate levels.
For the week ending Oct 10, Covid activity in the USA presents a mixed picture, with hospital indicators falling and wastewater levels rising slightly. However, most states are still seeing low levels overall. Meanwhile, Flu activity is starting to rise.
Covid levels remain low in Hong Kong but Flu levels are still high. In New Zealand, both Covid and Flu levels are low.
The UK's Autumn 2026 Covid Booster campaign started on Oct 1 and details of who is is eligible and how to arrange a vaccination can be found at the following links - England, Scotland, Wales, and Northern Ireland.
By the third week of the campaign in England, vaccine coverage had reached 34% for people aged 75 and older, and 15% for those who are immunosuppressed.
Free Flu vaccinations for those eligible are also available from Oct 1, 2026. Further details can be found at the following links - England, Scotland (invitation letter required), Wales, and Northern Ireland.
As always, it's important to remember that the risk of hospitalisation from Covid increases significantly with age and for the clinically vulnerable. Therefore, it is important to take appropriate measures such as self-isolating when experiencing Covid symptoms and enhancing ventilation or wearing masks whenever possible.
Status of main respiratory diseases in England.
UKHSA have moved to publishing the Flu and COVID-19 surveillance reports fortnightly over the summer so data is only available from the Covid Dashboard this week.
This section starts with the latest data on test positivity rates for Covid in England. It's important to note that positivity is different from prevalence, which reflects the overall percentage of Covid cases in the general population. Appendix 1 offers a more detailed explanation of the distinction.
The following chart shows the test positivity rate for all Covid tests taken mapped against the UKHSA activity thresholds. The thresholds are based on the historical trend for Covid test positivity and, consequently, represent a relative risk. More details on this approach can be found in the Guide to Covid Surveillance Metrics.
The chart shows that the test positivity rate has plateaued and remains at a low activity level. The rate remains highest at 13.4% for those aged 85 and above, then falls to just 2.8% for individuals aged 5 to 14 years.
The next chart shows that positivity rates for all tests carried out differ between regions. While many regions experienced increases in test positivity rates, some saw slight falls. Nevertheless, all regions stayed at a low level of activity. Rates are climbing fastest in the North West, which now holds the second highest rate . In contrast, London, West Midlands and the South West rates are starting to fall. Rates remain lowest in the South West.
The following chart highlights the key indicators of Covid in hospitals: weekly visits to Emergency Departments, test positivity rates among patients with respiratory issues, hospital admission and intensive care rates.
This week, hospital indicators for Covid activity again showed a mixed picture but remained relatively low. While test positivity and intensive care admissions are now falling, hospital admissions and Emergency Department visits continued to rise slowly.
The next chart in this section compares the positivity rate for hospital patients for the main respiratory viruses. Covid positivity rates fell slightly, while Flu rates stayed the same, with both still at low activity levels.The Rhinovirus rate fell slightly but stayed at the medium activity level. Meanwhile, RSV remains at out of season levels.
However, the final chart in this section shows that although Flu rates for this year started rising earlier than in previous years they are now returning to a more normal seasonal pattern.
Scotland weekly hospital admissions and test positivity
Public Health Scotland has now returned to publishing the Viral Respiratory Diseases in Scotland surveillance report weekly.
The latest edition, published on Oct 22, reported that indicators of respiratory infections remain at baseline activity, typical for this time in the season.
Flu activity has stayed stable and at baseline levels across systems this week. However, a slight pre-season rise has pushed numbers just above the usual for this time of year. The highest activity and admissions are seen in adults aged 65 and older.
Covid activity has been stable through laboratory surveillance, remaining at low activity for the fifth consecutive week. Activity was highest in adults aged between 45-74 years. However, increases were observed in both primary care test positivity and in hospital admission data.
The following panel chart presents the latest data for Covid levels in wastewater in blue, weekly Covid test positivity shown in red, Covid hospital admissions depicted in orange, and beds occupied by Covid patients in brown.
All key Covid indicators in Scotland fell slightly this week and remain relatively low compared to previous waves, indicating that this wave may be smaller than earlier ones.
The final chart in this section compares the test positivity rates for hospital patients with respiratory symptoms for Covid, Flu, and RSV. Covid positivity rates broadly stable at 5.5%, while RSV rates remained below baseline levels. Flu rates rose slightly and are now higher than for Covid.
Wales Covid hospital admissions.
The following chart provides the latest trend for weekly hospital admissions for the main respiratory viruses in Wales up to week ending Oct 18, 2026.
Hospital admissions for Covid have increased over the past few weeks and are now at moderate levels.
The weekly Weekly Surveillance Report showed that test positivity remained stable at 6.3% in hospitals and GP practices for week ending Oct 11, 2026. However, consultations with GPs for Covid had increased in recent weeks.
Finally, the report confirmed that Flu circulation remains at low levels, while Respiratory Syncytial Virus (RSV) is holding steady at baseline intensity.
Status of main respiratory diseases in Northern Ireland.
Public Health Northern Ireland's respiratory surveillance report covering Covid activity has now returned to being published weekly. The latest report covers data through to the week ending Oct 18, 2026 and the chart below highlights the test positivity rates for Covid, Flu, and RSV.
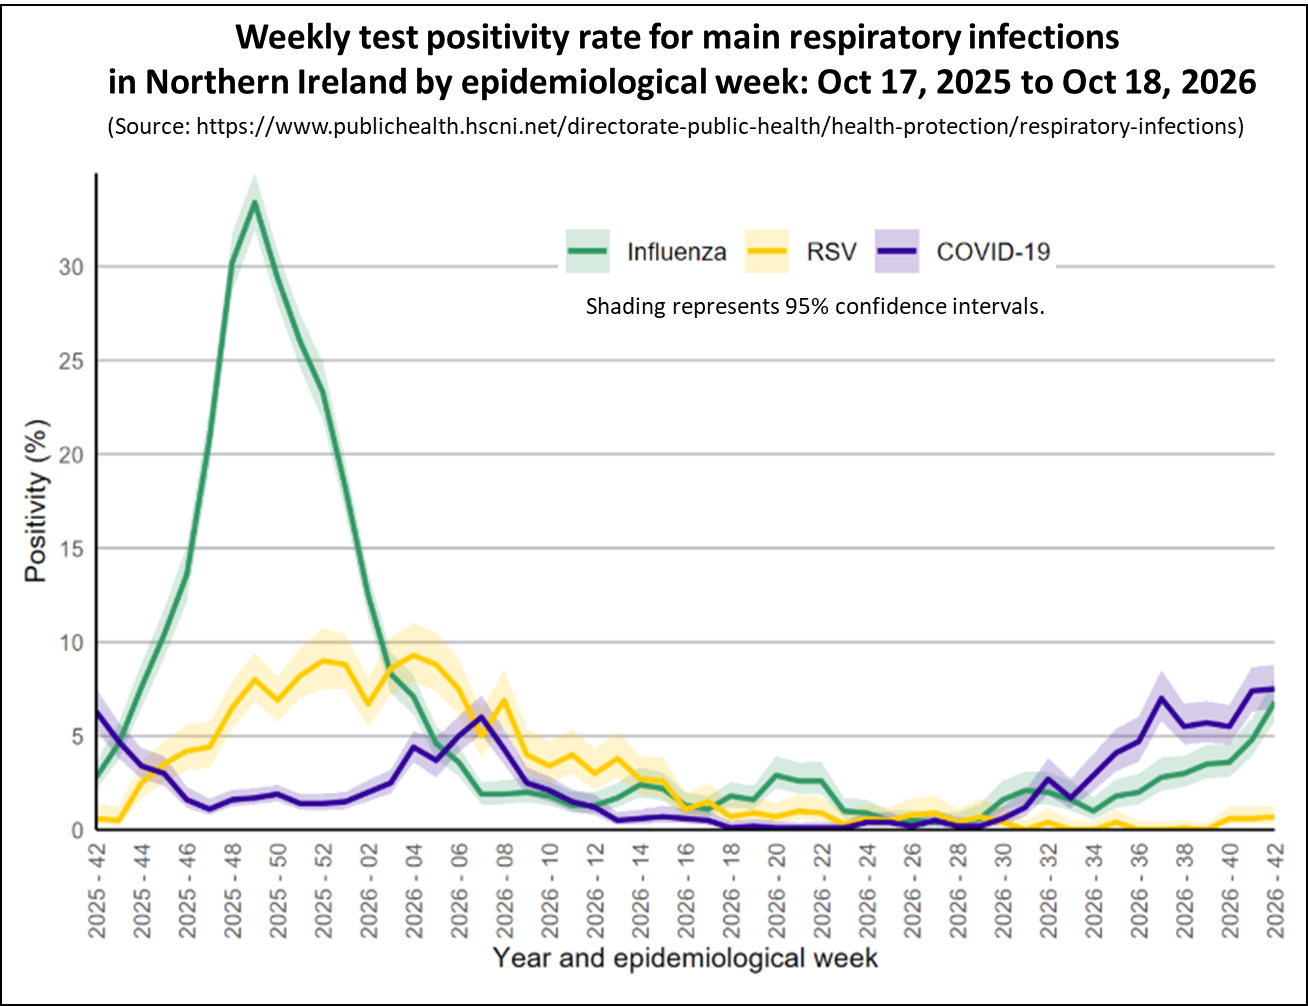
Test positivity was highest among the 5-14 age group for Flu (17.0%), the 0-4 age group for RSV (3.5%), and the 75+ age group for Covid (10.4%).
Influenza activity has increased across the majority of surveillance indicators.
RSV activity remained low and stable across surveillance indicators.
COVID-19 activity showed mixed trends across surveillance indicators.
Overall, Flu activity has increased across the majority of surveillance indicators but still remains low. Covid activity showed a more mixed trend across surveillance indicators and remains low. RSV activity also remained low and is stable across all surveillance indicators.
Covid Activity in Europe.
This section looks at the latest Covid trends in Europe and examines how wastewater patterns align with prevalence and hospital data in selected countries.
The following chart shows the latest levels of Covid up to week ending Oct 15, 2026 as measured by monitoring wastewater in a number of European countries that still publish this information.
This week, Covid levels in wastewater increased in most European countries still sharing this data but remained relatively low apart from in France which appears which is at moderate levels.
Wastewater levels are not the only measures of Covid activity published by these countries and it is valuable to see how well the wastewater trends compare to the other key indicators.
Comparing wastewater levels in Germany and France alongside hospital trends reveals similar patterns. The two charts on the left show Germany's wastewater trends compared to their Covid hospital admissions, while the charts on the right display France's wastewater levels against the percentage of Emergency Department visits due to Covid.
The latest data shows that Covid activity continues to rise slowly in both Germany and France.
In summary, Covid wastewater trends are a reliable indicator of Covid activity in both the community and hospital settings.
Covid Activity in North America.
This section provides details of Covid activity in USA and Canada.
Charts for the USA were updated on Friday, Oct 16 to reflect the latest information.
As of the week ending Oct 10, 2026, Covid indictors of activity in the USA present a mixed picture. While hospital indicators show falling levels of activity, wastewater activity levels increased slightly. While the risk remains low in most states, those in the Southeast and West are showing higher levels of activity.
The following chart shows the weekly trend for the national key Covid indicators covering wastewater activity levels, percent of emergency department visits due to Covid, test positivity, and the hospital admission rate in the USA.
The panel chart shows that the hospital indicators of Covid activity have continued to fall in the week ending Oct 10, 2026, and for most measures are at low levels although test positivity remained moderately high. However, Covid levels in wastewater increased slightly and are now at moderate levels although this may be due to the addition of new testing sites.
While Covid levels are most likely falling, Flu activity is continuing to rise, though still starting from low levels as shown in the following chart.
The next chart shows the Covid trends by state as estimated by the CDC for Oct 13, 2026. Most States are showing a declining trend, depicted in green, or no change as highlighted in grey. This week there are just 10 states showing a likely growing trend, highlighted in orange, compared to 11 in the previous week.
A reminder that the trend represents the direction of activity only and does not indicate the level of activity. Consequently, this map should be used in conjunction with other data like the percent of Emergency Department visits due to Covid.
States marked with vertical bars have low percent of visits to Emergency Departments (ED) for Covid and those marked with horizontal bars have very low percent of visits. More details information is available by hovering your cursor over any State.
The final map for the USA presents wastewater analysis for week ending Oct 10, 2026 presents a contrasting picture. While Wastewater activity levels for Covid are low in many States, several are showing high or very high activity levels. For example, wastewater activity levels in Florida are very high, whereas Emergency Department visits for Florida are low and falling.
Each State is coloured based on activity levels, ranging from very high (dark red) to very low (light green), with grey indicating no data available. States with increasing activity levels are marked with cross-hatching. It is important to understand that the wastewater activity level is relative to the lowest levels seen in the past two years. Consequently, it is not a fixed absolute scale across all years. It is primarily a measure of how current wastewater viral levels compare with recent low levels in that State.
Activity levels are low in most States but are higher in some States in the West and Southeast regions.
In Canada, data for the week ending Oct 10, 2026, shows that Covid wastewater levels stayed at moderate levels, although levels in the western provinces are higher. Flu A activity is starting to rise and is now at a moderate level.
The weekly Canadian respiratory virus surveillance report provides further details on the activity of respiratory viruses. The latest report, covering data through the week ending Oct 10, 2026, indicates that Flu activity has been steadily rising in recent weeks and has surpassed the seasonal threshold of 5% test positivity. If test positivity remains above this threshold next week, the start of the Flu season will be declared. Meanwhile, test positivity for Covid and RSV remains stable and at low activity levels.
Status of main respiratory diseases in Asia and Oceania.
This section provides the latest information on Covid and Flu activity levels in Hong Kong and New Zealand. Unfortunately, there was no update from Singapore published this week.
The following chart displays the key Covid indicators for Hong Kong up to the week ending Oct 17, 2026. Although Covid levels in wastewater samples increased in July, the latest hospital surveillance data shows that the overall local activity of Covid has fallen to very low levels and the recent wave is over.
However, Flu presents a very different picture and the following chart shows that the Flu levels in Hong Kong are presently very high.
Meanwhile New Zealand shows a different picture as Covid activity has remained very low for several months and did not have the peaks seen in Hong Kong,
However, there was a severe flu season that peaked at the end of August but has since declined to low activity, similar to the same period last year.
Spring 2026 Covid Booster campaign.
The NHS Autumn Covid booster campaign started on October 1, 2026. People aged 75 years and older, residents in care homes for older people, and those aged 6 months and over with a weakened immune system will be offered a dose of the Covid vaccine this spring. These are same criteria used for the Spring 2026 and Autumn 2025 booster campaigns.
Full details of eligibility and the vaccines being used for the Spring campaign can be found in the UK Governments Green Book published here.
The following chart shows the number of Covid vaccinations given by week for each of the booster campaigns in England.
During the first three weeks of the Autumn 2026 campaign in England, 2,453,170 booster doses were given, providing 34% coverage for people aged 75 and older and 15% coverage for those who are immunosuppressed. This is slightly lower than the first three weeks of the Spring 2026 campaign and 588,760 fewer than the Autumn 2025 campaign, which had the same group of people eligible.
In conclusion
Although the amount of data currently being published is reduced, the information available for all home nations show that Covid activity is low but rising slowly in England. However, Scotland presented a mixed picture and may have peaked. Flu levels are starting to rise earlier than in previous years.
Covid levels in wastewater is also low but rising across European countries. In the USA, Covid activity is staring to fall and is at low levels, except in a few states. Flu A activity in both the USA and Canada is staring to rise.
As always, if you have any comments on this Covid Situation Report or suggestions for topics to cover, please post a message below.
Thanks for reading Seeing The Forest for the Trees! Subscribe for free to receive new posts and support my work.
Appendix 1. Test positivity rates and prevalence
Positivity rates are derived from the results of hospital laboratory tests conducted on patients exhibiting symptoms of respiratory diseases. Test positivity is the percentage of patients who test positive for Covid of the total number of patients tested. Since the individuals tested for this measure are not a representative sample of the general population it differs from prevalence, which is derived from a representative sample of the population.
Your friends may have had good intentions when making this ask, writes advice columnist Eleanor Gordon-Smith. But that needn't dictate how you feel about it
Read more Leading questions
A friend, who I believe is financially comfortable, set up a GoFundMe page to pay for vet bills for their sick dog while on holiday overseas.
The family appears to be financially comfortable; both adults have good jobs, own two cars, have all the latest gadgets like expensive bikes and sporting equipment, take an annual holiday overseas and domestic holidays throughout the year, and live in a big house in a well-to-do area.
Continue reading...Reunions can be riotous, scandalous or just plain awkward. Experts and attendees share how to go in prepared
Mike walked into his 20th high school reunion with a mission. The 40-year-old firefighter from Melbourne was not the first, nor will he be the last, to enter such a space with an agenda. After all, few social situations are as fraught as high school reunions.
Some may relish the chance to reconnect with former friends, a former life and even a former self, but for many they are a potential hellscape, where adolescent humiliations are revived in front of a group of rapidly ageing peers.
Continue reading...An estimated one-third of adults in England have high blood pressure, with research showing that many are unaware of their condition. But thanks to the new Huawei Watch D3, monitoring blood pressure is easier, accurate and more stylish than ever
Wearable technology has come a long way in the past decade. Take a look around at your colleagues, friends and family, and you'll be hard pushed to find anyone not wearing some kind of health monitoring ring, watch or band - there are even tracking insoles and patches, too.
These gadgets have myriad benefits - not least, allowing us more control and insight over our health and wellbeing than ever before. We're able to monitor everything from sleep and stress to heart health and more, and the technology is becoming more refined and intuitive seemingly by the day.
Continue reading...Wellness culture can be overwhelming, but a more fluid approach is emerging. Smart devices such as the Huawei Watch Fit 5 perfectly embody this shift in direction - whether you're regularly sleep tracking or just occasionally using data to support your lifestyle
When it comes to the world of health and wellness, it's easy to suffer from information overwhelm. We've never had more access to data, research and expertise which, while valuable, isn't always applicable to our own lives. What's more, few of us have time to spend hours sifting through content to devise a personalised health routine, let alone work out if a "routine" is necessary at all.
All this information and expectation can come at a cost: emotional strain, guilt and confusion about where to turn. Health and fitness then start to feel like abstract milestones that we're blindly chasing rather than important components of our lives.
Continue reading...For millennia, humans have been captivated by ear decorations. Now, earbuds not only connect us to the digital world, they also showcase our personal sense of style - and the HUAWEI FreeClip 2 is at the forefront of that development
When we are born, a cry can let the world know that we are healthy and OK. When we first begin to talk, we learn to express our needs and understand the needs of others. As we grow older, we learn that the sound of a siren denotes danger, that certain notes swelling together create the sound of a favourite song which lifts our spirits, or that a warm familiar voice on the other end of the phone means our best friend has our back.
Our ears give us grounding and clues: they are our maps of the world, guiding us towards truth, keeping us from harm, giving us a constant stream of sensory information.
Continue reading...The fitness benchmark has surprisingly unscientific origins - yet it does contain more than a kernel of truth
The idea that we need to walk 10,000 steps a day originated not in medical research but in a 1960s marketing campaign for a pedometer, says Jack McNamara, senior lecturer in clinical exercise physiology at the University of East London. The round number was easy to remember and the idea caught on, despite there being no scientific evidence for 10,000 steps as a specific threshold for health.
"When the research community looked into it, they found that there were health benefits, so it didn't necessarily get thrown out as pseudoscience," says McNamara.
Continue reading...Some yogis welcome the idea of competition - for others, it is anathema. Will those keen for yoga to become an Olympic sport win the argument?
Vaishnavi Saravanakumar describes herself on Instagram as "India's rubber band girl". In a typical video post, dressed in a rhinestone-studded crimson catsuit and accompanied by a Bollywood-rap anthem, she demonstrates an improbable feat. From standing, she snakes into a deep back bend, curls her head and shoulders up under her tiger-striped calves, and finishes beaming to camera with ankles crossed under her chin. This is yoga as we have seldom seen it before.
Earlier this year, the Indian government announced that it will push for yogasana's inclusion in the Olympics, ahead of the country's bid to host the 2036 Games. The news came the week before the inaugural World Yogasana Championship, held in Ahmedabad in June, at which Saravanakumar, a gold medallist, was one of 522 yogis competing.
Continue reading...From doing too much cardio to wasting time - PTs reveal the common fails stunting your progress, and how to avoid them
We've all done it. Launched ourselves head first into a new regime - perhaps as the result of a new year resolution, recent breakup or aggressively unflattering photo. "You go all in and train five days a week," says Elizabeth Davies, personal trainer and author of Training for Your Old Lady Body. "Then life happens. You miss a few sessions, then stop completely. You feel deflated that you couldn't stick to it. Then some time later, motivation strikes again and the cycle repeats itself."
Continue reading...Only you can know when you are ready, but a year is not long to process grief, and you seem to have doubts about this man
My longterm boyfriend died of cancer last year. We'd been together for 16 years, since I was 21 and he was 23. I had given birth to our only child three weeks before his diagnosis. My son was just shy of 10 months old when his dad died, and he's now turned two.
I loved my late partner deeply and had planned to stay with him for ever. We were embarking on an 18-year project together, raising our son. Now I think, how can I ever be happy again?
Continue reading...Not having the right kind when picking up a vehicle can leave travellers scrambling to find alternative transport
If your children are on half-term holiday soon and you are planning to collect a hire car, make sure you have the right kind of credit card. These cautionary tales show the costly consequences if yours does not pass muster.
I hired a car for a family holiday from Enterprise Rent-A-Car in France. The collection desk at Carcassonne airport refused to hand over the keys when I presented the Visa credit card used for the booking because it was issued by First Direct. It told me it did not accept cards from online banks.
Continue reading...
This report belongs to a weekly series summarising the Covid situation across the UK's home nations and other countries.
Thanks for reading Seeing The Forest for the Trees! Subscribe for free to receive new posts and support my work.
This week's report highlights the latest trends in respiratory illness activity across England, Scotland, Wales, and Northern Ireland. It also shares provides details on recent Covid activity for selected countries in Europe, North America, and Asia.
Charts for the USA will be updated on Friday, Oct 16 to reflect the latest published data.
Summary.
This week, Covid trends in the UK present a mixed picture. In England, some Covid indicators have risen again, though from low levels, indicating that while the risk remains low, it may be increasing. In Scotland Covid indicators are going in different directions, but Covid levels may have peaked. Data from Wales and Northern Ireland shows Covid levels are stable and remain moderately low.
In England, key hospital indicators for Covid showed a mixed picture this week indicating a low risk of Covid. Positivity rates for all tests carried out have stopped rising and are now falling in some regions that previously had the highest rates. While Flu activity is still low it is rising earlier than previous years.
This week, Covid activity indicators in Scotland again showed a mixed picture but remain relatively low overall. Flu activity, which had started rising earlier than usual, has now settled back into normal seasonal patterns and is at baseline levels.
This week, Covid admissions in Wales remained stable and at moderately low levels ,while Flu and RSV hospitalisations remained stable and low.
In Northern Ireland, all surveillance indicators for Covid and Flu increased slowly but remained at low levels of activity.
Covid levels in wastewater increased slowly this week across most European countries still reporting data, but overall they are still relatively low apart from France which has moderate levels.
For the week ending Oct 3, Covid activity in the USA has continued to fall slowly , with most States now experiencing low levels. Meanwhile Flu activity is starting to rise.
Covid levels remain low in Hong Kong and Singapore, but Flu levels are high.
The UK's Autumn 2026 Covid Booster campaign started on Oct 1 and details of who is is eligible and how to arrange a vaccination can be found at the following links - England, Scotland, Wales, and Northern Ireland.
In the second week of the campaign in England vaccine coverage reached 23% for people aged 75 and over, and 10% for those who are immunosuppressed.
Free Flu vaccinations for those eligible are also available from Oct 1, 2026. Further details can be found at the following links - England, Scotland (invitation letter required), Wales, and Northern Ireland.
As always, it's important to remember that the risk of hospitalisation from Covid increases significantly with age and for the clinically vulnerable. Therefore, it is important to take appropriate measures such as self-isolating when experiencing Covid symptoms and enhancing ventilation or wearing masks whenever possible.
Status of main respiratory diseases in England.
UKHSA have moved to publishing the Flu and COVID-19 surveillance reports fortnightly over the summer so data is only available from the Covid Dashboard this week.
This section starts with the latest data on test positivity rates for Covid in England. It's important to note that positivity is different from prevalence, which reflects the overall percentage of Covid cases in the general population. Appendix 1 offers a more detailed explanation of the distinction.
The following chart shows the test positivity rate for all Covid tests taken mapped against the UKHSA activity thresholds. The thresholds are based on the historical trend for Covid test positivity and, consequently, represent a relative risk. More details on this approach can be found in the Guide to Covid Surveillance Metrics.
The chart shows that the test positivity rate has stopped rising this week and remains at a low activity level. The rate remains highest at 13.5% for those aged 85 and above, then falls to just 1.0% for individuals aged 5 to 14 years.
The next chart shows that positivity rates for all tests carried out differ between regions. While many regions experienced increases in test positivity rates, some saw slight falls. Nevertheless, all regions stayed at a low level of activity. Rates are climbing fastest in the East of England, which now holds the highest rate and is nearing medium activity levels. In contrast, London, West Midlands and Yorkshire & Humberside rates are starting to fall. Meanwhile rates are lowest in the South West and East Midlands.
The following chart highlights the key indicators of Covid in hospitals: weekly visits to Emergency Departments, test positivity rates among patients with respiratory issues, hospital admission and intensive care rates.
This week, hospital indicators for Covid activity showed a mixed picture but remained relatively low. While test positivity and hospital admissions continued to rise slowly, Emergency Department visits and intensive care admissions stayed steady.
The next chart in this section compares the positivity rate for hospital patients for the main respiratory viruses, with Covid and Flu positivity rates remain at low activity levels even with slight increases. The Rhinovirus rate is also rising and is at medium activity level. Meanwhile, RSV remains at out of season levels.
However, the final chart in this section shows that Flu rates for this year have started rising earlier than in previous years indicating an early start to this years Flu season.
Scotland weekly hospital admissions and test positivity
Public Health Scotland has now returned to publishing the Viral Respiratory Diseases in Scotland surveillance report weekly.
The latest edition, published on Oct 15, reported that indicators of respiratory infections remain at baseline activity, typical for this time in the season.
Following an earlier than expected rise in Flu last week, laboratory surveillance has seen falls in test positivity and incidence rates this week. Activity levels among laboratory confirmed cases remained low in adults aged 65-74 years but was baseline for all other ages. Hospital admissions for any Flu have also decreased. Adults 65 years and older represent more than half of admissions, as is typical.
The following panel chart presents the latest data for Covid levels in wastewater in blue, weekly Covid test positivity shown in red, Covid hospital admissions depicted in orange, and beds occupied by Covid patients in brown.
Although wastewater increased slightly this week, hospital admissions and test positivity fell fell a little, presenting a mixed picture. However, all indicators remained relatively low compared to previous waves, suggesting that this will be smaller than earlier ones.
The final chart in this section compares the test positivity rates for hospital patients with respiratory symptoms for Covid, Flu, and RSV. Covid positivity rates stayed at 5.6%, while RSV rates remained stable and below baseline levels. Flu rates fell slightly and are no longer increasing earlier than in previous years.
Wales Covid hospital admissions.
The following chart provides the latest trend for weekly hospital admissions for the main respiratory viruses in Wales up to week ending Oct 11, 2026.
Hospital admissions for Covid have increased over the past few weeks, but appear to have stabilised this week.
The weekly Weekly Surveillance Report covering data up to for Oct 4, 2024 confirms that although overall Covid admissions fell slightly, Covid activity in the community increased by a small amount.
Finally, the infection report confirmed that Flu circulation remains at low levels, while Respiratory Syncytial Virus (RSV) is holding steady at baseline intensity.
Status of main respiratory diseases in Northern Ireland.
Public Health Northern Ireland's respiratory surveillance report covering Covid activity has now returned to being published weekly. The latest report covers data through to the week ending Oct 11, 2026 and the chart below highlights the test positivity rates for Covid, Flu, and RSV.
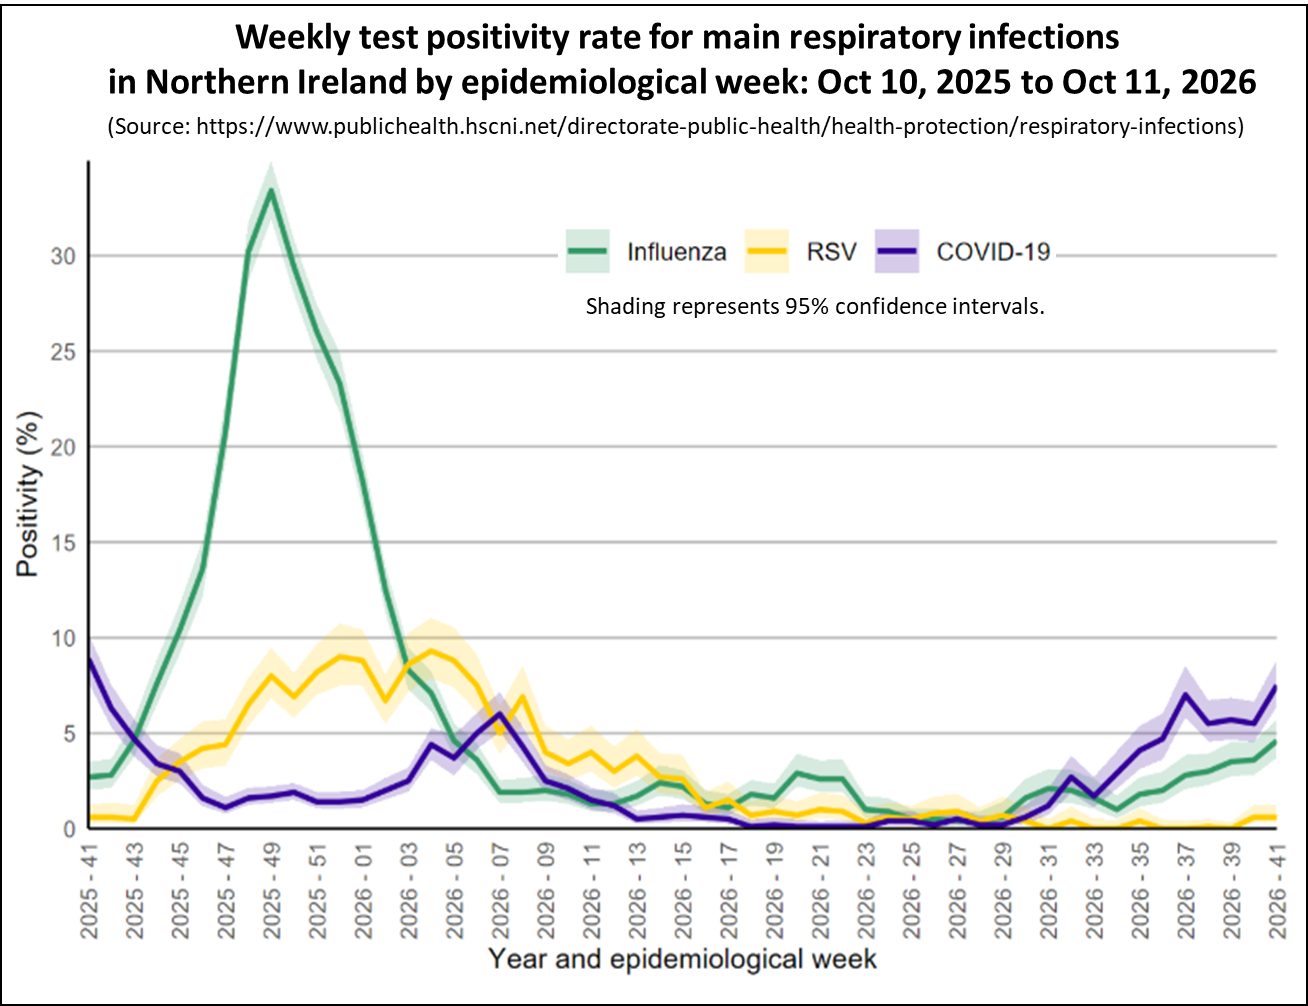
Covid and Flu activity has increased across most surveillance indicators but remains low. RSV activity remained low and stable across surveillance indicators.
Covid Activity in Europe.
This section looks at the latest Covid trends in Europe and examines how wastewater patterns align with prevalence and hospital data in selected countries.
The following chart shows the latest levels of Covid up to week ending Oct 8, 2026 as measured by monitoring wastewater in a number of European countries that still publish this information.
This week, Covid levels in wastewater increased in most European countries still sharing this data but remained relatively low apart from in France which appears to have now peaked at moderate levels.
Wastewater levels are not the only measures of Covid activity published by these countries and it is valuable to see how well the wastewater trends compare to the other key indicators.
The Netherlands is the only country in Europe still publishing prevalence data. Estimates of the percentage of the population with Covid are based on a weekly survey of volunteers. Since this isn't a random survey, statistical adjustments are made to reflect the demographics of the Netherlands.
The following chart displays the latest Covid wastewater trend in orange, the estimated prevalence in red, and the percentage of detections from laboratory surveillance in green, all for the Netherlands.
The chart shows how closely the trend for Covid wastewater follows the trend for prevalence and the percent of Covid detected in laboratory surveillance. All of these indicators of Covid activity in the Netherlands again increased slowly this week, but remain historically low.
Comparing wastewater levels in Germany and France alongside hospital trends reveals a similar pattern. The two charts on the left show Germany's wastewater trends compared to their Covid hospital admissions, while the charts on the right display France's wastewater levels against the percentage of Emergency Department visits due to Covid.
The latest data shows that Covid activity continues to rise slowly in Germany. While in France Covid levels in wastewater appear to have peaked, although visits to Emergency Departments continue to rise slowly.
In summary, Covid wastewater trends are a reliable indicator of Covid activity in both the community and hospital settings.
Covid Activity in North America.
This section provides details of Covid activity in USA and Canada.
Charts for the USA will be updated on Friday, Oct 16 to reflect the latest information.
As of the week ending Oct 3, 2026, Covid activity in the USA is staring to fall, indicating that the risk remains low in most states, and those states in the South and West which previously had higher levels of activity are starting to see falling levels.
The following chart shows the weekly trend for the national key Covid indicators covering wastewater activity levels, percent of emergency department visits due to Covid, test positivity, and the hospital admission rate in the USA.
The panel chart shows that the hospital indicators of Covid activity have continued to fall in the week ending Oct 3, 2026, and for most measures are at low levels although test positivity remained moderately high. Although Covid levels in wastewater are unchanged, this may be due to the addition of new testing sites.
While Covid levels are falling, Flu activity is beginning to increase, though still starting from low levels as shown in the following chart.
The next chart shows the Covid trends by state as estimated by the CDC for Oct 6, 2026. Most States are showing a declining trend or no change. This week there are just 11 states showing a growing trend compared to 19 in the previous week.
A reminder that the trend represents the direction of activity only and does not indicate the level of activity. Consequently, this map should be used in conjunction with other data like the percent of Emergency Department visits due to Covid. This information is available by hovering your cursor over any State even if the trend is not estimated.
The final map for the USA presents wastewater analysis for week ending Oct 3, 2026 and shows that Covid levels are low in many States as illustrated in the following map.
Each State is coloured based on activity levels, ranging from very high (dark red) to very low (light green), with grey indicating no data available. States with increasing activity levels are marked with cross-hatching. It is important to understand that the wastewater activity level is relative to the lowest levels seen in the past two years. Consequently, it is not a fixed absolute scale across all years. It is primarily a measure of how current wastewater viral levels compare with recent low levels in that State.
Activity is at a moderate level in States in the West regions. However, Florida wastewater activity levels has risen to very high this week, even though the estimated trend shown in the previous map indicates that activity levels based on other measures are falling.
In Canada, data for the week ending Oct 3, 2026, shows that Covid wastewater levels stayed at moderate levels, although levels in the western provinces are higher. Flu A activity is starting to rise and is now at a moderate level.
Status of main respiratory diseases in Asia.
This section provides the latest information on Covid and Flu activity levels in Hong Kong and Singapore.
The following chart displays the key Covid indicators for Hong Kong up to the week ending Oct 10, 2026. Although Covid levels in wastewater samples increased in July, the latest hospital surveillance data shows that the overall local activity of Covid has fallen to very low levels and the recent wave is over.
However, Flu presents a very different picture and the following chart shows that the Flu levels in Hong Kong is presently very high.
The final chart in this section presents the weekly Covid positivity rate for tests carried out on patients with respiratory symptoms in Singapore up to week ending Sep 26, 2026. It shows that Covid activity peaked in May, consistent with the previous two years, and has now fallen to low levels.
However, Flu activity is high in Singapore, similar to Hong Kong.
Spring 2026 Covid Booster campaign.
The NHS Autumn Covid booster campaign started on October 1, 2026. People aged 75 years and older, residents in care homes for older people, and those aged 6 months and over with a weakened immune system will be offered a dose of the Covid vaccine this spring. These are same criteria used for the Spring 2026 and Autumn 2025 booster campaigns.
Full details of eligibility and the vaccines being used for the Spring campaign can be found in the UK Governments Green Book published here.
The following chart shows the number of Covid vaccinations given by week for each of the booster campaigns in England.
During the first two weeks of the Autumn 2026 campaign in England, 1,667,056 booster doses were given, providing 23% coverage for people aged 75 and older and 10% coverage for those who are immunosuppressed. This is lower than the first two weeks of the Spring 2026 campaign and 583,127 fewer than the Autumn 2025 campaign, which had the same group of people eligible.
In conclusion
Although the amount of data currently being published is reduced, the information available for all home nations show that Covid activity is low but rising slowly in England. However, Scotland presented a mixed picture and may have peaked. Flu levels are starting to rise earlier than in previous years.
Covid levels in wastewater is also low but rising across European countries. In the USA, Covid activity is staring to fall and is at low levels, except in a few states. Flu A activity in both the USA and Canada is staring to rise.
As always, if you have any comments on this Covid Situation Report or suggestions for topics to cover, please post a message below.
Thanks for reading Seeing The Forest for the Trees! Subscribe for free to receive new posts and support my work.
Appendix 1. Test positivity rates and prevalence
Positivity rates are derived from the results of hospital laboratory tests conducted on patients exhibiting symptoms of respiratory diseases. Test positivity is the percentage of patients who test positive for Covid of the total number of patients tested. Since the individuals tested for this measure are not a representative sample of the general population it differs from prevalence, which is derived from a representative sample of the population.
It is billing £32.99 a month but I have had no functioning phone line since it switched me to Digital Voice
I've had no landline since May 2025 when BT switched it to Digital Voice. Weeks passed, and each call to BT involved at least an hour waiting on hold and answering security questions before being passed between departments.
Eventually, last December, two engineers were sent and discovered that a wire had been severed during the upgrade. They said they needed a cherry picker to reconnect it to its original location and would return. They did not.
Continue reading...Don't be afraid to speak your desires aloud, writes advice columnist Eleanor Gordon-Smith. These are pretty normal, humble things to want
Read more Leading questions
I'm in my late 60s, divorced three years ago. I'm now in a relationship with a man I really like and would love to see it continue to develop, however it feels more like a "situationship".
It's been three months so far, the attraction was instant and strong and felt very promising. We see each other on weekends, which he has stated works for him (partly because he lives an hour away). I've told him that I would like to spend more time together and, because of his response, I decided I'd ease off and see what happens. I know he likes me, we get on well and I also know he's not seeing anyone else. The contact we have in between is sporadic and it's usually me that initiates it. If he does, it's very casual. Bottom line - I feel like I'm getting crumbs.
Continue reading...If you take a break from the gym you may lose muscle and gain fat, but it isn't as simple as one turning into the other
'This is not true," says Prof Leigh Breen, a specialist in muscle physiology at the University of Leicester. But it's a statement he hears a lot, particularly from people who have taken a long break from exercise. "They'll often refer to the notion that their muscles have 'softened' or don't feel as toned."
The reality is that there's no biochemistry linking the two types of tissue. Muscle and fat are distinct. "There's no known process in the human body that would support muscle turning into fat, or vice versa," says Breen.
Continue reading...I was standing at the traffic lights with the weight of the world on my shoulders when a man approached. He will probably never know the impact he had on my life
Read more in the kindness of strangers series
My cousin had recently died in a terrible accident and I had been the one who had to identify the body. It was one of the darkest periods of my life, on seemingly every front: I was in the midst of a divorce; it was during the global financial crisis and the company I worked for was badly struggling, making every day feel heavy with uncertainty and stress. Everything was a mess and I was emotionally exhausted.
One morning during rush hour, I stood at the traffic lights waiting to cross on my way to the office. I was lost in my thoughts but must have looked like I had the weight of the world on my shoulders, because something unexpected happened.
Continue reading...New post-Brexit rules mean that dual nationals cannot enter the UK unless they have a British passport
My teenage daughter is unable to see her grandparents because of the UK's new requirement for dual nationals to hold a UK passport.
I'm a UK citizen, married to a French national, and we live in France. Our two older children have both French and UK passports. Our third child was born while we were living in Zimbabwe and only has a French passport.
Continue reading...Smaller and less visited than Como and Garda, Lake Iseo harbours a gorgeous car-free island ideal for easy-going cycling and sightseeing
Rust red and burnt sienna speckle the green mountain rising from Lake Iseo. Golden autumn sunlight shimmers on the water. Monte Isola, Italy's largest lake island, is a peak of sheer cliffs and dense forest, dotted with old fishing hamlets and hillside villages, each as pretty as the terraced villas of Lake Como and Garda, but with far fewer visitors. I arrive at the small port town of Peschiera Maraglio - where striped wooden boats jut from the water like the gondolas of Venice - on a ferry from Sulzano, a five-minute hop across the water.
"Only three people on the island are allowed to own a car: the priest, the doctor and the mayor," says Chiara, my tour guide from Brescia. Residents can zip up and down the steep island roads on mopeds, and a small fleet of van-sized buses trundle around throughout the day, but nearly all cars are forbidden and visitors have to explore on foot or bike.
Continue reading...Running is one of the easiest exercises to take up, but it can be easy to lose your mojo and get injured. Coaches give their advice on how to hit your stride
Whether you have never been for a run or are building up to a marathon, sometimes the biggest challenge is just getting out the door. Here, running coaches share their tips on everything from mindset to avoiding injuries - but mainly how to find joy in running.
Continue reading...His behaviour is certainly inappropriate, but take a quiet moment to try to find out where the anger is coming from
My partner and I have been together for 25 years and we have two sons, aged 14 and 16. Both are football crazy and have played since they were very young. My partner's competitive nature was one of the things I initially found attractive about him (I wanted someone with drive).
However, this side of him rears its ugly head when our kids play matches. He shouts, criticises and, worst of all, swears at teenagers. I'm so embarrassed by it and it's also affecting the boys. Their teammates hear their dad and it's creating tension. I've tried to speak to him about it but he brushes it off. Our boys and the coaches have spoken to him too, but to no avail.
Continue reading...People often forget social rules when dogs are involved, writes advice columnist Eleanor Gordon-Smith. But you'll have to say something if you want things to change
Read more Leading questions
A good friend of mine stays with me regularly when she comes into town. She brings her husband and two dogs that don't get along with my dog. They've "used the bathroom" in our house before. I try to be nice and help clean or pretend it doesn't bother me so that they feel comfortable. But when she asks for a weekend to come back with everyone, I kind of dread it. I enjoy seeing her and she's a great friend. I think our friendship would be better if she stayed somewhere else, but I would feel bad if she stayed in a hotel and I don't think she'd visit as often. She cleans up after the dogs and whatnot, but I like my home to be my safe haven. This friend doesn't handle confrontation well, but is understanding. What can I do to handle this?
Eleanor says: It sounds as though you're in the jam we all get into when we try to smooth things over: you can have the social ease of pretending something is fine; or the outcome from confessing it isn't, but not both simultaneously.
Continue reading...
This report belongs to a weekly series summarising the Covid situation across the UK's home nations and other countries.
Thanks for reading Seeing The Forest for the Trees! Subscribe for free to receive new posts and support my work.
This week's report highlights the latest trends in respiratory illness activity across England and Wales only. It also shares recent Covid levels in selected countries in Europe, North America and Asia.
Charts for the USA were updated on Friday, Oct 9 to reflect the latest published data.
Public Health Scotland have resumed publishing Covid data as last weeks technical issues are now resolved.
Summary.
This week, Covid trends in the UK present a mixed picture. In England, Covid indicators have risen again, though from low levels, indicating that while the risk remains low, it is increasing. In Scotland Covid indicators are going in different directions, but Covid levels may have peaked. Data from Wales and Northern Ireland shows Covid levels are stable and remain moderately low.
In England, all key indicators increased this week indicating a low but increasing risk of Covid. Test positivity rates are now low across all regions but continue to remain highest in London, the West Midlands, and Yorkshire & Humberside. Whilst Flu activity is low it is rising earlier than previous years.
Although there was no data available at the time of publishing, Public Health Scotland did report "that there is no unusual activity identified from the data that have been received this week".
This week, Covid admissions in Wales remained stable and at moderately low levels ,while Flu and RSV hospitalisations remained stable and low.
In Northern Ireland, Covid activity showed a mixed picture, but remained relatively stable and low across most surveillance indicators.
Covid levels in wastewater increased slowly this week across most European countries still reporting data, but overall they are still relatively low apart from France which has moderate levels.
For the week ending Oct 3, Covid activity in the USA has continued to fall slowly , with most States now experiencing low levels. Meanwhile Flu activity is starting to rise.
Covid levels remain low in Hong Kong and Singapore, but Flu activity is currently high.
With the UK Flu season likely starting a bit earlier this year, now's the time to get vaccinated. Free Flu vaccinations for those eligible will be available from Oct 1, 2026. Further details can be found at the following links - England, Scotland (invitation letter required), Wales, and Northern Ireland.
The UK's Autumn 2026 Covid Booster campaign also starts on Oct 1 and details of who is is eligible and how to arrange a vaccination can be found at the following links - England, Scotland, Wales, and Northern Ireland (not presently available).
As always, it's important to remember that the risk of hospitalisation from Covid increases significantly with age and for the clinically vulnerable. Therefore, it is important to take appropriate measures such as self-isolating when experiencing Covid symptoms and enhancing ventilation or wearing masks whenever possible.
Status of main respiratory diseases in England.
UKHSA have moved to publishing the Flu and COVID-19 surveillance reports fortnightly over the summer so data is only available from the Covid Dashboard this week.
This section starts with the latest data on test positivity rates for Covid in England. It's important to note that positivity is different from prevalence, which reflects the overall percentage of Covid cases in the general population. Appendix 1 offers a more detailed explanation of the distinction.
The following chart shows the test positivity rate for all Covid tests taken mapped against the UKHSA activity thresholds. The thresholds are based on the historical trend for Covid test positivity and, consequently, represent a relative risk. More details on this approach can be found in the Guide to Covid Surveillance Metrics.
The chart shows that the test positivity rate is steadily rising and, though still at a low activity level, signals a growing level of risk. The rate remains highest at 13.1% for those aged 85 and above and at 10.7% for people between 15 and 24 years old, then falls to just 1.2% for individuals aged 5 to 14 years.
The next chart shows that positivity rates for all tests carried out differ between regions. All regions saw increased test positivity rates and are now at a low level of activity. In particular, rates are rising fast in the London which has the highest rate and is close to medium activity levels. West Midland and Yorkshire & Humberside rates are relatively high. Meanwhile rates are lowest in the South West and East of England.
The following chart highlights the key indicators of Covid in hospitals: weekly visits to Emergency Departments, test positivity rates among patients with respiratory issues, hospital admission and intensive care rates.
All of these hospital indicators for Covid activity increased, indicating a low but rising risk.
The final chart in this section compares the positivity rate for hospital patients for the main respiratory viruses, with Covid and Flu positivity rates remain at low activity levels even with slight increases. However, Flu rates have started rising earlier than in previous years. The Rhinovirus rate is also rising and has now moved to medium activity level. Meanwhile, RSV remains at out of season levels.
Scotland weekly hospital admissions and test positivity
Public Health Scotland has now returned to publishing the Viral Respiratory Diseases in Scotland surveillance report weekly.
The latest edition, published on Oct 8, reported that indicators of respiratory infections remain at baseline activity, typical for this time in the season.
However, pre-season increases in Flu have been detected in both laboratory and community acute respiratory infection surveillance. Flu activity is noticeably higher this week compared to past seasons, especially among adults aged 65 and older, who make up more than half of all flu hospitalisations.
The following panel chart presents the latest data for Covid levels in wastewater in blue, weekly Covid test positivity shown in red, Covid hospital admissions depicted in orange, and beds occupied by Covid patients in brown.
Although wastewater and test positivity fell slightly this week, hospital admissions increased a little, presenting a mixed picture. However, all indicators remained relatively low compared to previous waves, suggesting that this will be smaller than earlier ones.
The final chart in this section compares the test positivity rates for hospital patients with respiratory symptoms for Covid, Flu, and RSV. Covid positivity rates fell to 5.6% from 7.1% in the previous week, while RSV rates remained stable and below baseline levels. Flu rates continue to increase and earlier than in previous years, suggesting the Flu season is starting early.
Wales Covid hospital admissions.
The following chart provides the latest trend for weekly hospital admissions for the main respiratory viruses in Wales up to week ending Oct 4, 2026.
Hospital admissions for Covid have increased over the past few weeks, but appear to have stabilised this week.
The weekly Weekly Surveillance Report for Oct 2, 2024 confirms that Covid activity is increasing. While the overall proportion of samples testing positive stayed steady at 7.3% in hospitals and GP practices, GP consultations for Covid have increased in recent weeks.
Finally, the infection report confirmed that Flu circulation is at low levels, while Respiratory Syncytial Virus (RSV) is holding steady at baseline intensity.
Status of main respiratory diseases in Northern Ireland.
Public Health Northern Ireland's respiratory surveillance report covering Covid activity has now returned to being published weekly. The latest report covers data through to the week ending Oct 4, 2026 and the chart below highlights the test positivity rates for Covid, Flu, and RSV.
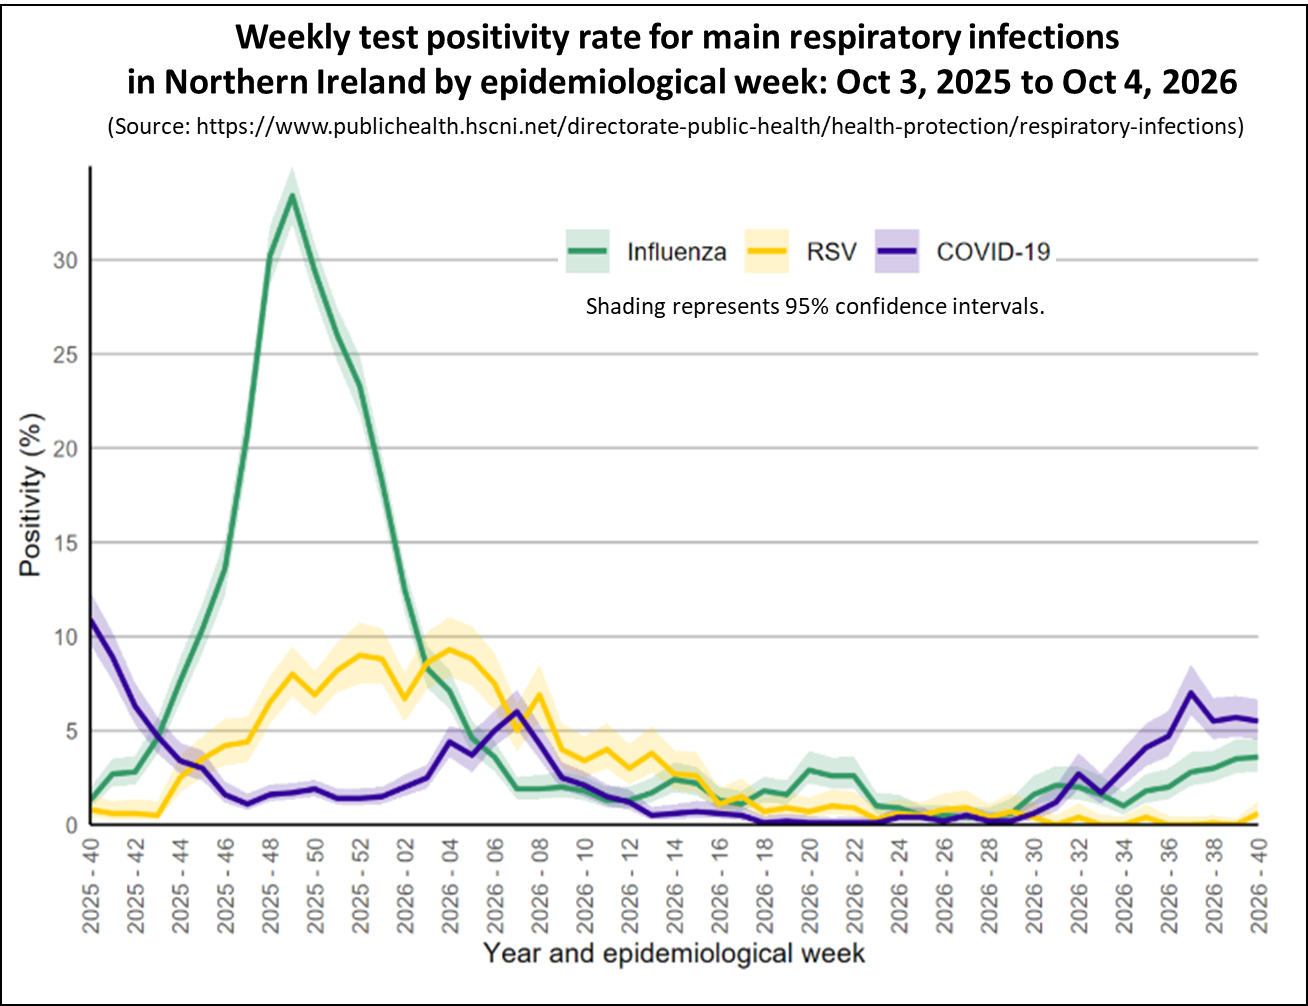
Covid activity showed mixed trends, with increases seen in some surveillance indicators, but remained at low levels. Flu and RSV activity remained low and stable across all surveillance indicators.
Covid Activity in Europe.
This section looks at the latest Covid trends in Europe and examines how wastewater patterns align with prevalence and hospital data in selected countries.
The following chart shows the latest levels of Covid up to week ending Oct 1, 2026 as measured by monitoring wastewater in a number of European countries that still publish this information.
This week, Covid levels in wastewater increased in most European countries still sharing this data but remained relatively low apart from in France which now at moderate levels.
Wastewater levels are not the only measures of Covid activity published by these countries and it is valuable to see how well the wastewater trends compare to the other key indicators.
The Netherlands is the only country in Europe still publishing prevalence data. Estimates of the percentage of the population with Covid are based on a weekly survey of volunteers. Since this isn't a random survey, statistical adjustments are made to reflect the demographics of the Netherlands.
The following chart displays the latest Covid wastewater trend in orange, the estimated prevalence in red, and the percentage of detections from laboratory surveillance in green, all for the Netherlands.
The chart clearly shows how closely the trend for Covid wastewater follows the trend for prevalence and the percent of Covid detected in laboratory surveillance. All of these indicators of Covid activity in the Netherlands again increased this week, but remain relatively low.
Comparing wastewater levels in Germany and France alongside hospital trends reveals a similar pattern. The two charts on the left show Germany's wastewater trends compared to their Covid hospital admissions, while the charts on the right display France's wastewater levels against the percentage of Emergency Department visits due to Covid.
The latest data shows that Covid activity is rising in both countries, with levels in France now approaching moderately low levels.
In summary, Covid wastewater trends are a reliable indicator of Covid activity in both the community and hospital settings.
Covid Activity in North America.
This section provides details of Covid activity in USA and Canada.
Charts for the USA were updated on Friday, Oct 9 to reflect the latest information.
As of the week ending Oct 3, 2026, Covid activity in the USA is staring to fall, indicating that the risk remains low in most states, and those states in the South and West which previously had higher levels of activity are starting to see falling levels.
The following chart shows the weekly trend for the national key Covid indicators covering wastewater activity levels, percent of emergency department visits due to Covid, test positivity, and the hospital admission rate in the USA.
The panel chart shows that the hospital indicators of Covid activity have continued to fall in the week ending Oct 3, 2026, and for most measures are at low levels although test positivity remained moderately high. Although Covid levels in wastewater are unchanged, this may be due to the addition of new testing sites.
While Covid levels are falling, Flu activity is beginning to increase, though still starting from low levels as shown in the following chart.
The next chart shows the Covid trends by state as estimated by the CDC for Oct 6, 2026. Most States are showing a declining trend or no change. This week there are just 11 states showing a growing trend compared to 19 in the previous week.
A reminder that the trend represents the direction of activity only and does not indicate the level of activity. Consequently, this map should be used in conjunction with other data like the percent of Emergency Department visits due to Covid. This information is available by hovering your cursor over any State even if the trend is not estimated.
The final map for the USA presents wastewater analysis for week ending Oct 3, 2026 and shows that Covid levels are low in many States as illustrated in the following map.
Each State is coloured based on activity levels, ranging from very high (dark red) to very low (light green), with grey indicating no data available. States with increasing activity levels are marked with cross-hatching. It is important to understand that the wastewater activity level is relative to the lowest levels seen in the past two years. Consequently, it is not a fixed absolute scale across all years. It is primarily a measure of how current wastewater viral levels compare with recent low levels in that State.
Activity is at a moderate level in States in the West regions. However, Florida wastewater activity levels has risen to very high this week, even though the estimated trend shown in the previous map indicates that activity levels based on other measures are falling.
In Canada, data for the week ending Sep 26, 2026, shows that Covid wastewater levels stayed at moderate levels, although levels in the western provinces are higher. Flu A activity is starting to rise and is now at a moderate level.
Status of main respiratory diseases in Asia.
This section provides the latest information on Covid and Flu activity levels in Hong Kong and Singapore.
The following chart displays the key Covid indicators for Hong Kong up to the week ending Oct 3, 2026. Although Covid levels in wastewater samples increased in July, the latest hospital surveillance data shows that the overall local activity of Covid has fallen to very low levels and the recent wave is over.
However, Flu presents a very different picture and the following chart shows that the Flu levels in Hong Kong is presently very high.
The next chart presents the weekly Covid positivity rate for tests carried out on patients with respiratory symptoms in Singapore up to week ending Sep 19, 2026. It shows that Covid activity peaked in May, consistent with the previous two years, and has now fallen to low levels.
However, Flu activity is high in Singapore, similar to Hong Kong.
In conclusion
Although the amount of data currently being published is reduced, the information available for all home nations show that Covid activity is low but rising slowly in England. However, Scotland presented a mixed picture and may have peaked.
Covid levels in wastewater is also low but rising across European countries. In the USA, Covid activity is staring to fall and is at low levels, except in a few states. Flu A activity in both the USA and Canada is staring to rise.
As always, if you have any comments on this Covid Situation Report or suggestions for topics to cover, please post a message below.
Thanks for reading Seeing The Forest for the Trees! Subscribe for free to receive new posts and support my work.
Appendix 1. Test positivity rates and prevalence
Positivity rates are derived from the results of hospital laboratory tests conducted on patients exhibiting symptoms of respiratory diseases. Test positivity is the percentage of patients who test positive for Covid of the total number of patients tested. Since the individuals tested for this measure are not a representative sample of the general population it differs from prevalence, which is derived from a representative sample of the population.

Rates of COVID-19 continue to fluctuate throughout the year, and people have asked how the most common current lineages - or groups of genetically similar viruses - compare to previous COVID-19 variants.
What is 'American Covid'?XFG - sometimes referred to in the media as the Stratus variant - remains the most common current COVID-19 variant. XFG has also been referred to as 'American Covid' in some media coverage, though it is not new and has been circulating in the UK and other countries for around a year. The name reflects where the strain was first sequenced and detected, rather than necessarily where it originated.
What have we seen so far this season?UK Health Security Agency (UKHSA) data shows that COVID-19 positive test rates rose to around 7% in September, with hospital admission rates increasing by approximately 50% over the same period. These increases have been observed consistently across England, Scotland, Wales and Northern Ireland, as well as across Europe and the United States, indicating this is not a localised trend.
Current data does not indicate that these variants lead to more severe illness than other variants in circulation. UKHSA monitors a range of surveillance systems, including GP appointments, A&E attendances and hospitalisations, alongside genomic sequencing, to track how variants are behaving. As increases in hospitalisations are rising in line with overall increases in COVID-19 circulation - rather than rising sharply on their own - this suggests a general increase in COVID-19 activity rather than a variant causing more severe disease.
There are likely to be several factors behind the current rise. As we move into winter, colder and wetter weather means people spend more time indoors, which enables the spread of respiratory viruses. It has also been roughly a year since the last significant COVID-19 wave, so immunity from vaccination and previous infection may be waning in parts of the population, making people more susceptible.
What about the BA.3.2 variant?Previously we also had detected BA.3.2, a highly divergent descendant of the Omicron BA.3 lineage that re-emerged in South Africa in late 2024. It has since been sporadically detected across multiple continents. BA.3.2 is sometimes called the 'Cicada' variant. The World Health Organization (WHO) has designated BA.3.2 a Variant Under Monitoring (VUM). WHO currently assesses the public health risk as low, as there is no evidence of increased severity, hospitalisation, or mortality, although available evidence remains limited.
If I have COVID-19 symptoms, what should I do?If you have symptoms of a respiratory infection, such as COVID-19, and you have a high temperature or do not feel well enough to go to work or carry out normal activities, you should avoid contact with vulnerable people and stay at home if possible. For those of us who absolutely can't stay at home, the guidance remains unchanged, and will reduce the chance of passing on your infection to others:
- wear a well-fitting face covering made with multiple layers or a surgical face mask
- avoid crowded places such as public transport, large social gatherings, or anywhere that is enclosed or poorly ventilated
- take any exercise outdoors in places where you will not have close contact with other people
- cover your mouth and nose when you cough or sneeze; wash your hands frequently with soap and water or use hand sanitiser after coughing, sneezing and blowing your nose and before you eat or handle food; avoid touching your face
Vaccines remain our best defence against severe disease and hospitalisation from flu and COVID-19. The NHS will contact you if you are eligible for a COVID-19 vaccination.
Current eligibility includes people aged 75 and over, those with weakened immune systems, and those living in care homes for the elderly. Anyone who falls into these groups is strongly encouraged to take up the vaccine, as it provides protection against severe illness.
Are there people who are particularly vulnerable to COVID-19?The NHS provides treatment to people with COVID-19 who are at the highest risk of becoming seriously ill. You may be eligible for a COVID-19 treatment assessment if you are aged 12 or over, have symptoms and have tested positive for COVID-19, and have certain health conditions. These include conditions affecting the immune system, certain cancers or cancer treatments, kidney or liver disease, organ transplants, autoimmune or inflammatory conditions, and conditions affecting the brain, nervous system or lungs. If you're unsure whether you're eligible, speak to your GP or hospital specialist who can advise you.
What surveillance systems are in place?We publish weekly surveillance data for COVID-19 and other respiratory illnesses during the winter season. We're also getting vital data from those who are admitted to hospital with symptoms and use genome sequencing to understand which variants people are most vulnerable to.
Hospitals are where we will see the more severe cases, and we monitor the numbers of people attending who test positive, or with COVID-19 symptoms, very carefully. This helps us understand the growth rate and transmission potential of the current variants.
 'It's hard to imagine the fires of July': a bike ride through the Cairngorms in Scotland [ 07-Oct-26 7:00am ]
Wildfires raged through the national park this summer, but much of the landscape remains untouched - and autumn is the perfect time to go
In the Cairngorms national park, the bracken is changing from dark green to russet and umber. Birch leaves are lined with gold, while the Scots pines remain proudly green. Autumn is arriving with a little sigh of relief here, after a summer few will forget.
The wildfire that began near Glenmore and Abernethy on 15 July burned more than 33 sq km (13 sq miles) of moorland and forest. More than 500 firefighters were involved; homes and businesses were evacuated; and the emergency response lasted over a month. Visiting now, it's hard to see, or even imagine, the damage. Much of the burned area is high on the hill and far from the roads. It's a huge loss but, in a national park stretching 4,528 sq km (1,748 sq miles), surprisingly easy to miss.
Continue reading...Barbara O'Neill has previously claimed that cancer is a fungus that can be treated with bicarbonate soda
A controversial proponent of natural remedies who has been banned from providing any health services in Australia is due to embark on a series of events in the UK and Ireland despite criticism from scientists, health charities and academic bodies.
Barbara O'Neill, who describes herself as a naturopath and nutritionist, lectures internationally on "natural self-healing".
Continue reading...
This report belongs to a weekly series summarising the Covid situation across the UK's home nations and other countries.
Thanks for reading Seeing The Forest for the Trees! Subscribe for free to receive new posts and support my work.
This week's report highlights the latest trends in respiratory illness activity across England and Wales only. It also shares recent Covid levels in selected countries in Europe, North America and Asia.
Charts for the USA and Canada will be updated on Friday, Oct 2 to reflect the latest published data.
Public Health Scotland have not yet published Covid data due to technical issues. The section on Scotland will be updated as soon as this data is available.
Summary.
This week, Covid activity in the UK presents a mixed picture. In England, Covid indicators have risen again, though from low levels, indicating that while the risk remains low, it is starting to increase. Revised data from Wales shows Covid levels are rising but remain moderately low.
In England, all key indicators increased this week indicating a low but increasing risk of Covid. Test positivity rates are climbing fastest in the West Midlands, London, and Yorkshire & Humberside, highlighting notable regional differences.
Although there was no data available at the time of publishing, Public Health Scotland did report "that there is no unusual activity identified from the data that have been received this week".
This week, Public Health Wales revised their data on Covid hospital admissions to fix a reporting error. The corrected data now shows that Covid admissions in Wales are rising, indicating an increasing level of risk. Flu and RSV hospitalisations remained stable and very low.
There was no update for Northern Ireland this week. The previous week showed mixed trends in Covid activity, with some surveillance indicators increasing, but overall levels remaining low.
Covid levels in wastewater increased slowly this week across all European countries still reporting data, but overall they are still relatively low apart from France which has moderate levels.
For the week ending Sep 19, Covid activity in the USA has been slowly falling, with most States now experiencing low levels. Many areas that previously had higher activity, especially in the West and South, are seeing drops. Texas still shows relatively high wastewater activity, but it's trending downward.
Hong Kong and Singapore remain at low levels of Covid activity.
With the UK Flu season likely starting a bit earlier this year, now's the time to get vaccinated. Free Flu vaccinations for those eligible will be available from Oct 1, 2026. Further details can be found at the following links - England, Scotland (invitation letter required), Wales, and Northern Ireland.
The UK's Autumn 2026 Covid Booster campaign also starts on Oct 1 and details of who is is eligible and how to arrange a vaccination can be found at the following links - England, Scotland, Wales, and Northern Ireland (not presently available).
As always, it's important to remember that the risk of hospitalisation from Covid increases significantly with age and for the clinically vulnerable. Therefore, it is important to take appropriate measures such as self-isolating when experiencing Covid symptoms and enhancing ventilation or wearing masks whenever possible.
Status of main respiratory diseases in England.
UKHSA have moved to publishing the Flu and COVID-19 surveillance reports fortnightly over the summer so data is only available from the Covid Dashboard this week.
This section starts with the latest data on test positivity rates for Covid in England. It's important to note that positivity is different from prevalence, which reflects the overall percentage of Covid cases in the general population. Appendix 1 offers a more detailed explanation of the distinction.
This chart displays the test positivity rate from the UK's Covid dashboard for all Covid tests, compared against the UKHSA activity thresholds. The thresholds are based on the historical trend for Covid test positivity and, consequently, represent a relative risk. More details on this approach can be found in the Guide to Covid Surveillance Metrics.
The chart shows that the test positivity rate continues to increase and is well within the low level of activity, indicating a low but increasing level of risk.
The next chart shows that positivity rates for all tests carried out differ between regions. All regions saw increased test positivity rates and are now at a low level of activity apart from the North East. In particular, rates are rising fast in the West Midland which has the highest rate and is very close to medium activity levels. London rates are also rising quickly and are their highest level for two years. Yorkshire & Humberside rates are also rising fast. Meanwhile rates are lowest in the north East and South West.
Scotland weekly hospital admissions and test positivity
Public Health Scotland reported that due to technical issues there was no release of Covid data or the weekly viral respiratory diseases surveillance report on Thursday 1 October.
This section will be update when data becomes available.
However, they did advise that there is no unusual activity identified from the data that have been received this week.
The latest edition of the report published on Sep 17, confirms that during the reporting period Aug 10 to Sep 6 , 2026 all respiratory disease indicators for Covid, Flu and RSV remained at baseline activity. However, Covid test positivity increased to an average of 3.7% across this period in community surveillance, up from 1.3%. In laboratory surveillance, activity remained at baseline despite case numbers doubling from 65 to 128. This shows a similar trend to the same time last year, but at lower levels overall. The XFG variant accounted for the majority (61%) of detections in the most recent sequencing data available.
The following panel chart presents last weeks data for Covid levels in wastewater in blue, weekly Covid test positivity shown in red, Covid hospital admissions depicted in orange, and beds occupied by Covid patients in brown.
After a drop the previous week, all key indicators of Covid activity increased slightly this week, suggesting the wave isn't over yet but will likely be smaller than earlier ones.
The final chart in this section compares the test positivity rates for hospital patients with respiratory symptoms for Covid, Flu, and RSV for last week. Covid positivity rates rose to 5.6% from 3,9% in the previous week, while RSV rates remained stable and below baseline levels. Flu rates continue to increase slowly and earlier than in previous years, suggesting the Flu season may be starting early.
Wales Covid hospital admissions.
The following chart provides the latest trend for weekly hospital admissions for the main respiratory viruses in Wales up to week ending Sep 27, 2026.
Hospital admissions for Covid have increased over the past few weeks. Unfortunately, data published for the past few weeks has under-reported Covid admissions. Public Health Wales have now identified and resolved the issue.
The weekly Acute Respiratory Infection Report confirms that Covid activity is increasing. While the overall proportion of samples testing positive stayed steady at 7.3% in hospitals and GP practices, GP consultations for Covid have increased in recent weeks.
Finally, the infection report confirmed that Flu circulation is at low levels, while Respiratory Syncytial Virus (RSV) is holding steady at baseline intensity.
Status of main respiratory diseases in Northern Ireland.
Public Health Northern Ireland's respiratory surveillance report covering Covid activity is published every two weeks over the summer period. There was no updated report published this week. The latest available report covers data through to the week ending Sep 20, 2026 and the chart below highlights the test positivity rates for Covid, Flu, and RSV.
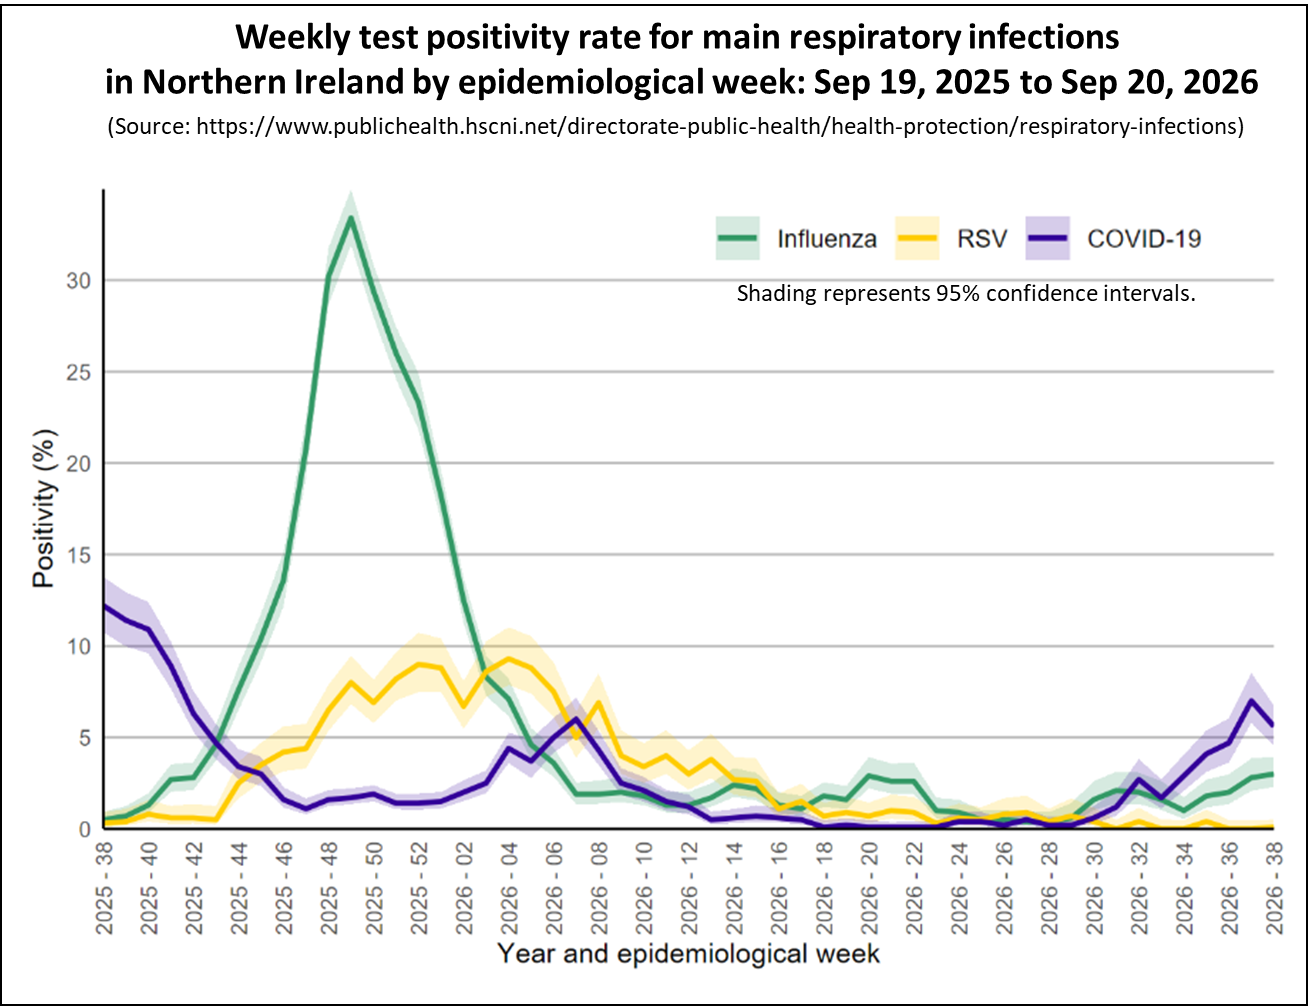
Covid activity showed mixed trends, with increases seen in some surveillance indicators, but remained at low levels. Flu activity increased across all surveillance indicators although it stayed at low levels. Finally, RSV activity remained low and stable across surveillance indicators.
Covid Activity in Europe.
This section looks at the latest Covid trends in Europe and examines how wastewater patterns align with prevalence and hospital data in selected countries.
The following chart shows the latest levels of Covid up to week ending Sep 24, 2026 as measured by monitoring wastewater in a number of European countries that still publish this information.
This week, Covid levels in wastewater increased in all European countries still sharing this data but remained relatively low apart from France
Wastewater levels are not the only measures of Covid activity published by these countries and it is valuable to see how well the wastewater trends compare to the other key indicators.
The Netherlands is the only country in Europe still publishing prevalence data. Estimates of the percentage of the population with Covid are based on a weekly survey of volunteers. Since this isn't a random survey, statistical adjustments are made to reflect the demographics of the Netherlands.
The following chart displays the latest Covid wastewater trend in orange, the estimated prevalence in red, and the percentage of detections from laboratory surveillance in green, all for the Netherlands.
The chart clearly shows how closely the trend for Covid wastewater follows the trend for prevalence and the percent of Covid detected in laboratory surveillance. All of these indicators of Covid activity in the Netherlands are presently relatively low.
Comparing wastewater levels in Germany and France alongside hospital trends reveals a similar pattern. The two charts on the left show Germany's wastewater trends compared to their Covid hospital admissions, while the charts on the right display France's wastewater levels against the percentage of Emergency Department visits due to Covid.
The latest data shows that although Covid activity is rising in both countries, levels in France are now approaching moderately low levels.
In summary, Covid wastewater trends are a reliable indicator of Covid activity in both the community and hospital settings.
Covid Activity in North America.
This section provides details of Covid activity in USA and Canada.
Charts for the USA and Canada will be updated on Friday, Oct 2 to reflect the latest information.
As of the week ending Sep 19, 2026, Covid activity in the USA is staring to fall, indicating that the risk remains low in most states, and those states in the South and West which previously had higher levels of activity are starting to see falling levels.
The following chart shows the weekly trend for the national key Covid indicators covering wastewater activity levels, percent of emergency department visits due to Covid, test positivity, and the hospital admission rate in the USA.
The panel chart shows that the key indicators of Covid activity have fallen slightly for the week ending Sep 19, 2026, and for most measures are at low levels although test positivity remained moderately high.
Wastewater analysis for week ending Sep 19, 2026 showed that Covid levels are low in many States as illustrated in the following map. Activity is at a moderate level in States in the West regions. Texas activity levels fell to high this week, although other measures show that activity is low.
Each State is coloured based on activity levels, ranging from very high (dark red) to very low (light green), with grey indicating no data available. States with increasing activity levels are marked with cross-hatching. It is important to understand that the wastewater activity level is relative to the lowest levels seen in the past two years. Consequently, it is not a fixed absolute scale across years. It is primarily a measure of how current wastewater viral levels compare with recent low levels in the State.
The final chart for the USA presents the Covid trends by state as estimated by the CDC. Most States are showing a declining trend or no change. This week there are just 20 states showing a growing trend compared to 30 in the previous week.
A reminder that the trend represents the direction of activity only and does not indicate the level of activity. Consequently, this map should be used in conjunction with other data like the percent of Emergency Department visits due to Covid. This information is available by hovering your cursor over any State even if the trend is not estimated.
In Canada, data for the week ending Sep 5, 2026, shows that Covid wastewater levels stayed at moderate levels, although levels in the western provinces remained higher.
Covid Activity in Asia.
This section provides the latest information on Covid activity levels in Hong Kong and Singapore.
The following chart displays the key Covid indicators for Hong Kong up to the week ending Sep 24, 2026. Although Covid levels in wastewater samples increased in July, the latest hospital surveillance data shows that the overall local activity of Covid has fallen to very low levels and the recent wave is over.
The next chart presents the weekly Covid positivity rate for tests carried out on patients with respiratory symptoms in Singapore up to week ending Sep 12, 2026. It shows that Covid activity peaked in May, consistent with the previous two years, and has now fallen to low levels.
In conclusion
Although the amount of data currently being published is reduced, the information available for all home nations show that Covid activity is low but rising slowly in England and Wales.
Covid levels in wastewater is also low but rising across European countries. In the USA, Covid activity has increased but is still at low levels, except in a few states. Flu A activity in both the USA and Canada have dropped to low levels.
As always, if you have any comments on this Covid Situation Report or suggestions for topics to cover, please post a message below.
Thanks for reading Seeing The Forest for the Trees! Subscribe for free to receive new posts and support my work.
Appendix 1. Test positivity rates and prevalence
Positivity rates are derived from the results of hospital laboratory tests conducted on patients exhibiting symptoms of respiratory diseases. Test positivity is the percentage of patients who test positive for Covid of the total number of patients tested. Since the individuals tested for this measure are not a representative sample of the general population it differs from prevalence, which is derived from a representative sample of the population.
The Guardian spoke with surrogates across the US about what they think of the controversy surrounding the practice
Surrogacy has been thrust into the national spotlight in recent weeks, with both the announcement of Lena Dunham using a surrogate to start a family and the ongoing legal battle surrounding McKenna West, a gestational surrogate who fled to Texas to avoid having an abortion that was requested by the child's biological parents.
With a renewed public interest on commercial, or compensated, surrogacy, the Guardian spoke with surrogates across the US who shared their experiences and how they feel about surrogacy being part of a global, public conversation.
Continue reading...Critics say partnership between Mounjaro maker Eli Lilly and fashion giant suggests thinness is an aspiration
The fifth iteration of Vogue World, overseen by Anna Wintour, took place in Milan on Tuesday night. Gigi Hadid and Jennifer Lopez provided theatrics on the catwalk, but it was one of the event's backers that caused the biggest stir.
Eli Lilly, an American pharmaceutical company that manufactures a wide range of medicines, including weight-loss jabs Mounjaro and the Foundayo pill, was listed in the event credits as one of its "fashion adjacent" sponsors.
Continue reading...
This report belongs to a weekly series summarising the Covid situation across the UK's home nations and other countries.
Thanks for reading Seeing The Forest for the Trees! Subscribe for free to receive new posts and support my work.
This week's report highlights the latest trends in respiratory illness activity across England, with updated figures for Scotland, and Wales, and Northern Ireland. It also shares recent Covid levels in selected countries in Europe and North America.
Charts for the USA will be updated on Friday, Sep 25 to reflect the latest published data.
Summary.
This week, Covid activity in the UK presents a mixed picture. In England, Covid indicators have risen again, though from low levels, indicating that while the risk remains low, it is starting to increase. Covid activity in Scotland is now rising again indicating that this wave is not yet over. Meanwhile activity in Wales remains low.
In England, all key indicators increased this week indicating a low but increasing risk of Covid. Test positivity rates are climbing fastest in the West Midlands, London, and Yorkshire & Humberside, highlighting notable regional differences.
After a fall last week, all key indicators of Covid activity in Scotland increased slightly this week, suggesting the wave isn't over yet but will likely be smaller than earlier ones. The signs continued that this year's Flu season is starting earlier than in previous years.
This week, there were again only four Covid hospital admissions in Wales. Flu admissions have continued to rise and, while still low, are higher than they were at this time last year. RSV hospitalisations remained stable and very low.
There was no update available for Northern Ireland at the time of writing. The latest report showed Covid activity in Northern Ireland increased slightly across all surveillance indicators, but remained low.
Covid levels in wastewater increased slowly this week across all European countries still reporting data, but overall they are still relatively low. Comparing wastewater trends with other key indicators shows that they are a reliable indicator of Covid activity in both the community and hospital settings.
For the week ending Sep 12, overall Covid activity in the U.S.A. has plateaued with most states still seeing low activity levels. Many states that once had higher activity are now seeing falling levels, especially in the West and South. In particular, although Texas still has relatively high activity, it is on a downward trend.
With the UK Flu season likely starting a bit earlier this year, now's the time to get vaccinated. Free Flu vaccinations for those eligible will be available from Oct 1, 2026. Further details can be found at the following links - England, Scotland (invitation letter required), Wales, and Northern Ireland.
The UK's Autumn 2026 Covid Booster campaign also starts on Oct 1 and details of who is is eligible and how to arrange a vaccination can be found at the following links - England, Scotland, Wales, and Northern Ireland (not presently available).
As always, it's important to remember that the risk of hospitalisation from Covid increases significantly with age and for the clinically vulnerable. Therefore, it is important to take appropriate measures such as self-isolating when experiencing Covid symptoms and enhancing ventilation or wearing masks whenever possible.
Status of main respiratory diseases in England.
UKHSA have moved to publishing the Flu and COVID-19 surveillance reports fortnightly over the summer so data is only available from the Covid Dashboard this week.
This section starts with the latest data on test positivity rates for Covid in England. It's important to note that positivity is different from prevalence, which reflects the overall percentage of Covid cases in the general population. Appendix 1 offers a more detailed explanation of the distinction.
The following chart shows the test positivity rate for all Covid tests taken mapped against the UKHSA activity thresholds. The thresholds are based on the historical trend for Covid test positivity and, consequently, represent a relative risk. More details on this approach can be found in the Guide to Covid Surveillance Metrics.
The chart shows that the test positivity rate continues to increase and is at low levels of activity, indicating a low but increasing level of risk. The rate is highest at 9.6% for those aged 85 and above and at 9.5% for people between 15 and 24 years old, then dips to just 3.4% for individuals aged 5 to 14 years.
The next chart shows that positivity rates for all tests carried out differ between regions. Most regions saw increased test positivity rates and are now at a low level of activity. In particular, rates are rising fast in the West Midland which has the highest rate and is approaching medium activity levels. London rates are also rising quickly and are their highest level for two years. Yorkshire & Humberside rates are also rising fast. Meanwhile rates are lowest in the South West and East of England which stayed within baseline levels.
The following chart highlights two key indicators of Covid in hospitals: weekly test positivity rates among patients with respiratory issues and hospital admission rates.
Both of these hospital indicators for Covid activity increased with the positivity rate now at low activity levels, indicating a low but rising risk.
The final chart in this section compares the positivity rate for hospital patients for the main respiratory viruses, with Covid and Flu positivity rates remain at low activity levels even with slight increases. The Rhinovirus rate is also rising and has now moved to low activity level. Meanwhile, RSV remains at out of season levels.
Scotland weekly hospital admissions and test positivity
Public Health Scotland is now publishing weekly data on Covid activity, but the Viral Respiratory Diseases in Scotland surveillance report will only be issued monthly until October 2026.
The latest edition of the report published this Sep 17, confirms that during the reporting period Aug 10 to Sep 6 , 2026 all respiratory disease indicators for Covid, Flu and RSV remained at baseline activity. However, Covid test positivity increased to an average of 3.7% across this period in community surveillance, up from 1.3%. In laboratory surveillance, activity remained at baseline despite case numbers doubling from 65 to 128. This shows a similar trend to the same time last year, but at lower levels overall. The XFG variant accounted for the majority (61%) of detections in the most recent sequencing data available.
The following panel chart presents this weeks data for Covid levels in wastewater in blue, weekly Covid test positivity shown in red, Covid hospital admissions depicted in orange, and beds occupied by Covid patients in brown.
After a drop last week, all key indicators of Covid activity increased slightly this week, suggesting the wave isn't over yet but will likely be smaller than earlier ones.
The final chart in this section compares the test positivity rates for hospital patients with respiratory symptoms for Covid, Flu, and RSV. Covid positivity rates rose to 5.6% from 3,9% in the previous week, while RSV rates remained stable and below baseline levels. Flu rates continue to increase slowly and earlier than in previous years, suggesting the Flu season may be starting early.
Wales Covid hospital admissions.
The following chart provides the latest trend for weekly hospital admissions for the main respiratory viruses in Wales up to week ending Sep 20, 2026.
This week, there were only four Covid hospital admissions in Wales. Flu admissions stayed a bit higher and are above those seen at the same time last year, while there were just three hospitalisations for RSV reported.
Publication of the weekly Acute Respiratory Infection Report has resumed. This week, the reports showed that Flu circulation is at out-of-season levels, while Respiratory Syncytial Virus (RSV) and Covid are holding steady at baseline intensity.
Status of main respiratory diseases in Northern Ireland.
Public Health Northern Ireland's respiratory surveillance report covering Covid activity is published every two weeks over the summer period. The updated report was not available at the time of publishing. The latest available report covers data through to the week ending Sep 6, 2026 and the chart below highlights the test positivity rates for Covid, Flu, and RSV.
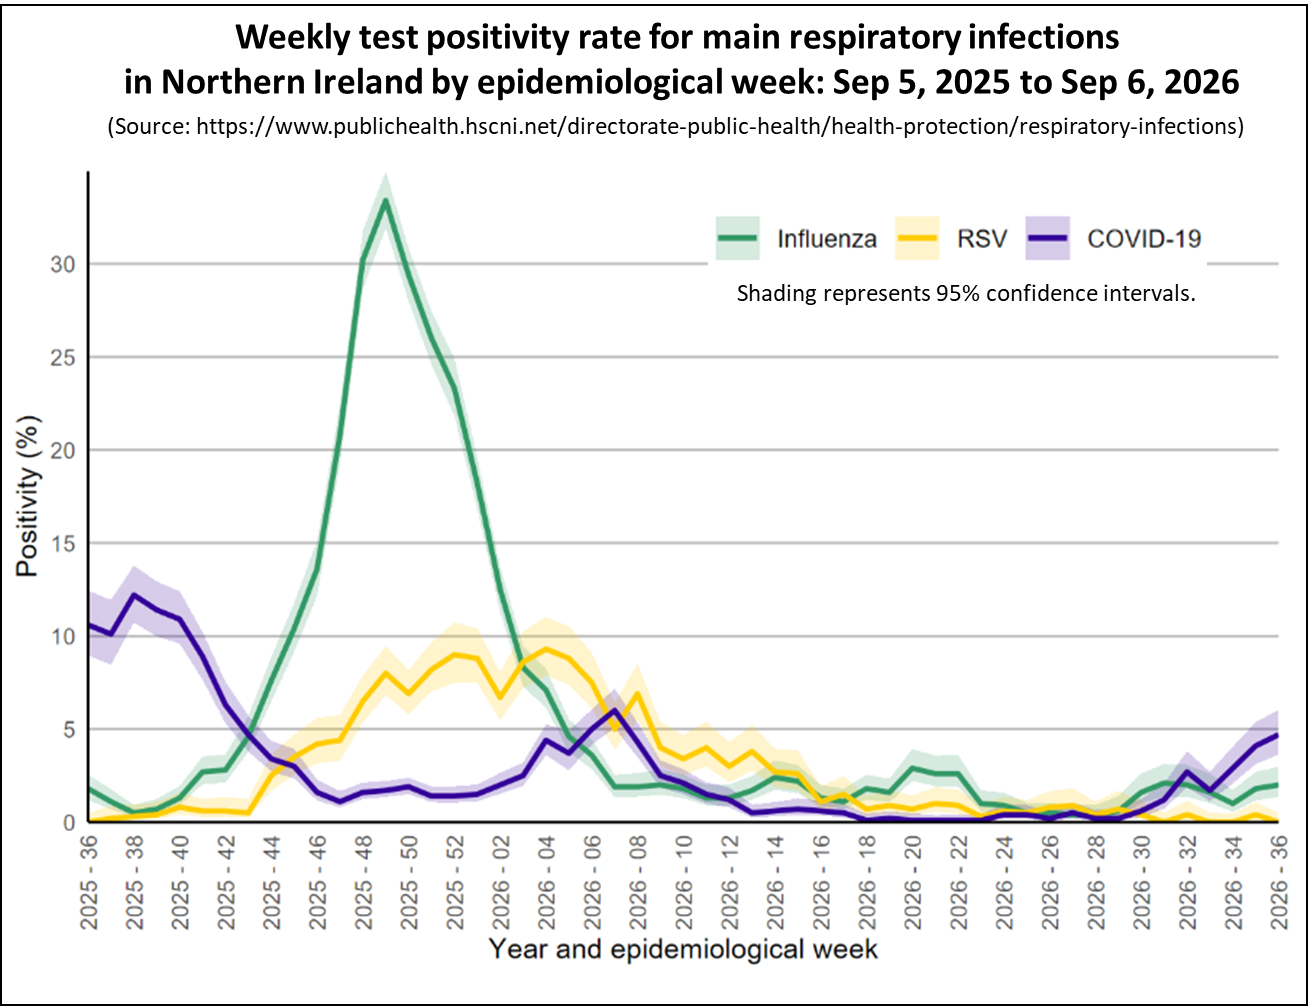
Covid test positivity and other surveillance indicators increased slightly but remained at low levels. Flu and RSV activity levels remained low and stable across all indicators.
Covid Activity in Europe.
This section looks at the latest Covid trends in Europe and examines how wastewater patterns align with prevalence and hospital data in selected countries.
The following chart shows the latest levels of Covid up to week ending Sep 17, 2026 as measured by monitoring wastewater in a number of European countries that still publish this information.
This week, Covid levels in wastewater continued to rise across most European countries still sharing this data but remained relatively low.
Wastewater levels are not the only measures of Covid activity published by these countries and it is valuable to see how well the wastewater trends compare to the other key indicators.
The Netherlands offers an interesting case, as it's the only country in Europe still publishing prevalence data. Estimates of the percentage of the population with Covid are based on a weekly survey of volunteers. Since this isn't a random survey, statistical adjustments are made to reflect the demographics of the Netherlands.
The following chart displays the Covid wastewater trend in orange, the estimated prevalence in red, and the percentage of detections from laboratory surveillance in green, all for the Netherlands.
The chart clearly shows how closely the trend for Covid wastewater follows the trend for prevalence and the percent of Covid detected in laboratory surveillance.
Comparing wastewater levels in Germany and France alongside hospital trends reveals a similar pattern. The two charts on the left show Germany's wastewater trends compared to their Covid hospital admissions, while the charts on the right display France's wastewater levels against the percentage of Emergency Department visits due to Covid.
In summary, Covid wastewater trends are a reliable indicator of Covid activity in both the community and hospital settings.
Covid Activity in North America.
This section provides details of Covid activity in USA and Canada.
Charts for the USA will be updated on Friday, Sep 25 to reflect the latest information.
As of the week ending Sep 12, 2026, Covid activity in the USA has plateaued, indicating that the risk remains low in most states, and those states in the South and West which previously had higher levels of activity are starting to see falling levels.
The following chart shows the weekly trend for the national key Covid indicators covering wastewater activity levels, percent of emergency department visits due to Covid, test positivity, and the hospital admission rate in the USA.
The panel chart shows that the key indicators of Covid activity have remained broadly unchanged for the week ending Sep 12, 2026, and for most measures are at low levels although test positivity remained moderately high.
Wastewater analysis for week ending Sep 12, 2026 showed that Covid levels are low in many states as illustrated in the following map. Activity is at a moderate level in states in the West regions. Texas activity levels increased to very high this week, but but other measures show that levels are falling.
Each state is coloured based on activity levels, ranging from very high (dark red) to very low (light green), with grey indicating no data available. States with increasing activity levels are marked with cross-hatching.
The final chart for the USA presents the Covid trends by state as estimated by the CDC. Most states are showing a declining trend or no change. This week there are just 20 states showing a growing trend compared to 30 in the previous week.
A reminder that the trend represents the direction of activity only and does not indicate the level of activity. Consequently. this map should be used in conjunction with other data like the percent of Emergency Department visits due to Covid. This information is available by hovering your cursor over any state.
In Canada, data for the week ending Sep 5, 2026, shows that Covid wastewater levels stayed at moderate levels, although levels in the western provinces remained higher.
In conclusion
Although the amount of data currently being published is reduced, the information available for all home nations show that Covid activity is low but rising slowly in England and Scotland. Flu activity has fallen from its recent peak and is now at baseline out-of-season levels.
Covid levels in wastewater is also low but rising across European countries. In the USA, Covid activity has increased but is still at low levels, except in a few states. Flu A activity in both the USA and Canada have dropped to low levels.
As always, if you have any comments on this Covid Situation Report or suggestions for topics to cover, please post a message below.
Thanks for reading Seeing The Forest for the Trees! Subscribe for free to receive new posts and support my work.
Appendix 1. Test positivity rates and prevalence
Positivity rates are derived from the results of hospital laboratory tests conducted on patients exhibiting symptoms of respiratory diseases. Test positivity is the percentage of patients who test positive for Covid of the total number of patients tested. Since the individuals tested for this measure are not a representative sample of the general population it differs from prevalence, which is derived from a representative sample of the population.
Saddling up is only likely to be an issue for elite athletes - and those with low sperm counts
"Cycling isn't big on the radar of fertility doctors," says Prof Colin Duncan, a fertility expert at the University of Edinburgh.
For women, he says, the only time cycling is likely to affect fertility is when it's done at extreme levels, such as the kind of training undertaken by elite athletes.
Continue reading...Arthur Plummer got a bike when he retired at 65 and joined a cycling club as one of its youngest members. Now he is its oldest but still racking up 5,000km every year
When Arthur Plummer retired at 65, he bought a secondhand bicycle. His sister was a member of a cycling club for seniors in the Canadian city of Waterloo, Ontario, where they lived, and Plummer joined, too, becoming one of the club's youngest members. Now he is 92 and its oldest member - but he still cycles thousands of kilometres every year. His odometer for this year so far reads 4,270km (2,650 miles). After our conversation, he intends to cycle another 40km.
"I love cycling," he says. "Wherever I go, even if I ride on the same roads, there's something new happening. When I get on my bike, I feel great. I come home at about 3pm and I feel exhausted. However, it's the nicest feeling. It's exhilarating, and it's resulted in me being extremely healthy."
Continue reading...Anna Malos and Georgie bonded over their shared love of travel and horses. By their third date, an awkward encounter cemented their relationship
Find more stories from the moment I knew series
Georgie and I met at a kick-boxing club in London in 2004. We sparred together in a few beginner classes, just hitting soft pads. Although I didn't pay her too much attention initially, I immediately recognised she was tall, elegant and very good looking.
It wasn't until the club's Christmas drinks that things kicked off between us. We started talking and couldn't stop. We'd both travelled and worked in Latin America, and also loved horses - Georgie had volunteered with a horse-riding business for tourists in Ecuador. The sparks were flying all over the place.
Continue reading...
This report belongs to a weekly series summarising the Covid situation across the UK's home nations and other countries.
Thanks for reading Seeing The Forest for the Trees! Subscribe for free to receive new posts and support my work.
This week's report highlights the latest trends in respiratory illness activity across England, with updated figures for Scotland, and Wales. It also shares recent Covid levels in selected countries in Europe, North America, and Asia.
Charts for the USA were updated on Friday, Sep 18 to reflect the latest published data.
Summary.
This week, Covid activity across the UK shows a mixed picture. Covid indicators in England have once more risen slightly albeit from low levels, suggesting that while the risk remains low, it is on the rise. In contrast Covid activity in Scotland is now falling slowly and likely to have peaked. Meanwhile activity in Wales remains low.
In England, test positivity for all Covid tests undertaken increased slightly but stayed just below baseline levels. However, there are regional differences with West Midlands, London, and Yorkshire & Humberside rising to above baseline levels.
All key Covid indicators in Scotland fell this week, suggesting that this is likely to be a smaller wave than seen previously. However, there are signs that this years Flu season is starting earlier than in previous years.
This week, there were only four Covid hospital admissions in Wales. Flu admissions have risen slightly and, while still low, are higher than they were at this time last year. RSV hospitalisations remained stable and very low.
There was no update for Northern Ireland this week. The latest report showed Covid activity in Northern Ireland increased slightly across all surveillance indicators, but remained low.
Covid levels in wastewater increased slowly this week across all European countries still reporting data, but overall they are still very low.
For the week ending Sep 12, overall Covid activity in the U.S.A. has plateaued with most states still seeing low activity levels. Many states that once had higher activity are now seeing falling levels, especially in the West and South. In particular, although Texas still has relatively high activity, it is on a downward trend.
This week, hospital Covid measures in Hong Kong continued to fall, confirming that the recent wave is over. In contrast, New Zealand's Covid activity stayed low, though they are experiencing their worst Flu season in several years.
With the UK Flu season likely starting a bit earlier this year, now's the time to get vaccinated. Free Flu vaccinations for those eligible will be available from Oct 1, 2026. Further details can be found at the following links - England, Scotland (invitation letter required), Wales, and Northern Ireland.
The UK's Autumn 2026 Covid Booster campaign also starts on Oct 1 and details of who is is eligible and how to arrange a vaccination can be found at the following links - England, Scotland, Wales, and Northern Ireland (not presently available).
As always, it's important to remember that the risk of hospitalisation from Covid increases significantly with age and for the clinically vulnerable. Therefore, it is important to take appropriate measures such as self-isolating when experiencing Covid symptoms and enhancing ventilation or wearing masks whenever possible.
Status of main respiratory diseases in England.
UKHSA have moved to publishing the Flu and COVID-19 surveillance reports fortnightly over the summer so data is only available from the Covid Dashboard this week.
This section starts with the latest data on test positivity rates for Covid in England. It's important to note that positivity is different from prevalence, which reflects the overall percentage of Covid cases in the general population. Appendix 1 offers a more detailed explanation of the distinction.
The following chart shows the test positivity rate published on the Covid dashboard for all Covid tests taken mapped against the UKHSA activity thresholds. The thresholds are based on the historical trend for Covid test positivity and, consequently, represent a relative risk. More details on this approach can be found in the Guide to Covid Surveillance Metrics.
The chart shows that the test positivity rate continues to increase and is just below the low level of activity threshold, indicating a low but increasing level of risk.
The next chart shows that positivity rates for all tests carried out differ between regions. In particular, rates are now rising fastest in the West Midland which, along with London and Yorkshire & Humberside, is within the low level of activity levels. Meanwhile rates stayed well within baseline levels in the East of England.
Scotland weekly hospital admissions and test positivity
Public Health Scotland is now publishing weekly data on Covid activity, but the Viral Respiratory Diseases in Scotland surveillance report will only be issued monthly until October 2026.
The latest edition of the report published this week, confirms that during the reporting period Aug 10 to Sep 6 , 2026 all respiratory disease indicators for Covid, Flu and RSV remained at baseline activity. However, Covid test positivity increased to an average of 3.7% across this period in community surveillance, up from 1.3%. In laboratory surveillance, activity remained at baseline despite case numbers doubling from 65 to 128. This shows a similar trend to the same time last year, but at lower levels overall. The XFG variant accounted for the majority (61%) of detections in the most recent sequencing data available.
The following panel chart presents this weeks data for Covid levels in wastewater in blue, weekly Covid test positivity shown in red, Covid hospital admissions depicted in orange, and beds occupied by Covid patients in brown.
All key indicators of Covid activity fell slightly this week, indicating that this will be a smaller wave than seen previously. For example, the test positivity rate fell to 3.9% this week from 4.1% the previous week, even though it had nearly doubled in the weeks before.
The final chart in this section compares the test positivity rates for hospital patients with respiratory symptoms for Covid, Flu, and RSV. Covid positivity rates continued to fall and RSV rates remained stable and below baseline levels. However, Flu rates are increasing slowly but earlier than in previous years, suggesting the Flu season may be starting sooner this year.
Wales Covid hospital admissions.
The following chart provides the latest trend for weekly hospital admissions for the main respiratory viruses in Wales up to week ending Sep 13, 2026.
This week, there were only four Covid hospital admissions in Wales. Flu admissions stayed a bit higher and are above those seen at the same time last year, while there were no hospitalisations for RSV reported.
Flu and RSV are currently well below baseline and have dropped to out-of-season levels. As a result, publication of the weekly Acute Respiratory Infection Report for Wales is on hold and will not resume until the 2026-27 season.
Status of main respiratory diseases in Northern Ireland.
Public Health Northern Ireland publish a respiratory surveillance report covering Covid activity which is published every two weeks over the summer period. There was no update published this week. The latest report covers data through to the week ending Sep 6, 2026 and the chart below highlights the test positivity rates for Covid, Flu, and RSV.
Covid test positivity and other surveillance indicators increased slightly but remained at low levels. Flu and RSV activity levels remained low and stable across all indicators.
Covid Activity in Other Countries.
This section reviews the latest Covid trends in Europe and North America together with Hong Kong, Singapore and New Zealand. In all countries across these regions, activity remains at very low levels apart from Hong Kong and Singapore which are experiencing higher levels of Covid activity.
The following chart shows the latest levels of Covid up to week ending Sep 3, 2026 as measured by monitoring wastewater in a number of European countries that still publish this information.
This week, Covid levels in wastewater continued to rise across most European countries still sharing this data but still remained low.
Charts for the USA were be updated on Friday, Sep 18 to reflect the latest information.
As of the week ending Sep 12, 2026, Covid activity in the USA has plateaued, indicating that the risk remains low in most states, and those states in the South and West which previously had higher levels of activity are starting to see falling levels.
The following chart shows the weekly trend for the national key Covid indicators covering wastewater activity levels, percent of emergency department visits due to Covid, test positivity, and the hospital admission rate in the USA.
The panel chart shows that the key indicators of Covid activity have remained broadly unchanged for the week ending Sep 12, 2026, and for most measures are at low levels although test positivity remained moderately high.
Wastewater analysis for week ending Sep 12, 2026 showed that Covid levels are low in many states as illustrated in the following map. Activity is at a moderate level in states in the West regions. Texas activity levels increased to very high this week, but but other measures show that levels are falling.
Each state is coloured based on activity levels, ranging from very high (dark red) to very low (light green), with grey indicating no data available. States with increasing activity levels are marked with cross-hatching.
The final chart for the USA presents the Covid trends by state as estimated by the CDC. Most states are showing a declining trend or no change. This week there are just 20 states showing a growing trend compared to 30 in the previous week.
A reminder that the trend represents the direction of activity only and does not indicate the level of activity. Consequently. this map should be used in conjunction with other data like the percent of Emergency Department visits due to Covid. This information is available by hovering your cursor over any state.
In Canada, data for the week ending Sep 5, 2026, shows that Covid wastewater levels stayed at moderate levels, although levels in the western provinces were high. The latest weekly Canadian respiratory virus surveillance report noted a slight rise in Covid test positivity to 2.3% from 1.7% in the previous week, while Flu A, Flu B and RSV activity was at baseline levels.
The following chart displays the key Covid indicators for Hong Kong up to the week ending Sep 12, 2026. All key indicators of Covid activity stayed low this week, indicating that the recent wave has come to an end.
In contrast, the latest data up to week ending Sep 6, 2026 showed that New Zealand did not see a wave with Covid levels in wastewater remaining relatively low, while Covid cases stayed at very low numbers.
However, New Zealand has seen it's worst Flu season for several years. According to New Zealand's Respiratory Illness dashboard, Flu hospital admissions hit a peak of 9.5 per 100,000 people for the week ending Aug 30, 2026. Although it has now fallen to 5.3 per 100,000 for week ending Sep 13, 2026, this is still higher than any peak for the past 5 years.
In conclusion
Although the amount of data currently being published is reduced, the information available for all home nations show that Covid activity is very low. Flu activity has fallen from its recent peak and is now at baseline out-of-season levels.
Covid levels in wastewater is also very low across European countries. In the USA, Covid activity has stayed at very low levels, except in a few states. Flu A activity in both the USA and Canada have dropped to low levels.
As always, if you have any comments on this Covid Situation Report or suggestions for topics to cover, please post a message below.
Thanks for reading Seeing The Forest for the Trees! Subscribe for free to receive new posts and support my work.
Appendix 1. Test positivity rates and prevalence
Positivity rates are derived from the results of hospital laboratory tests conducted on patients exhibiting symptoms of respiratory diseases. Test positivity is the percentage of patients who test positive for Covid of the total number of patients tested. Since the individuals tested for this measure are not a representative sample of the general population it differs from prevalence, which is derived from a representative sample of the population.
This report belongs to a weekly series summarising the Covid situation across the UK's home nations and other countries.
Thanks for reading Seeing The Forest for the Trees! Subscribe for free to receive new posts and support my work.
This week's report highlights the latest trends in respiratory illness activity across England, with updated figures for Scotland, Wales, and Northern Ireland. It also shares recent Covid levels in selected countries in Europe, North America, and Asia.
Charts for the USA were updated on Friday, Sep 11 to reflect the latest published data.
Summary.
This week, Covid activity across the UK shows a mixed picture. Covid indicators in England have once more risen slightly albeit from low levels, suggesting that while the risk remains low, it is on the rise. In contrast Covid activity in Scotland has stopped increasing and may have peaked. Meanwhile activity in Wales and Northern Ireland remains low.
In England, test positivity for all Covid tests undertaken increased slightly but stayed below baseline levels. However, there are regional differences with London increasing to the highest of all regions and is again above baseline levels.
This week, all key Covid indicators in Scotland stopped rising this week and may have plateaued, suggesting that this is likely to be a smaller wave than seen previously
This week, there were only four Covid hospital admissions in Wales. Flu admissions stayed a bit higher, while RSV hospitalisations remained stable and very low.
This weeks report showed Covid activity in Northern Ireland increased slightly across all surveillance indicators, but remained low.
Covid levels in wastewater increased slowly this week across all European countries still reporting data, but overall they are still very low.
For the week ending Sep 5, overall Covid activity in the U.S.A. stopped increasing. with most states still have low activity levels. However, many states continue to see increased activity especially in the West and South. In particular, Nevada and Mississippi are experiencing very high activity.
This week, hospital Covid measures in Hong Kong continued to fall, confirming that the recent wave is over. In contrast, New Zealand's Covid activity stayed low, though they are experiencing their worst Flu season in several years.
As always, it's important to remember that the risk of hospitalisation from Covid increases significantly with age and for the clinically vulnerable. Therefore, it is important to take appropriate measures such as self-isolating when experiencing Covid symptoms and enhancing ventilation or wearing masks whenever possible.
Status of main respiratory diseases in England.
UKHSA have moved to publishing the Flu and COVID-19 surveillance reports fortnightly over the summer so there is limited data available this week.
This section starts with the latest data on test positivity rates for Covid in England. It's important to note that positivity is different from prevalence, which reflects the overall percentage of Covid cases in the general population. Appendix 1 offers a more detailed explanation of the distinction.
The following chart shows the test positivity rate for all Covid tests taken mapped against the UKHSA activity thresholds. The thresholds are based on the historical trend for Covid test positivity and, consequently, represent a relative risk. More details on this approach can be found in the Guide to Covid Surveillance Metrics.
The chart shows that the test positivity rate continues to increase slowly but remains below the baseline level, indicating a low but increasing level of risk. The rate is highest at 6.5% for individuals aged 85 and older, and drops to a low of 2.0% for those between 5 and 14 years old.
The next chart shows that positivity rates for all tests carried out differ between regions. In particular, rates are rising fastest in London, are again rising in the West Midlands, while rates stayed low in the South West.
The following chart highlights two key indicators of Covid in hospitals: weekly test positivity rates among patients with respiratory issues and hospital admission rates.
Both of these hospital indicators for Covid activity increased slightly but remained at low levels, indicating a low but rising risk.
The final chart in this section compares the positivity rate for hospital patients for the main respiratory viruses, with Covid, Flu and RSV positivity rates remaining low, even with slight increases for Covid and Flu. While the Rhinovirus rate is higher than that of other respiratory viruses, it still remains within baseline levels.
Scotland weekly hospital admissions and test positivity
Public Health Scotland is now publishing weekly data on Covid activity, but the Viral Respiratory Diseases in Scotland surveillance report will only be issued monthly until October 2026.
The latest edition of the report published this week, confirms that during the reporting period Aug 10 to Sep 6 , 2026 all respiratory disease indicators for Covid, Flu and RSV remained at baseline activity. However, Covid test positivity increased to an average of 3.7% across this period in community surveillance, up from 1.3%. In laboratory surveillance, activity remained at baseline despite case numbers doubling from 65 to 128. This shows a similar trend to the same time last year, but at lower levels overall. The XFG variant accounted for the majority (61%) of detections in the most recent sequencing data available.
The following panel chart presents this weeks data for Covid levels in wastewater in blue, weekly Covid test positivity shown in red, Covid hospital admissions depicted in orange, and beds occupied by Covid patients in brown.
All key indicators of Covid activity stopped rising this week and may have plateaued, suggesting that this is likely to be a smaller wave than seen previously. For example, the test positivity rate fell to 4.5% this week from 5.1% the previous week, even though it had nearly doubled in the weeks before.
The final chart in this section compares the test positivity rates for hospital patients with respiratory symptoms for Covid, Flu, and RSV. Covid positivity rates have started to fall while Flu and RSV rates remained stable and below baseline levels.
Wales Covid hospital admissions.
The following chart provides the latest trend for weekly hospital admissions for the main respiratory viruses in Wales up to week ending Sep 6, 2026.
Starting this week, Public Health Wales has updated its reporting method, and hospital admissions now include patients who tested positive at the point of care using non-PCR tests. As a result, some weeks are showing slightly higher numbers than in previous situation reports.
This week, there were only four Covid hospital admissions in Wales. Flu admissions stayed a bit higher, while RSV hospitalisations remained stable and very low.
Flu and RSV are currently well below baseline and have dropped to out-of-season levels. As a result, publication of the weekly Acute Respiratory Infection Report for Wales is on hold and will not resume until the 2026-27 season.
Status of main respiratory diseases in Northern Ireland.
Public Health Northern Ireland publish a respiratory surveillance report covering Covid activity which is published every two weeks over the summer period. This weeks report covers data through to the week ending Sep 6, 2026 and the chart below highlights the test positivity rates for Covid, Flu, and RSV.
Covid test positivity and other surveillance indicators increased slightly but remained at low levels. Flu and RSV activity levels remained low and stable across all indicators.
Covid Activity in Other Countries.
This section reviews the latest Covid trends in Europe and North America together with Hong Kong, Singapore and New Zealand. In all countries across these regions, activity remains at very low levels apart from Hong Kong and Singapore which are experiencing higher levels of Covid activity.
The following chart shows the latest levels of Covid up to week ending Sep 3, 2026 as measured by monitoring wastewater in a number of European countries that still publish this information.
This week, Covid levels in wastewater continued to rise but remained low across all European countries still sharing this data.
Charts for the USA were updated on Friday, Sep 11 to reflect the latest information.
As of the week ending Sep 5, 2026, Covid activity in the USA has risen, suggesting that while the risk remains low in many states, it is on the rise especially in the West region which has the highest level as measured by wastewater.
The following chart shows the weekly trend for the national key Covid indicators covering wastewater activity levels, percent of emergency department visits due to Covid, test positivity, and the hospital admission rate in the USA.
The panel chart shows that the key indicators of Covid activity stopped rising for the week ending Sep 5, 2026, and for most measures are at low levels although test positivity stayed at moderately high levels.
Wastewater analysis for week ending Sep 5, 2026 showed that Covid levels are low but increasing in many states as illustrated in the following map. Activity is at a moderate level in states in the West and South regions. Texas activity levels fell this week, but Nevada and Mississippi are now experiencing very high levels of activity.
Each state is coloured based on activity levels, ranging from very high (dark red) to very low (light green), with grey indicating no data available. States with increasing activity levels are marked with cross-hatching.
The final chart for the USA presents the Covid trends by state as estimated by the CDC. Most states are showing a growing trend but it is important to note that the trend represents the direction of activity only and does not indicate the level of activity. Consequently. this map should be used in conjunction with other data like the percent of Emergency Department visits due to Covid. This information is available by hovering your cursor over any state.
In Canada, data for the week ending Aug 29, 2026, shows that Covid wastewater levels stayed moderately low, although levels in the western provinces were high. The latest weekly Canadian respiratory virus surveillance report noted a slight rise in Covid test positivity to 2.3% from 1.7% in the previous week, while Flu A, Flu B and RSV activity was at baseline levels
The following chart displays the key Covid indicators for Hong Kong up to the week ending Sep 5, 2026. All key indicators of Covid activity stayed low this week, indicating that the recent wave has come to an end.
In contrast, up to week ending Sep 6, 2026, New Zealand did not see a wave with Covid levels in wastewater remaining relatively low, while Covid cases stayed at very low numbers.
However, New Zealand has seen it's worst Flu season for several years. According to New Zealand's Respiratory Illness dashboard, Flu hospital admissions last week hit a peak of 9.5 per 100,000 people but have since dropped to 7.2 per 100,000.
In conclusion
Although the amount of data currently being published is reduced, the information available for all home nations show that Covid activity is very low. Flu activity has fallen from its recent peak and is now at baseline out-of-season levels.
Covid levels in wastewater is also very low across European countries. In the USA, Covid activity has stayed at very low levels, except in a few states. Flu A activity in both the USA and Canada have dropped to low levels.
As always, if you have any comments on this Covid Situation Report or suggestions for topics to cover, please post a message below.
Thanks for reading Seeing The Forest for the Trees! Subscribe for free to receive new posts and support my work.
Appendix 1. Test positivity rates and prevalence
Positivity rates are derived from the results of hospital laboratory tests conducted on patients exhibiting symptoms of respiratory diseases. Test positivity is the percentage of patients who test positive for Covid of the total number of patients tested. Since the individuals tested for this measure are not a representative sample of the general population it differs from prevalence, which is derived from a representative sample of the population.
Covid Situation Report: Sep 3, 2026 [ 03-Sep-26 4:57pm ]This report belongs to a weekly series summarising the Covid situation across the UK's home nations and other countries.
Thanks for reading Seeing The Forest for the Trees! Subscribe for free to receive new posts and support my work.
This week's report highlights the latest trends in respiratory illness activity across England, with updated figures for Scotland, and Wales. It also shares recent Covid levels in selected countries in Europe, North America, and Asia.
Charts for the USA will be updated on Friday, Sep 4 to reflect the latest published data.
Summary.
This week, key Covid indicators in England and Scotland have once more risen slightly albeit from low levels, suggesting that while the risk remains low, it is on the rise. In contrast Covid activity in Wales fell and is low.
In England, test positivity for all Covid tests undertaken increased slightly and stayed below baseline levels. However, there are regional differences with London increasing to the highest of all regions and had now risen above baseline levels.
This week, all key Covid indicators in Scotland continued to increase, though they remained relatively low, indicating that while the risk is low, it is rising.
Covid hospital admissions in Wales dropped this week and, for the first time, there were no new cases reported. Flu admissions increased but stayed low while RSV hospitalisations remained very low.
This latest report available from last week showed Covid activity in Northern Ireland increased across all surveillance indicators, but still remained low.
Covid levels in wastewater increased slowly this week across all European countries still reporting data, but overall they're still very low.
For the week ending Aug 22, Covid activity in the USA saw another rise, showing that while the current risk remains low in many states, it's on the rise, and is high in Texas and Mississippi.
This week, hospital Covid measures in Hong Kong continued to fall, confirming that the recent wave is over. Singapore also saw falling Covid test positivity and is now low, while the latest New Zealand Covid activity remained low.
As always, it's important to remember that the risk of hospitalisation from Covid increases significantly with age and for the clinically vulnerable. Therefore, it is important to take appropriate measures such as self-isolating when experiencing Covid symptoms and enhancing ventilation or wearing masks whenever possible.
Status of main respiratory diseases in England.
UKHSA have moved to publishing the Flu and COVID-19 surveillance reports fortnightly over the summer so there is limited data available this week.
This section starts with the latest data on test positivity rates for Covid in England. It's important to note that positivity is different from prevalence, which reflects the overall percentage of Covid cases in the general population. Appendix 1 offers a more detailed explanation of the distinction.
The following chart shows the test positivity rate published on the Covid dashboard for all Covid tests taken mapped against the UKHSA activity thresholds. The thresholds are based on the historical trend for Covid test positivity and, consequently, represent a relative risk. More details on this approach can be found in the Guide to Covid Surveillance Metrics.
The chart shows that the test positivity rate continues to increase slowly but remains well below the baseline level, indicating a low but increasing level of risk.
The final chart in this section shows that positivity rates for all tests carried out differ between regions. In particular, rates are rising fastest in London, are again rising in the West Midlands, while rates stayed low in the South West and North East.
Scotland weekly hospital admissions and test positivity
Public Health Scotland is now publishing weekly data on Covid activity, but the Viral Respiratory Diseases in Scotland surveillance report will only be issued monthly until October 2026.
The latest edition of the report published on Aug 13, confirms that during the reporting period Jul 13 to Aug 9 , 2026 all respiratory disease indicators for Covid, Flu and RSV remained at baseline activity. Both Adenovirus and Parainfluenza which reached medium activity levels in the week ending Jun 22, 2026, have now returned to baseline levels. Finally, although overall rates were low in the community, GP surveillance found that rhinovirus, parainfluenza and adenovirus were the most commonly identified pathogens.
The following panel chart presents this weeks data for Covid levels in wastewater in blue, weekly Covid test positivity shown in red, Covid hospital admissions depicted in orange, and beds occupied by Covid patients in brown.
All key indicators of Covid activity again increased this week but at a slower pace, suggesting that this is likely to be a smaller wave than seen previously. For example, the test positivity rate rose to 5.1% this week from 4.5% the previous week, even though it had nearly doubled the week before.
The final chart in this section compares the test positivity rates for hospital patients with respiratory symptoms for Covid, Flu, and RSV. Flu and RSV positivity rates remained below baseline levels, but Covid rates have risen once again, albeit more slowly.
Wales Covid hospital admissions.
The following chart provides the latest trend for weekly hospital admissions for the main respiratory viruses in Wales up to week ending Aug 30, 2026.
For the first time since the start of the pandemic there were no Covid hospital admissions in Wales. However Flu admissions increased while RSV hospitalisations remained stable and very low.
Flu and RSV are currently well below baseline and have dropped to out-of-season levels. As a result, publication of the weekly Acute Respiratory Infection Report for Wales is on hold and will not resume until the 2026-27 season.
Status of main respiratory diseases in Northern Ireland.
Public Health Northern Ireland publish a respiratory surveillance report covering Covid activity which is published every two weeks over the summer period. There was no update provided this week. The latest available report covers data through to the week ending Aug 23, 2026 and the chart below highlights the test positivity rates for Covid, Flu, and RSV.
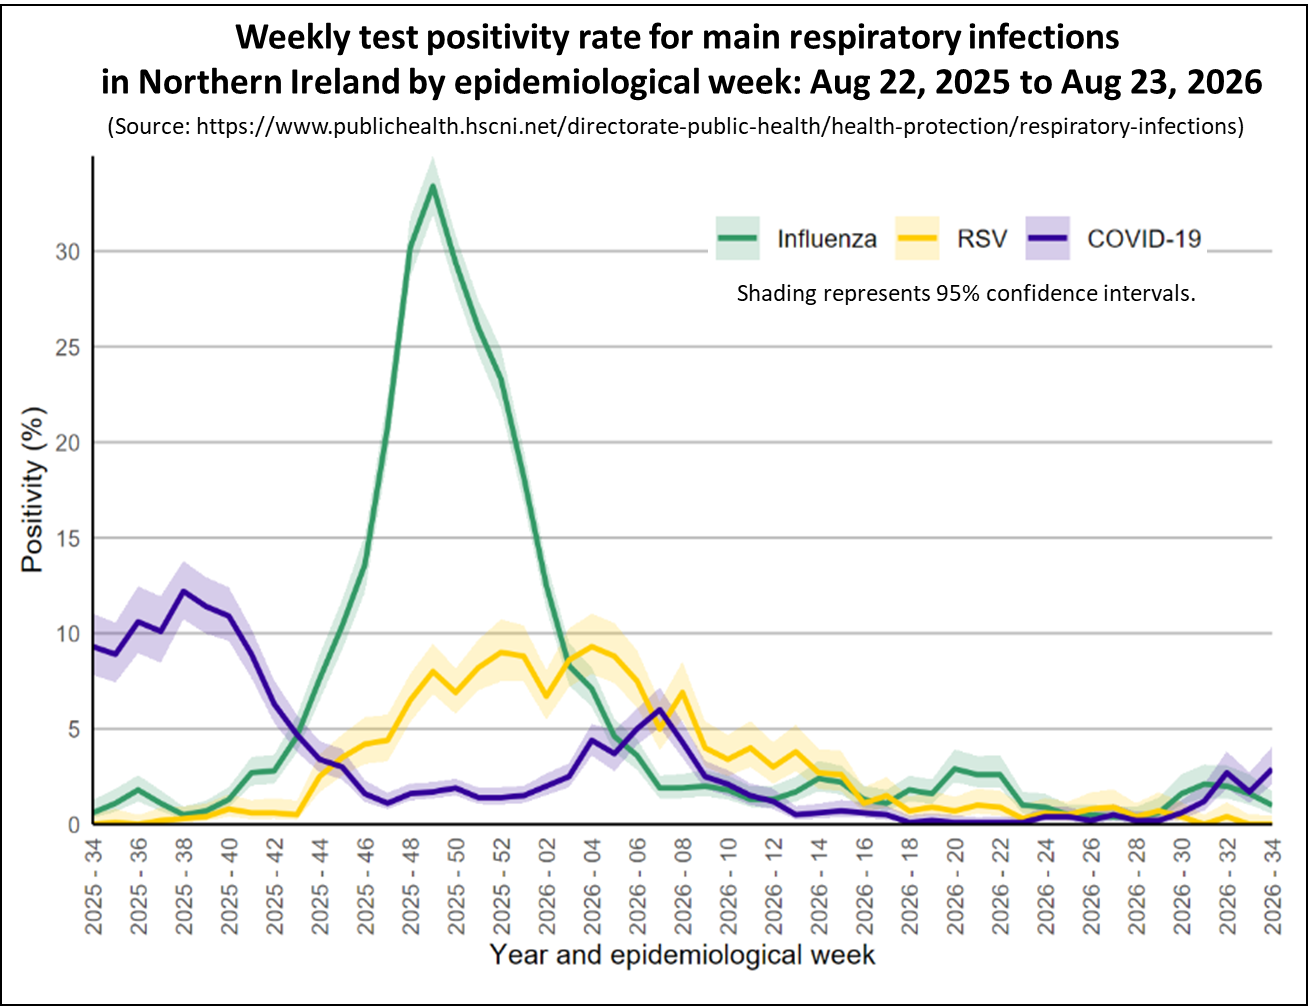
Covid test positivity and other surveillance indicators increased slightly but remained at low levels. Flu and RSV activity levels remained low and stable across all indicators.
Covid Activity in Other Countries.
This section reviews the latest Covid trends in Europe and North America together with Hong Kong, Singapore and New Zealand. In all countries across these regions, activity remains at very low levels apart from Hong Kong and Singapore which are experiencing higher levels of Covid activity.
The following chart shows the latest levels of Covid up to week ending Aug 27, 2026 as measured by monitoring wastewater in a number of European countries that still publish this information.
This week, Covid levels in wastewater are starting to rise but remained low across all European countries still sharing this data.
Charts for the USA was updated on Friday, Sep 4 to reflect the latest information.
As of the week ending Aug 22, 2026, Covid activity in the USA has risen, suggesting that while the risk remains low in many states, it is on the rise. and is high in Texas and Mississippi.
The following chart shows the weekly trend for the national key Covid indicators covering wastewater activity levels, percent of emergency department visits due to Covid, test positivity, and the hospital admission rate in the USA.
The panel chart shows that Covid activity again increased slightly for the week ending Aug 22, 2026 as measured by wastewater. However, key hospital indicators for Covid have risen more quickly, with test positivity now reaching moderate levels.
Wastewater analysis for week ending Aug 22, 2026 showed that Covid levels are low or very low in most states as illustrated in the following map. Activity is rising fastest in states in the West and South regions
Each state is coloured based on activity levels, ranging from very high (dark red) to very low (light green), with grey indicating no data available. States with increasing activity levels are marked with cross-hatching.
In Canada, data for the week ending Aug 15, 2026, shows that Covid wastewater levels stayed very low, although there was a slight rise this week. Flu A and RSV activity stayed very low, while Flu B levels have fallen from their recent peak and remain at low levels.
The following chart displays the key Covid indicators for Hong Kong up to the week ending Aug 29, 2026. All key indicators of Covid activity fell this week, indicating that the recent wave has come to an end.
The next chart presents the weekly Covid positivity rate for tests carried out on patients with respiratory symptoms in Singapore up to week ending Aug 29, 2026. It shows that Covid activity peaked in May, consistent with the previous two years, and although has now fallen to low levels.
In contrast, up to week ending Aug 23, 2026, New Zealand Covid levels in wastewater are falling slowly and are relatively low, while Covid cases stayed at very low numbers.
In conclusion
Although the amount of data currently being published is reduced, the information available for all home nations show that Covid activity is very low. Flu activity has fallen from its recent peak and is now at baseline out-of-season levels.
Covid levels in wastewater is also very low across European countries. In the USA, Covid activity has stayed at very low levels, except in a few states. Flu A activity in both the USA and Canada have dropped to low levels.
As always, if you have any comments on this Covid Situation Report or suggestions for topics to cover, please post a message below.
Thanks for reading Seeing The Forest for the Trees! Subscribe for free to receive new posts and support my work.
Appendix 1. Test positivity rates and prevalence
Positivity rates are derived from the results of hospital laboratory tests conducted on patients exhibiting symptoms of respiratory diseases. Test positivity is the percentage of patients who test positive for Covid of the total number of patients tested. Since the individuals tested for this measure are not a representative sample of the general population it differs from prevalence, which is derived from a representative sample of the population.
This report belongs to a weekly series summarising the Covid situation across the UK's home nations and other countries.
Thanks for reading Seeing The Forest for the Trees! Subscribe for free to receive new posts and support my work.
This week's report highlights the latest trends in respiratory illness activity across England, with updated figures for Scotland, Wales, and Northern Ireland. It also shares recent Covid levels in selected countries in Europe, North America, and Asia.
Charts for the USA will be updated on Friday, Aug 28 to reflect the latest published data.
Summary.
This week, key Covid indicators in England, Scotland, Wales, and Northern Ireland have risen slightly again from low levels, suggesting that while the risk remains low, it is on the rise.
In England, test positivity for all Covid tests undertaken increased, particularly in the Yorkshire & Humber and London regions, but stayed below baseline levels.
This week, all key Covid indicators in Scotland increased, though they remained relatively low, indicating that while the risk is low, it is rising.
Covid hospital admissions in Wales fell this week, with just 5 cases reported. Flu and RSV hospitalisations have stayed very low.
This week, Covid activity in Northern Ireland increased across all surveillance indicators, but still remained low.
Covid levels in wastewater increased slightly this week in some European countries, but overall they're still very low.
For the week ending Aug 15, COVID activity in the USA saw another rise, showing that while the current risk remains low in most states, it's on the rise, especially in the West region.
This week, hospital Covid measures in Hong Kong continued to fall, confirming that the recent wave is over. Singapore also saw falling Covid test positivity and is now relatively low, while the latest New Zealand Covid activity remained low.
As always, it's important to remember that the risk of hospitalisation from Covid increases significantly with age and for the clinically vulnerable. Therefore, it is important to take appropriate measures such as self-isolating when experiencing Covid symptoms and enhancing ventilation or wearing masks whenever possible.
Status of main respiratory diseases in England.
UKHSA have moved to publishing the Flu and COVID-19 surveillance reports fortnightly over the summer so there is limited data available this week.
This section starts with the latest data on test positivity rates for Covid in England. It's important to note that positivity is different from prevalence, which reflects the overall percentage of Covid cases in the general population. Appendix 1 offers a more detailed explanation of the distinction.
The following chart shows the test positivity rate for all Covid tests taken mapped against the UKHSA activity thresholds. The thresholds are based on the historical trend for Covid test positivity and, consequently, represent a relative risk. More details on this approach can be found in the Guide to Covid Surveillance Metrics.
The chart shows that the test positivity rate continues to increase slowly but remains well below the baseline level, indicating a low but increasing level of risk. The rate is highest at 5.1% for those aged 25 to 44 years and lowest at 1.9% for those aged 45 to 54.
The following chart highlights two key indicators of Covid in hospitals: weekly test positivity rates among patients with respiratory issues and hospital admission rates.
Both of these hospital indicators for Covid activity increased slightly but remained at low levels, indicating a low but rising risk.
The next chart shows that positivity rates for all tests carried out differ between regions. In particular, rates are rising fastest in the Yorks & Humber and London, have fallen in the West Midlands, while rates stayed low in the South West and North East.
The final chart in this section shows the positivity rate for hospital patients for the main respiratory viruses, with Covid, Flu and RSV positivity rates remained low, even with slight increases for Covid and Flu. While the Rhinovirus rate is higher than that of other respiratory viruses, it still remains within baseline levels.
Scotland weekly hospital admissions and test positivity
Public Health Scotland is now publishing weekly data on Covid activity, but the Viral Respiratory Diseases in Scotland surveillance report will only be issued monthly until October 2026.
The latest edition of the report published last week, confirms that during the reporting period Jul 13 to Aug 9 , 2026 all respiratory disease indicators for Covid, Flu and RSV remained at baseline activity. Both Adenovirus and Parainfluenza which reached medium activity levels in the week ending Jun 22, 2026, have now returned to baseline levels. Finally, although overall rates were low in the community, GP surveillance found that rhinovirus, parainfluenza and adenovirus were the most commonly identified pathogens.
The following panel chart presents this weeks data for Covid levels in wastewater in blue, weekly Covid test positivity shown in red, Covid hospital admissions depicted in orange, and beds occupied by Covid patients in brown.
All key indicators of Covid activity again increased this week, confirming that the next wave is on the way. In particular, the test positivity rate and hospital admission doubled in the past week.
The final chart in this section compares the test positivity rates for hospital patients with respiratory symptoms for Covid, Flu, and RSV. Flu and RSV positivity rates remained below baseline levels, but Covid rates have risen once again.
Wales Covid hospital admissions.
The following chart provides the latest trend for weekly hospital admissions for the main respiratory viruses in Wales up to week ending Aug 23, 2026.
Covid hospital admissions dropped this week to 5, down from 24 the week before. Flu and RSV hospitalisations remained very low.
Flu and RSV are currently well below baseline and have dropped to out-of-season levels. As a result, publication of the weekly Acute Respiratory Infection Report for Wales is on hold and will not resume until the 2026-27 season.
Status of main respiratory diseases in Northern Ireland.
Public Health Northern Ireland publish a respiratory surveillance report covering Covid activity which is published every two weeks over the summer period. The latest available report covers data through to the week ending Aug 23, 2026 and the chart below highlights the test positivity rates for Covid, Flu, and RSV.
Covid test positivity and other surveillance indicators increased slightly but remained at low levels. Flu and RSV activity levels remained low and stable across all indicators.
Covid Activity in Other Countries.
This section reviews the latest Covid trends in Europe and North America together with Hong Kong, Singapore and New Zealand. In all countries across these regions, activity remains at very low levels apart from Hong Kong and Singapore which are experiencing higher levels of Covid activity.
The following chart shows the latest levels of Covid up to week ending Aug 20, 2026 as measured by monitoring wastewater in a number of European countries that still publish this information.
This week, Covid levels in wastewater are starting to rise but remained low across all European countries still sharing this data.
Charts for the USA will be updated on Friday, Aug 28 to reflect the latest information.
As of the week ending Aug 15, 2026, Covid activity in the USA has risen, suggesting that while the risk remains low in most states, it is on the rise.
The following chart shows the weekly trend for the national key Covid indicators covering wastewater activity levels, percent of emergency department visits due to Covid, test positivity, and the hospital admission rate in the USA.
The panel chart shows that Covid activity is increasing slightly for the week ending Aug 15, 2026 as measured by wastewater. However, key hospital indicators for Covid have risen more quickly, with test positivity now reaching moderate levels.
Wastewater analysis for week ending Aug 15, 2026 showed that Covid levels are low or very low in most states as illustrated in the following map. Activity is rising fastest in states in the West and South regions
Each state is coloured based on activity levels, ranging from very high (dark red) to very low (light green), with grey indicating no data available. States with increasing activity levels are marked with cross-hatching.
In Canada, data for the week ending Aug 15, 2026, shows that Covid wastewater levels stayed very low, although there was a slight rise this week. Flu A and RSV activity stayed very low, while Flu B levels have fallen from their recent peak and remain at low levels.
The following chart displays the key Covid indicators for Hong Kong up to the week ending Aug 22, 2026. Although Covid levels in wastewater samples increased, the latest hospital surveillance data shows that the overall local activity of Covid has continued to fall indicating that the recent wave is nearly over.
The next chart presents the weekly Covid positivity rate for tests carried out on patients with respiratory symptoms in Singapore up to week ending Aug 22, 2026. It shows that Covid activity peaked in May, consistent with the previous two years, and although has now fallen to low levels.
In contrast, up to week ending Aug 23, 2026, New Zealand Covid levels in wastewater are falling and are now relatively low, while Covid cases stayed at very low numbers.
In conclusion
Although the amount of data currently being published is reduced, the information available for all home nations show that Covid activity is very low. Flu activity has fallen from its recent peak and is now at baseline out-of-season levels.
Covid levels in wastewater is also very low across European countries. In the USA, Covid activity has stayed at very low levels, except in a few states. Flu A activity in both the USA and Canada have dropped to low levels.
As always, if you have any comments on this Covid Situation Report or suggestions for topics to cover, please post a message below.
Thanks for reading Seeing The Forest for the Trees! Subscribe for free to receive new posts and support my work.
Appendix 1. Test positivity rates and prevalence
Positivity rates are derived from the results of hospital laboratory tests conducted on patients exhibiting symptoms of respiratory diseases. Test positivity is the percentage of patients who test positive for Covid of the total number of patients tested. Since the individuals tested for this measure are not a representative sample of the general population it differs from prevalence, which is derived from a representative sample of the population.


