
 Q&A: What is the Brazil-led 'deforestation roadmap'? [ 04-Nov-26 3:39pm ]
- What is a deforestation 'roadmap'?
- What does the roadmap say about reducing deforestation?
- Why did some countries not sign onto the roadmap at COP30?
- What are the barriers to implementing a deforestation roadmap?
On 3 November, the Brazilian presidency of the COP30 climate talks released its long-awaited "roadmap" on ending deforestation.
Ahead of the Belém summit, Brazilian president Luiz Inácio Lula da Silva made a call for a "roadmap" to halt and reverse deforestation.
Although this voluntary roadmap was outside the COP's official agenda, it snowballed into a rallying point at the "Amazon" COP.
By the end of the summit, 93 countries had signed on to the deforestation roadmap, committing to develop voluntary pathways to reverse forest loss and degradation by 2030.
The Brazilian presidency called on countries to describe what a pathway away from deforestation could look like, what challenges and support they needed.
This call was answered by 18 countries and four negotiating blocs that offered their inputs on the roadmap, along with scores of NGOs, research centres and other groups.
Now that the roadmap has been published, Carbon Brief explains where it came from, what it entails, why some did not sign on - and what's next.
What is a deforestation 'roadmap'?The "deforestation roadmap" was one of the signature announcements of the Brazilian presidency of the COP30 climate summit in Belém - albeit one that fell outside the official, negotiated outcomes.
Brazilian president Lula first proposed the deforestation and forest degradation roadmap, alongside one on the fossil fuel transition, at the leaders' summit in Belém a few days before COP30 began.
By the end of COP30, nearly 100 countries had expressed their support for such a roadmap. This includes the EU, with its 27 member states, as well as the 56-member Coalition for Rainforest Nations.
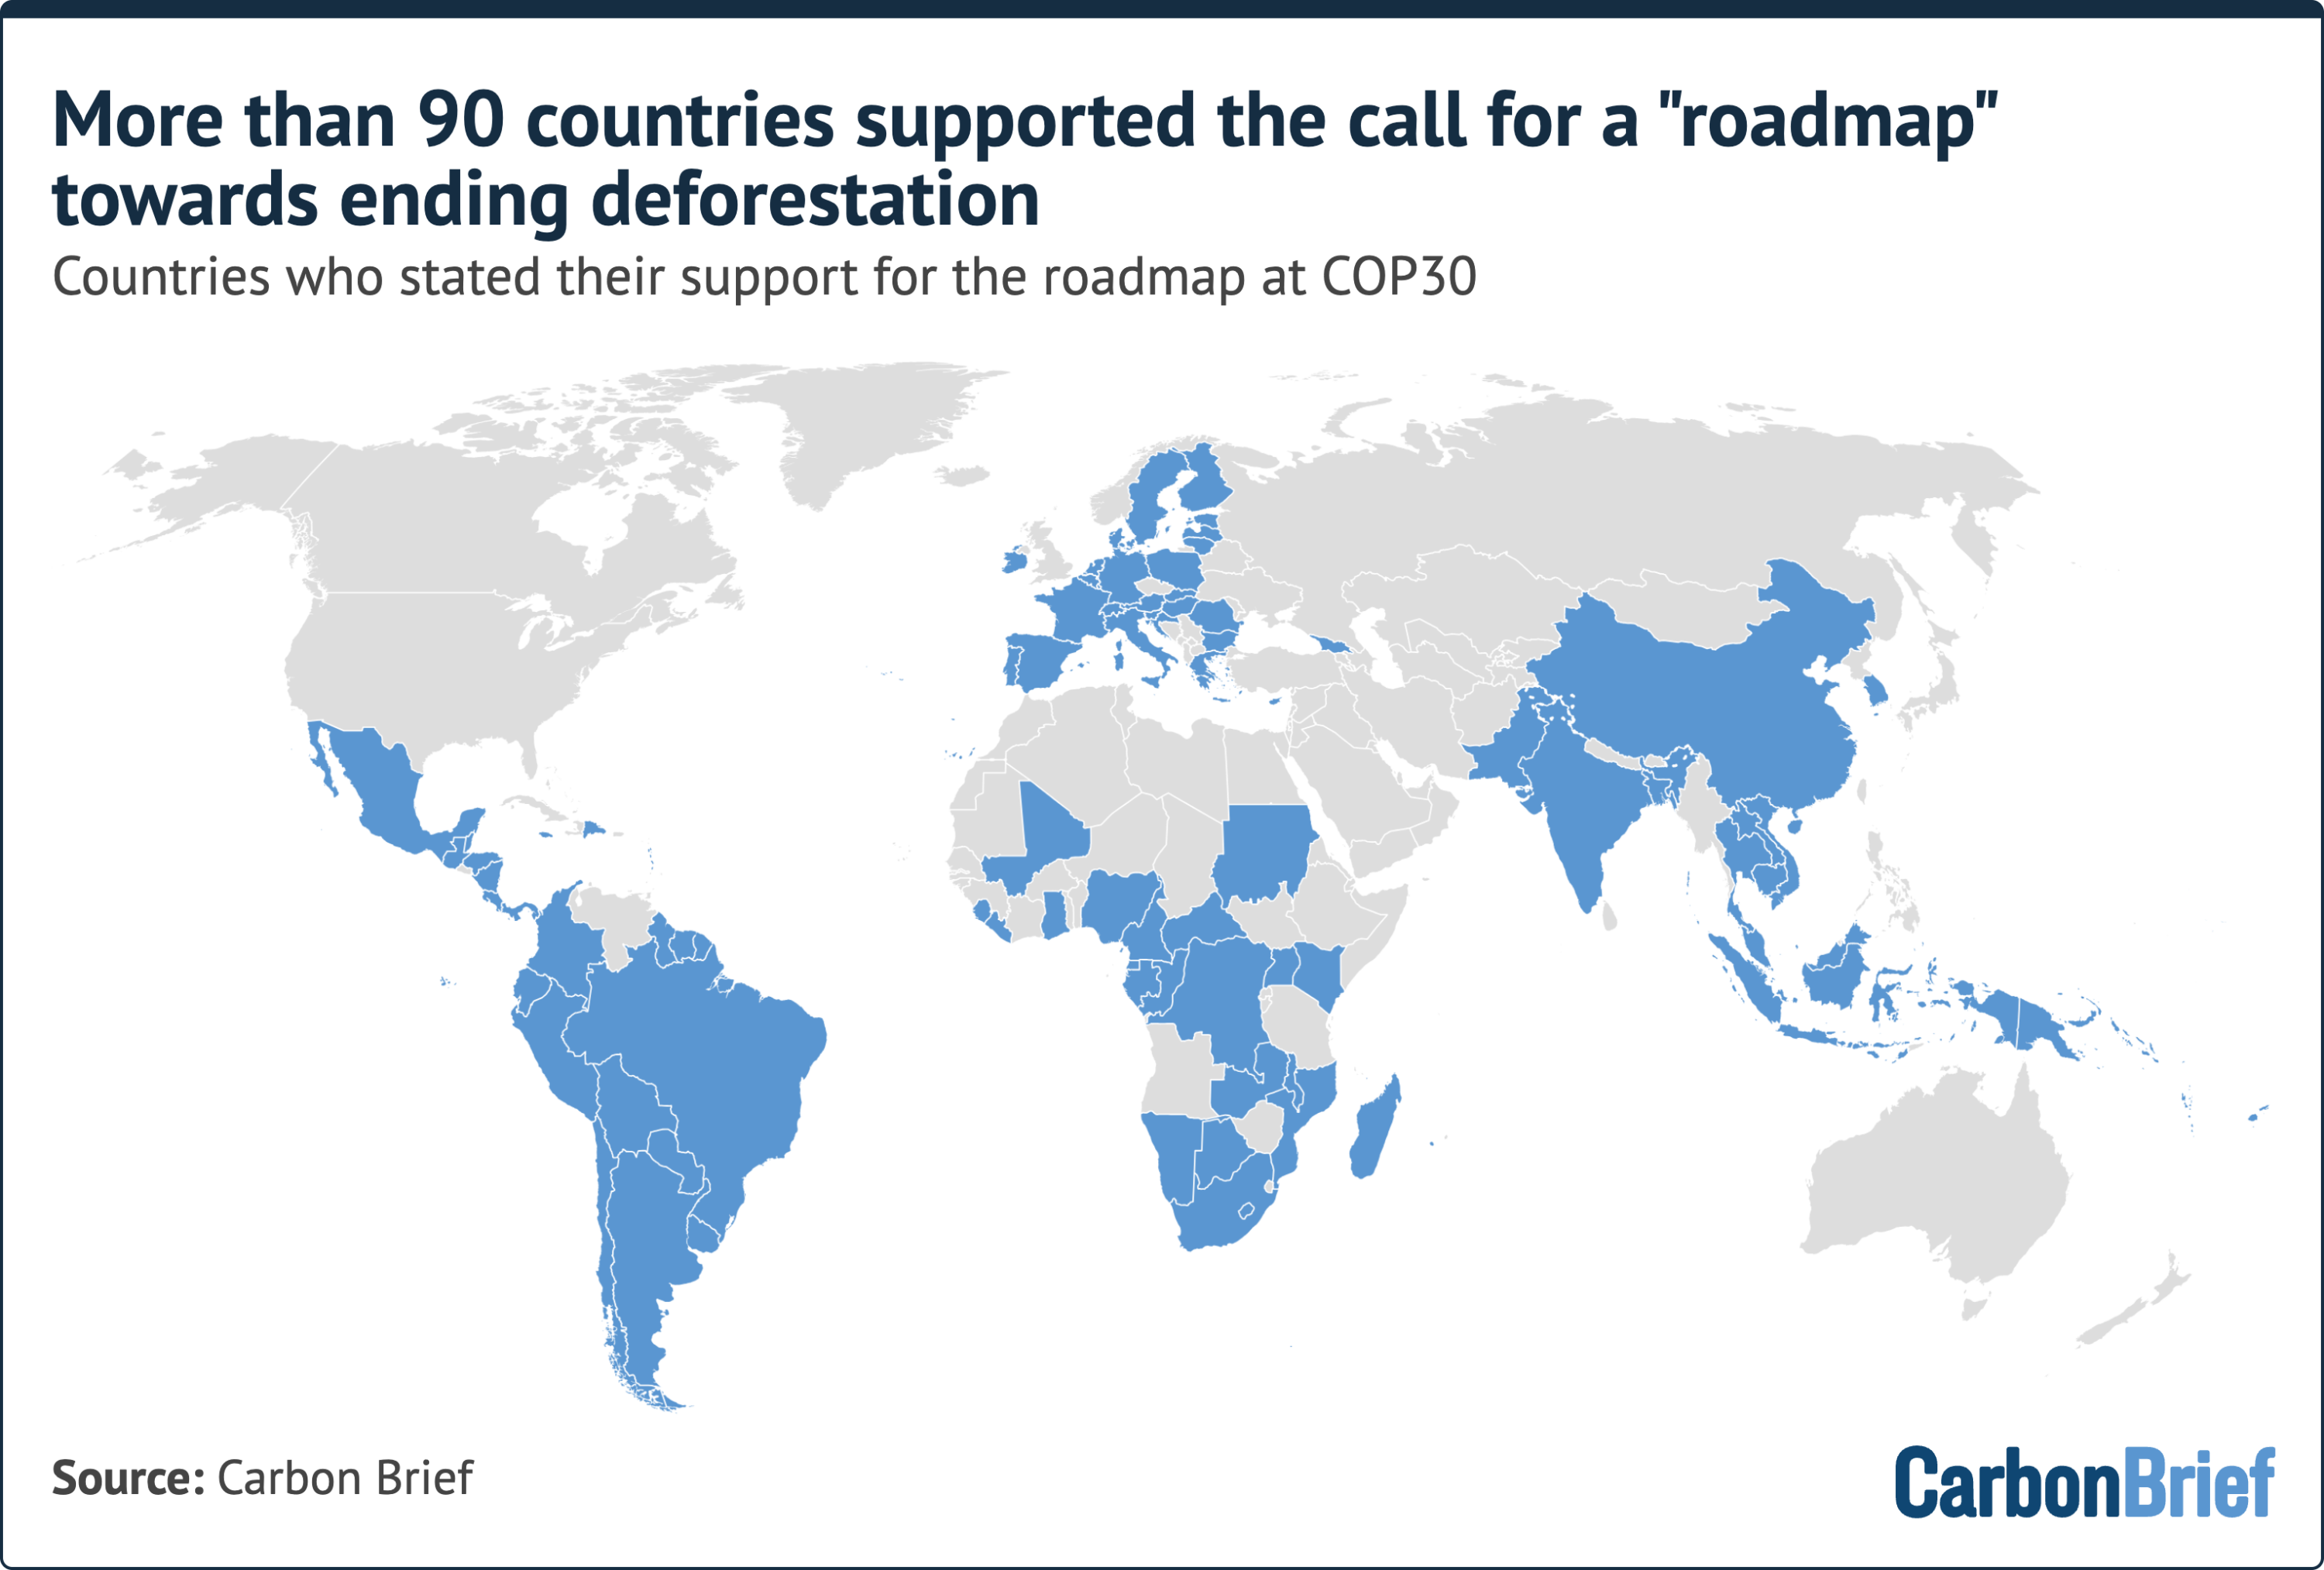 Map of countries that supported the call for a deforestation roadmap by the end of COP30. Source: Carbon Brief
However, this was still short of the 196 parties needed for consensus at a COP, meaning that, ultimately, the roadmap was not a formal outcome.
Instead, COP30 president André Corrêa do Lago announced during the closing plenary session that the presidency would work towards creating both deforestation and fossil-fuel phaseout roadmaps outside of the COP process.
The deforestation roadmap is the latest in a series of international pledges to put an end to forest loss.
In 2014, 39 countries pledged to end natural forest loss by 2030 at UN Climate Week, as part of the New York Declaration on Forests.
Seven years later, at COP26, more than 140 countries signed the Glasgow Leaders' Declaration on Forests and Land Use. The declaration stated that countries "commit to working collectively to halt and reverse forest loss and land degradation by 2030" - although conflict subsequently arose over what, exactly, countries had agreed to.
The objective of halting and reversing deforestation by 2030 was ultimately agreed in a negotiated text for the first time two years later, at COP28 in Dubai, where it was part of the global stocktake.
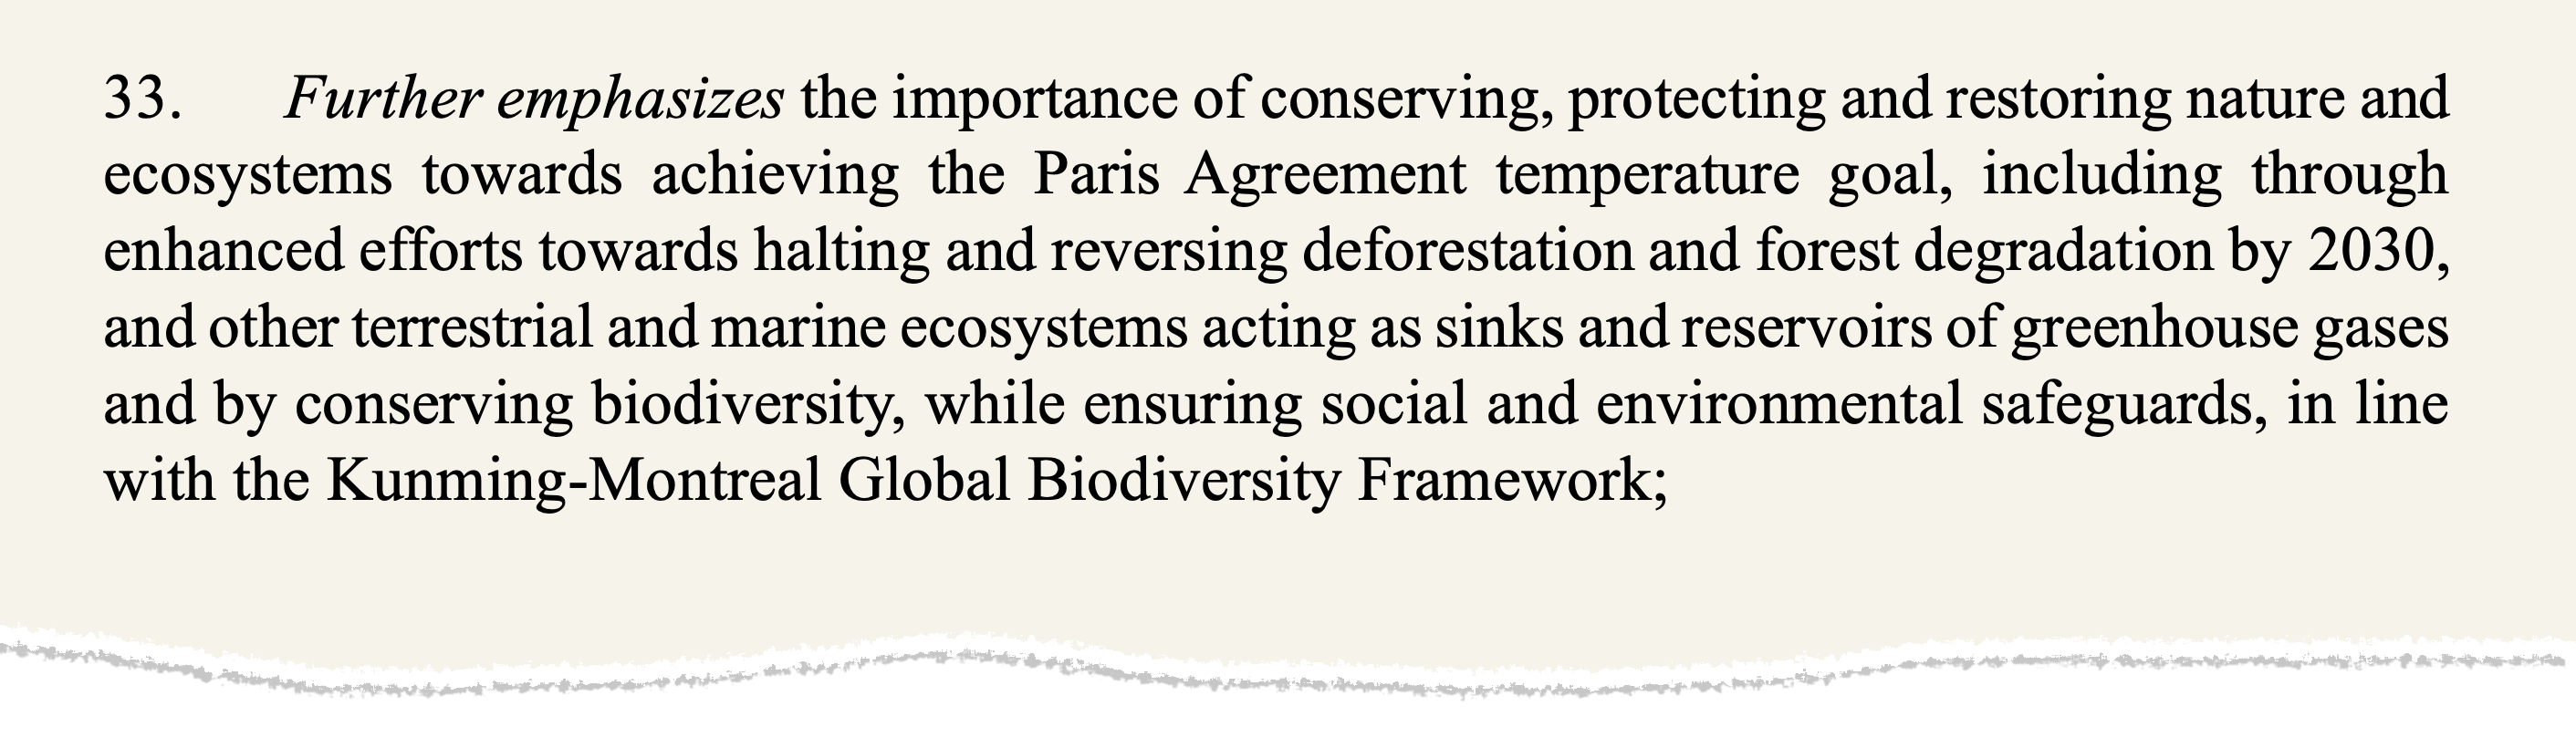 Paragraph 33 of the first global stocktake, which references halting deforestation by 2030. Source: UNFCCC
Unlike these previous pledges, the roadmap does not make any new commitments. It also does not "seek to reopen agreed decisions".
Instead, the roadmap's stated objective is to "translate forest-related outcomes into coordinated, country-led action while respecting different national circumstances, priorities and implementation challenges".
Following the conclusion of COP30, the presidency - along with the Climate Policy Initiative thinktank - began soliciting inputs from countries, civil society organisations, Indigenous peoples, academic researchers, the private sector and other groups.
(The Climate Policy Initiative was chosen to serve as the secretariat and technical partner to the roadmap process.)
The secretariat notes that it received more than 200 contributions following this invitation. However, just 18 of these came from countries, and four from blocs - the EU, the Coalition for Rainforest Nations, the Alliance of Small Island States (AOSIS) and the Least Developed Countries (LDC) blocs - themselves.
What does the roadmap say about reducing deforestation?The roadmap was released less than a week before the COP31 climate summit is due to begin, at an event hosted by the UN Development Programme in Brasilia.
During the launch event, Do Lago highlighted recent figures showing that Brazil's deforestation rate had fallen to its lowest level on record - dropping by more than 70% since 2022.
"Even the optimists wouldn't believe that we were able to decrease deforestation" by as much as the country has managed in recent years, he said.
Corrêa Do Lago said that he hoped the roadmap would be a "living document" and that it could provide countries with a "practical pathway for climate action".
The roadmap divides forest action into three complementary parts: national action, international action and financial mechanisms.
For each of the three, the document highlights current actions or instruments and the enabling conditions required to promote action. Then, it offers "COP30 presidency proposals on the way forward" on each pillar.
Under "national efforts", the roadmap addresses the challenge of halting and reversing deforestation across five "forest dimensions":
- Maintaining existing forests.
- Using forests sustainably while generating value for communities.
- Combatting forest degradation.
- Combatting deforestation.
- Restoration, reforestation and afforestation.
The roadmap identifies 18 policies or "implementation approaches" that countries can use to address forest loss and degradation, although it notes that the list is not intended to serve as an "exhaustive or prescriptive classification".
This includes a wide range of approaches, including establishing or maintaining protected areas, recognising the territorial rights of Indigenous peoples, managing the spread of pests and plant diseases and restricting permits for activities associated with forest conversion.
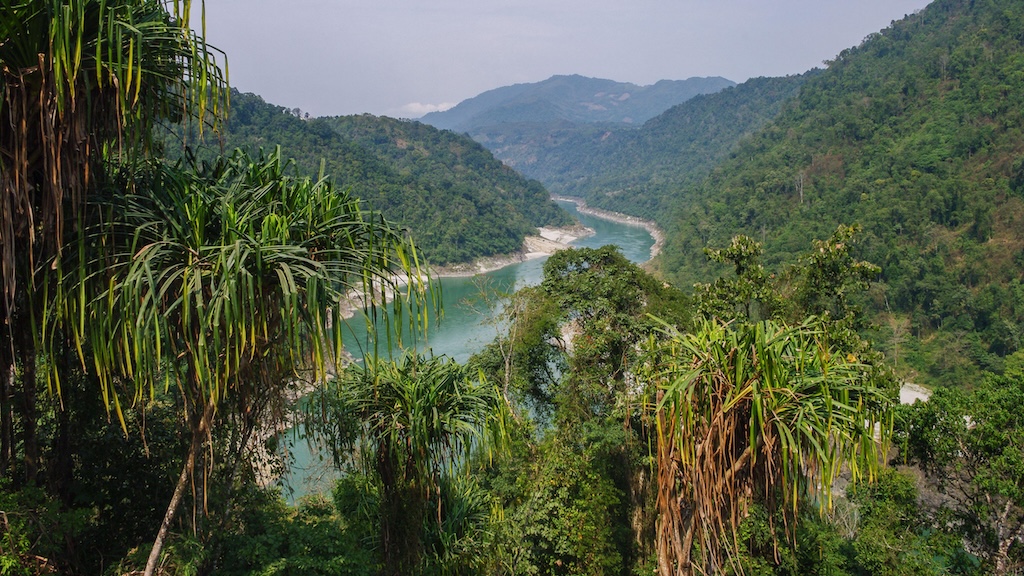 Forests in the Siang valley in Arunachal Pradesh, India. Credit: Cyrille REDOR / Alamy Stock Photo
For each of these policies, the roadmap explains the approach and gives an overview of the evidence of its effectiveness. It also gives examples of how countries are implementing that policy.
Then, the roadmap discusses the enabling conditions that need to be ensured for action to occur at the national level, such as supporting land governance and promoting environmental education.
Finally, for national action, the roadmap proposes a five-step process for countries to follow. It provides "guiding questions" that countries may consider in their work to support each step.
On "international architecture for forest action", the roadmap discusses how various international environmental and human-rights instruments address the problem of deforestation in different ways. It says:
"Climate change, biodiversity, land degradation, Indigenous peoples and local communities' rights, ecosystem conservation and species protection are addressed through distinct international regimes, but their objectives and implementation intersect in important ways in relation to forests."
The roadmap highlights some of the global forest-monitoring initiatives that can support national efforts, while noting that countries' capacity for accessing and using such information "remains uneven". It calls for improving technical cooperation between countries and increasing capacity-building.
Finally, the roadmap discusses two cross-border issues: crime and trade. On the latter, it notes that trade measures that reward compliance are generally more effective than those that impose "additional economic and administrative burdens on exporters".

Membership
Support award-winning climate journalism Join CB+The roadmap's final proposals for international action include strengthening national capacity for investigating environmental crime and prioritising trade policies that reward sustainable, deforestation-free production.
The roadmap notes that countries need an estimated $300bn per year by 2030 to halt and reverse deforestation, yet current finance reaches less than one-third of that figure.
Of this, nearly 90% comes from domestic public finance, as forest countries already dedicate "substantial effort" to protecting their domestic policies and budgets, the roadmap notes.
The roadmap offers 10 proposals for action on forest finance, including aligning domestic finance flows to support forest action, enacting effective benefits-sharing measures and strengthening the position of forests in carbon markets.
It concludes with an appeal to countries to "keep the collective dialogue going" through the conclusion of the second global stocktake in 2028.
In a statement, Kelly Stone, coordinator of the civil society network Climate Land Ambition and Rights Alliance, said:
"The forest commitments in the first global stocktake and this roadmap process are important steps, but these commitments need to translate into actual urgent action on the ground.
"This roadmap needs to be taken forward in a process where countries are working together for rapid, ambitious action on the ground to address deforestation and degradation and protect food security. We cannot afford to wait."
Why did some countries not sign onto the roadmap at COP30?In Belém, discussions around the deforestation roadmap were highly charged and several countries did not sign on.
Historically, India has opposed and raised concerns about top-down commitments around mitigation and land-use change. For example, the country did not sign the original Glasgow pledge on forests and land-use at COP26, objecting to "trade" being linked to forests and climate action.
In Belém, India - as part of the Like Minded Developing Countries bloc - objected to the inclusion of voluntary roadmaps outside of the COP agenda in the formal COP30 outcome.
However, in an interview after the talks concluded, the country's minister for environment, forests and climate, Bhupender Yadav, told the Times of India that India "welcomes" the forest roadmap. He added that it additionally "endorses" Brazil's Tropical Forest Forever Facility fund.
Russia was an early objector to the deforestation roadmap, laying out its position as early as April last year. While the country reiterated its commitment to the Glasgow forest declaration and the first global stocktake, it "does not support the development of a universal roadmap", arguing that:
"…such initiatives are not mandated under the agreed international climate architecture and go beyond adopted decisions under the UNFCCC and the Paris Agreement."
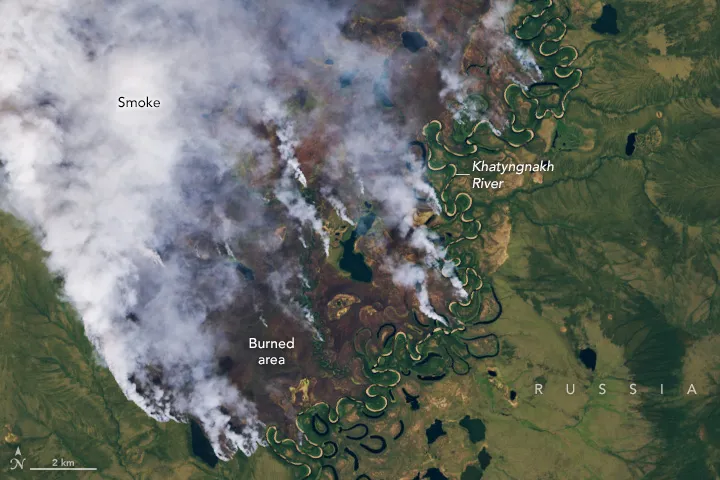 A satellite image of a large wildfire burning in northern Russia's Yakutia region in 2024. Credit: NASA Earth Observatory
Russia hosts the world's largest boreal forests, which are seeing more intense wildfires. In its submission on the deforestation roadmap, Russia "underscored" that there is no "universally agreed, legally binding definition" of forest degradation, although it adds subsequently that wildfires are a "key driver" of degradation.
Like India, it also opposed the roadmap on trade grounds.
Other countries were wary of signing on to new non-negotiated mitigation commitments outside of the official COP agenda, at the expense of other agenda items, such as adaptation finance.
At the recently concluded Yerevan COP17 nature talks, the deforestation roadmap's coordinator Marco Túlio Scarpelli Cabral told Carbon Brief it does not make sense to talk about more countries signing up to the non-negotiated roadmap, when countries have agreed by consensus to tackle deforestation within the global stocktake and biodiversity COPs. He added:
"All countries have already taken this [deforestation] commitment, both in the Kunming-Montreal [Global Biodiversity Framework] with some converging targets, but also in the global stocktake…
"We have all accepted [it]. So we don't need any country to subscribe to the roadmap."
The first global stocktake was undertaken at COP28 in Dubai. As mentioned above, within the mitigation section of this document - which was adopted by consensus - the importance of "halting and reversing deforestation and forest degradation" is emphasised.
The newly published roadmap therefore is not designed to convince countries to agree to tackle deforestation; instead it seeks to build on this assumed consensus by drawing on previous agreements such as the global stocktake.
Speaking at a press conference attended by Carbon Brief on 3 November, COP30 president Corrêa do Lago said they took into account the agreement in Dubai and then began looking for "instruments and ways to go ahead and take next steps". She added:
"The climate change agenda is advancing faster than the negotiations [themselves], so we restructured the agenda."
What are the barriers to implementing a deforestation roadmap?In February 2026, the Brazilian COP presidency asked countries to describe specific barriers to implementing a forest roadmap and the tangible support they need.
From political strife to wildfires and reliance on firewood during an energy crisis, countries listed a number of overlapping challenges to halting and reversing deforestation in their submissions.
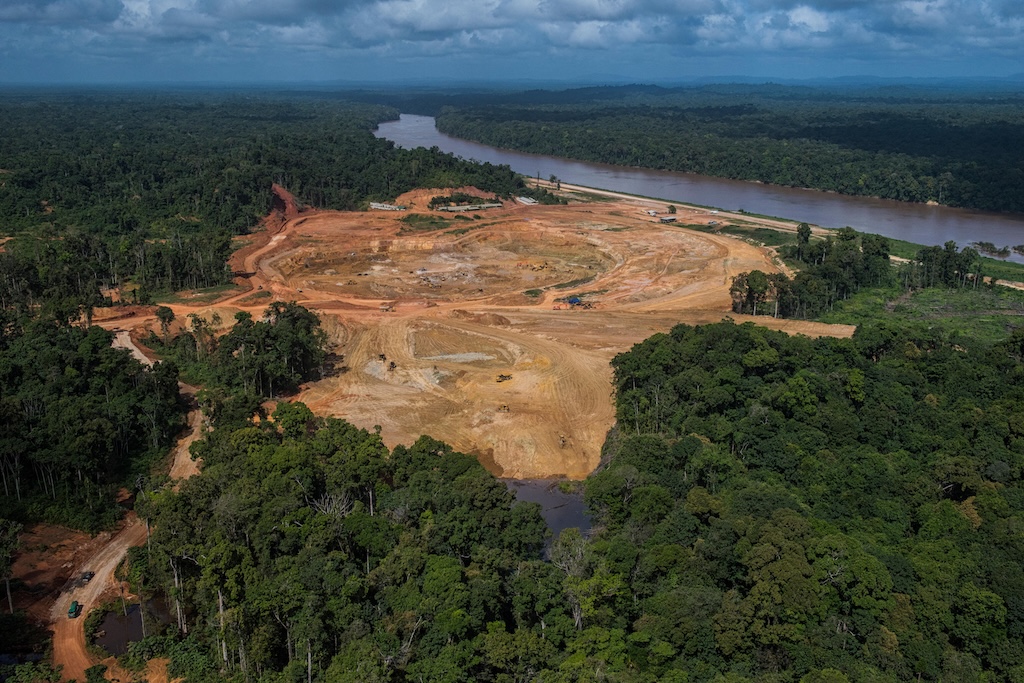 Gold mining in Guyana. Credit: Nature Picture Library / Alamy Stock Photo
For example, Guyana and Suriname have both highlighted that keeping existing "forests intact" is undervalued compared to "pressures from extractive industries", such as mining or agriculture.
Meanwhile, the EU, Switzerland and Mexico point to the role of agricultural expansion in the loss of forest and pasture land. Norway and Mexico highlighted illegal loggers offering higher rewards than conservation.
Both Canada and Russia pointed to an "inconsistent definition" of forest degradation.
Biodiverse countries with significant forest cover, such as Suriname and Azerbaijan, meanwhile called for more "predictable" and "affordable" access to climate finance to keep forests standing.
The Coalition of Rainforest Nations called for "a clear financial assessment of the total funding required to halt forest loss" in its submission.
However, many donor countries emphasised domestic, private and innovative finance in their solutions. The UK, for instance, called for more "blended finance to de-risk private investment at scale" for forest conservation and high-integrity carbon markets.
While Norway spoke of the need to "repurpos[e]" harmful subsidies, Australia highlighted the role of its controversial biodiversity credit and nature markets in "restor[ing] and protect[ing] land and biodiversity and reduc[ing] emissions at the same time".
Monitoring deforestation and restoration progress was another common challenge across countries. AOSIS, Armenia and Azerbaijan all raised this challenge and called for technical support for monitoring forest restoration, including satellite monitoring.
At the same time, Canada, Indonesia, Russia, Azerbaijan and Australia all cited the increasing risk of intensifying wildfires as threats to forests, with countries calling for early detection systems and support for monitoring fires in remote areas.
AOSIS called for coastal mangroves and inland terrestrial forests to be included in the definition of forests, adding that climate-driven impacts are already degrading mangrove forests.
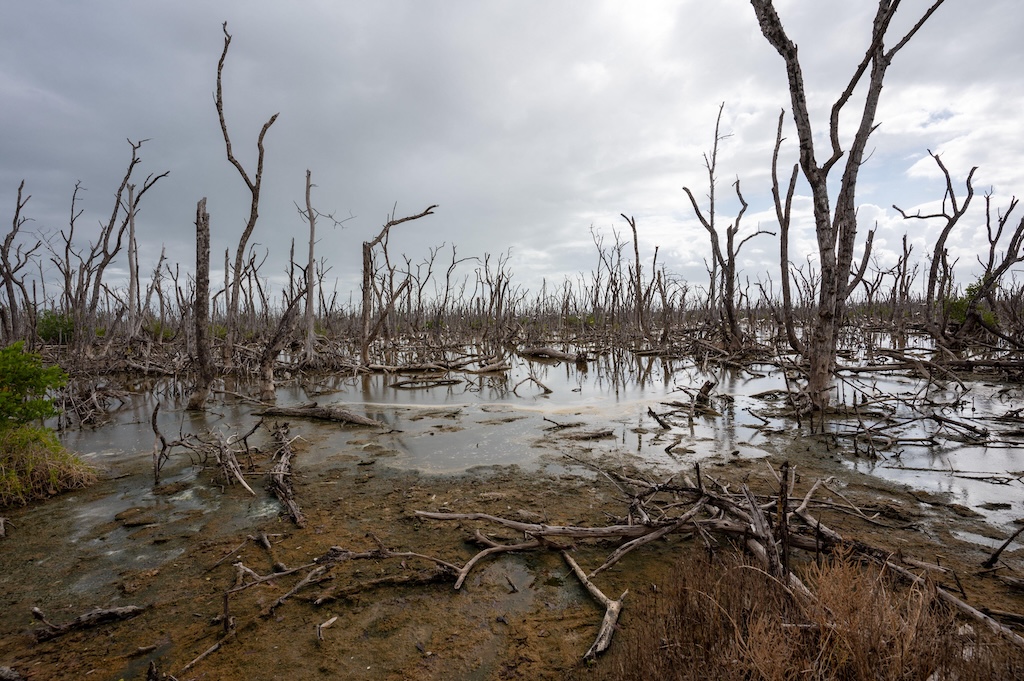 Dead zone in mangrove forests destroyed by Hurricane Irma. Credit: Francisco Blanco / Alamy Stock Photo
Many barriers are deeply specific to the geographical and socioeconomic contexts of individual countries. Small island states such as Mauritius, for instance, point to pressures arising from a "limited availability" of land. Sudan, meanwhile, draws attention to 70% of its population relying on firewood as an energy source amid conflict.
 Interactive: Who wants what at the COP31 climate change summit
02.11.2026
COP31 Antalya
 Experts: What China wants from the COP31 climate talks
29.10.2026
China policy
 Interview: COP31 president says electrification is 'surest way to protect citizens'
10.07.2026
COP31 Antalya
 Bonn climate talks: Key outcomes from the June 2026 UN climate conference
19.06.2026
Adaptation
The post Q&A: What is the Brazil-led 'deforestation roadmap'? appeared first on Carbon Brief.
- Why has Brazil produced a fossil-fuel 'roadmap'?
- What does the fossil-fuel roadmap say?
- How will the fossil-fuel roadmap be discussed at COP31?
Transitioning away from fossil fuels is "urgent, inevitable and, yet, possible", according to a first-of-its-kind global "roadmap" produced by Brazil.
The host of last year's climate summit, COP30, has set out a voluntary plan for how countries can move away from coal, oil and gas.
The roadmap says there is no "one-size-fits-all" approach to transitioning away from fossil fuels and asks countries to "diagnose" their own "readiness" to start the process.
After mapping out their specific circumstances, countries should then pursue "tailored levers" to take action, according to the roadmap.
These efforts should culminate by 2033, it says - 10 years on from when the COP28 climate summit in Dubai called on all countries to contribute to a global transition away from fossil fuels.
Below, Carbon Brief examines what the roadmap says and how it could influence debates about fossil fuels at the upcoming COP31 climate summit, which begins next week in Turkey.
- Why has Brazil produced a fossil-fuel 'roadmap'?
- What does the fossil-fuel roadmap say?
- How will the fossil-fuel roadmap be discussed at COP31?
Calls for a global "roadmap" away from fossil fuels dominated debates at COP30, which was held in the Amazonian city of Belém.
A group of 85 countries called for a reference to a new roadmap for transitioning away from fossil fuels to be part of COP30's formal negotiated outcome.
This call came the first "global stocktake" of action towards the world's climate goals at COP28 in 2023 called on all countries to contribute to transitioning away from fossil fuels.
However, another group of countries opposed such an inclusion.
It was claimed that this group included 84 countries. However, Carbon Brief's analysis of the "informal list" revealed inconsistencies and errors, meaning the total number of countries opposing the roadmap was likely smaller.
After two weeks of fierce debate, Brazil announced that the fossil-fuel roadmap would not be part of COP30's negotiated outcome - but that the presidency would work to create a roadmap outside of the UN climate process.
This roadmap is voluntary and countries are not obligated to respond to its findings.
Membership
Support award-winning climate journalism Join CB+At COP30, the presidency also announced that the roadmap would be informed by a first-of-its-kind conference on transitioning away from fossil fuels taking place in Santa Marta, Colombia.
These talks, co-hosted by Colombia and the Netherlands in April, saw ministers and climate envoys take part in informal discussions about the barriers they face in transitioning away from fossil fuels. (See Carbon Brief's full coverage of the talks.)
As well as the fossil-fuel roadmap, Brazil has also produced a new roadmap for ending deforestation. (See Carbon Brief's in-depth breakdown of the deforestation roadmap).
What does the fossil-fuel roadmap say?The roadmap acknowledges that, after decades of delayed action on fossil fuels, the world is no longer able to meet its ambition to limit global warming to 1.5C without first "overshooting" the target.
It also notes that the global transition to clean energy is already underway - and that the policies needed for transitioning away from fossil fuels already exist and are readily deployable.
It continues, however, by saying that transitioning away from fossil fuels is "as much a development question as a climate one, especially for emerging markets and developing economies".
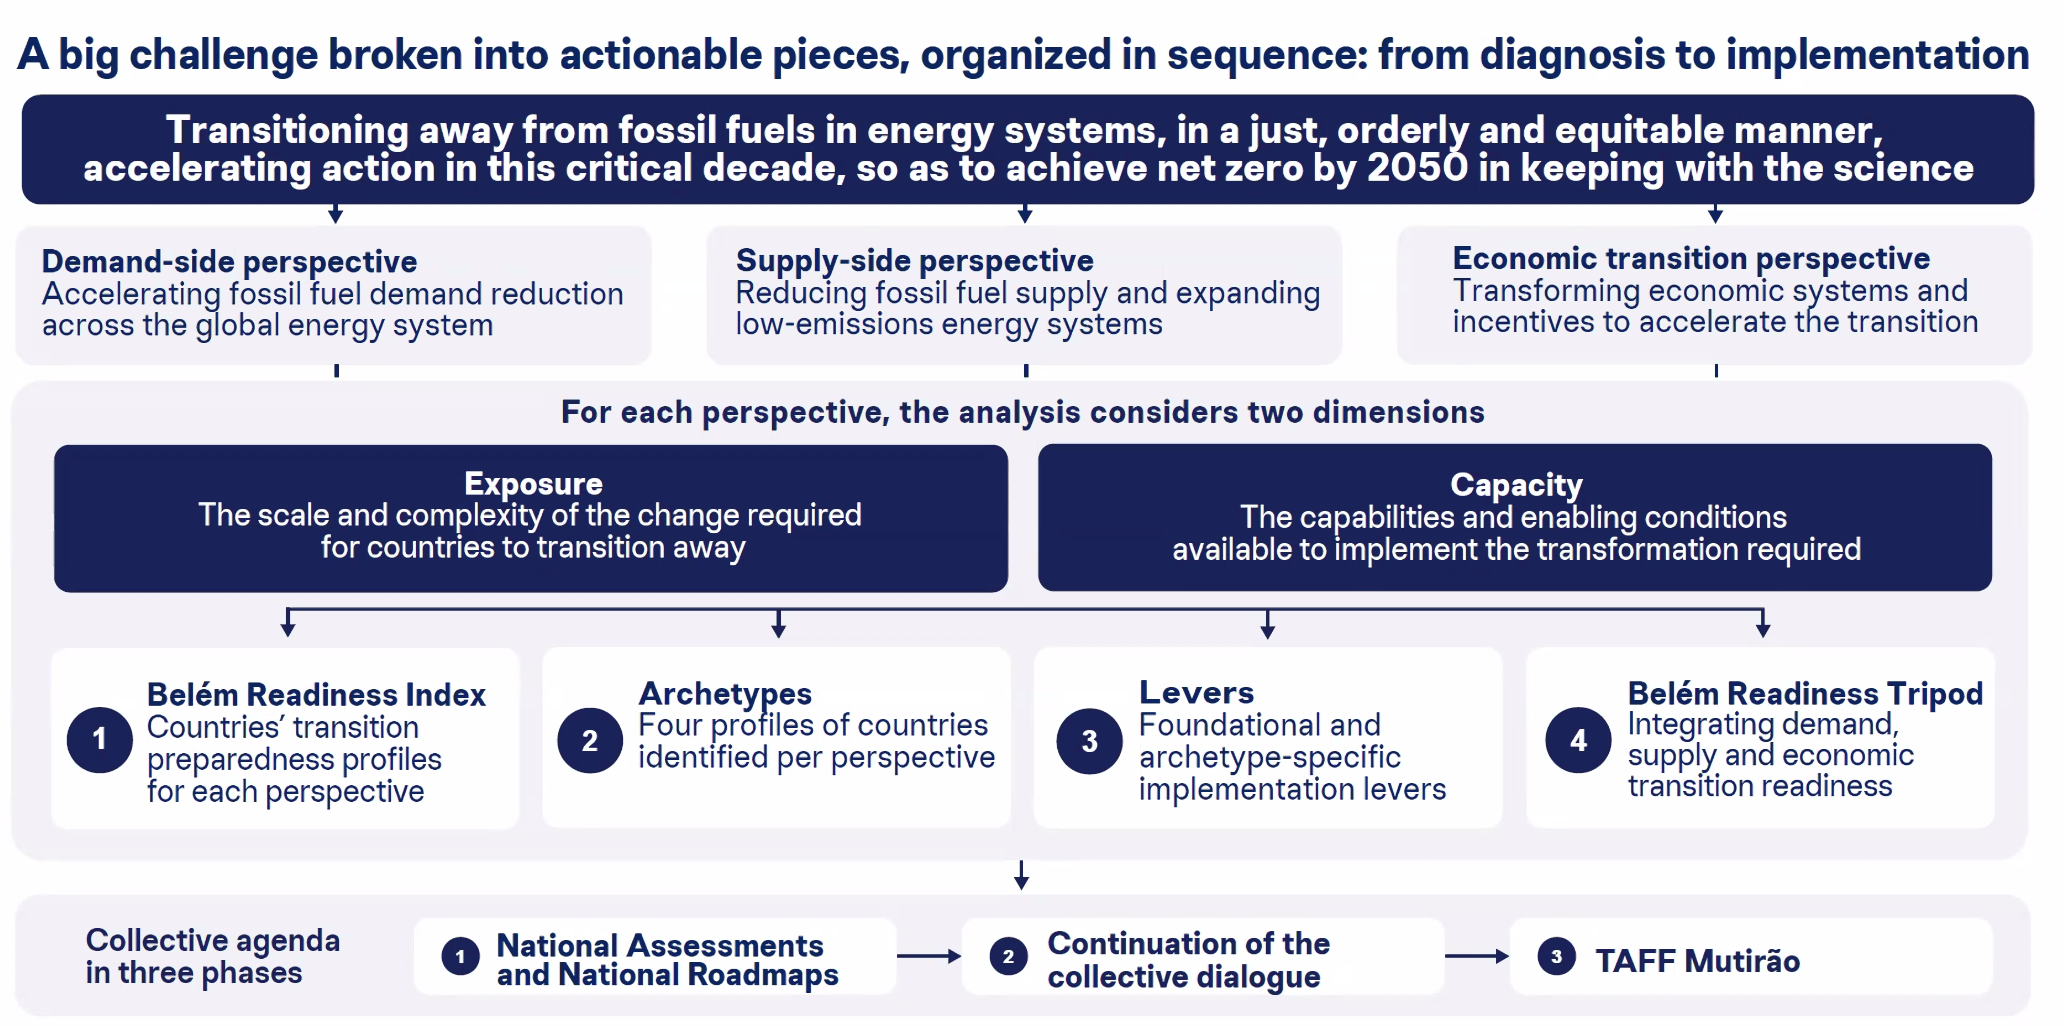
In this context, it sets out plans for what it calls a "Belém readiness index". This is a "voluntary self-assessment tool" that countries can use to calculate their dependency on fossil fuels and their capacity for transitioning away.
At a press briefing announcing the roadmaps, COP30 CEO Ana Toni described this as the "diagnosis" stage of the roadmap, "instead of imagining there is a one-size-fits-all answer".
#gform_wrapper_7[data-form-index="0"].gform-theme,[data-parent-form="7_0"]{--gf-color-primary: #204ce5;--gf-color-primary-rgb: 32, 76, 229;--gf-color-primary-contrast: #fff;--gf-color-primary-contrast-rgb: 255, 255, 255;--gf-color-primary-darker: #001AB3;--gf-color-primary-lighter: #527EFF;--gf-color-secondary: #fff;--gf-color-secondary-rgb: 255, 255, 255;--gf-color-secondary-contrast: #112337;--gf-color-secondary-contrast-rgb: 17, 35, 55;--gf-color-secondary-darker: #F5F5F5;--gf-color-secondary-lighter: #FFFFFF;--gf-color-out-ctrl-light: rgba(17, 35, 55, 0.1);--gf-color-out-ctrl-light-rgb: 17, 35, 55;--gf-color-out-ctrl-light-darker: rgba(104, 110, 119, 0.35);--gf-color-out-ctrl-light-lighter: #F5F5F5;--gf-color-out-ctrl-dark: #585e6a;--gf-color-out-ctrl-dark-rgb: 88, 94, 106;--gf-color-out-ctrl-dark-darker: #112337;--gf-color-out-ctrl-dark-lighter: rgba(17, 35, 55, 0.65);--gf-color-in-ctrl: #fff;--gf-color-in-ctrl-rgb: 255, 255, 255;--gf-color-in-ctrl-contrast: #112337;--gf-color-in-ctrl-contrast-rgb: 17, 35, 55;--gf-color-in-ctrl-darker: #F5F5F5;--gf-color-in-ctrl-lighter: #FFFFFF;--gf-color-in-ctrl-primary: #204ce5;--gf-color-in-ctrl-primary-rgb: 32, 76, 229;--gf-color-in-ctrl-primary-contrast: #fff;--gf-color-in-ctrl-primary-contrast-rgb: 255, 255, 255;--gf-color-in-ctrl-primary-darker: #001AB3;--gf-color-in-ctrl-primary-lighter: #527EFF;--gf-color-in-ctrl-light: rgba(17, 35, 55, 0.1);--gf-color-in-ctrl-light-rgb: 17, 35, 55;--gf-color-in-ctrl-light-darker: rgba(104, 110, 119, 0.35);--gf-color-in-ctrl-light-lighter: #F5F5F5;--gf-color-in-ctrl-dark: #585e6a;--gf-color-in-ctrl-dark-rgb: 88, 94, 106;--gf-color-in-ctrl-dark-darker: #112337;--gf-color-in-ctrl-dark-lighter: rgba(17, 35, 55, 0.65);--gf-radius: 3px;--gf-font-size-secondary: 14px;--gf-font-size-tertiary: 13px;--gf-icon-ctrl-number: url("data:image/svg+xml,%3Csvg width='8' height='14' viewBox='0 0 8 14' fill='none' xmlns='http://www.w3.org/2000/svg'%3E%3Cpath fill-rule='evenodd' clip-rule='evenodd' d='M4 0C4.26522 5.96046e-08 4.51957 0.105357 4.70711 0.292893L7.70711 3.29289C8.09763 3.68342 8.09763 4.31658 7.70711 4.70711C7.31658 5.09763 6.68342 5.09763 6.29289 4.70711L4 2.41421L1.70711 4.70711C1.31658 5.09763 0.683417 5.09763 0.292893 4.70711C-0.0976311 4.31658 -0.097631 3.68342 0.292893 3.29289L3.29289 0.292893C3.48043 0.105357 3.73478 0 4 0ZM0.292893 9.29289C0.683417 8.90237 1.31658 8.90237 1.70711 9.29289L4 11.5858L6.29289 9.29289C6.68342 8.90237 7.31658 8.90237 7.70711 9.29289C8.09763 9.68342 8.09763 10.3166 7.70711 10.7071L4.70711 13.7071C4.31658 14.0976 3.68342 14.0976 3.29289 13.7071L0.292893 10.7071C-0.0976311 10.3166 -0.0976311 9.68342 0.292893 9.29289Z' fill='rgba(17, 35, 55, 0.65)'/%3E%3C/svg%3E");--gf-icon-ctrl-select: url("data:image/svg+xml,%3Csvg width='10' height='6' viewBox='0 0 10 6' fill='none' xmlns='http://www.w3.org/2000/svg'%3E%3Cpath fill-rule='evenodd' clip-rule='evenodd' d='M0.292893 0.292893C0.683417 -0.097631 1.31658 -0.097631 1.70711 0.292893L5 3.58579L8.29289 0.292893C8.68342 -0.0976311 9.31658 -0.0976311 9.70711 0.292893C10.0976 0.683417 10.0976 1.31658 9.70711 1.70711L5.70711 5.70711C5.31658 6.09763 4.68342 6.09763 4.29289 5.70711L0.292893 1.70711C-0.0976311 1.31658 -0.0976311 0.683418 0.292893 0.292893Z' fill='rgba(17, 35, 55, 0.65)'/%3E%3C/svg%3E");--gf-icon-ctrl-search: url("data:image/svg+xml,%3Csvg width='640' height='640' xmlns='http://www.w3.org/2000/svg'%3E%3Cpath d='M256 128c-70.692 0-128 57.308-128 128 0 70.691 57.308 128 128 128 70.691 0 128-57.309 128-128 0-70.692-57.309-128-128-128zM64 256c0-106.039 85.961-192 192-192s192 85.961 192 192c0 41.466-13.146 79.863-35.498 111.248l154.125 154.125c12.496 12.496 12.496 32.758 0 45.254s-32.758 12.496-45.254 0L367.248 412.502C335.862 434.854 297.467 448 256 448c-106.039 0-192-85.962-192-192z' fill='rgba(17, 35, 55, 0.65)'/%3E%3C/svg%3E");--gf-label-space-y-secondary: var(--gf-label-space-y-md-secondary);--gf-ctrl-border-color: #686e77;--gf-ctrl-size: var(--gf-ctrl-size-md);--gf-ctrl-label-color-primary: #112337;--gf-ctrl-label-color-secondary: #112337;--gf-ctrl-choice-size: var(--gf-ctrl-choice-size-md);--gf-ctrl-checkbox-check-size: var(--gf-ctrl-checkbox-check-size-md);--gf-ctrl-radio-check-size: var(--gf-ctrl-radio-check-size-md);--gf-ctrl-btn-font-size: var(--gf-ctrl-btn-font-size-md);--gf-ctrl-btn-padding-x: var(--gf-ctrl-btn-padding-x-md);--gf-ctrl-btn-size: var(--gf-ctrl-btn-size-md);--gf-ctrl-btn-border-color-secondary: #686e77;--gf-ctrl-file-btn-bg-color-hover: #EBEBEB;--gf-field-img-choice-size: var(--gf-field-img-choice-size-md);--gf-field-img-choice-card-space: var(--gf-field-img-choice-card-space-md);--gf-field-img-choice-check-ind-size: var(--gf-field-img-choice-check-ind-size-md);--gf-field-img-choice-check-ind-icon-size: var(--gf-field-img-choice-check-ind-icon-size-md);--gf-field-pg-steps-number-color: rgba(17, 35, 55, 0.8);} EmailThis field is for validation purposes and should be left unchanged.Free weekly newsletter
.preheader p{ margin-top: 0; font-family: 'PT Sans', sans-serif; font-weight: var(--type--3--font-weight--bold); color: var(--button--color); font-size: var(--button--font-size, inherit); } .newsletter-inline{
display: flex;
border: solid 1px #333333;
padding: 1em;
background: #ffffff;
}
.inline-email{
display:inline-block;
margin-right:1em;
margin-top:0 !important;
margin-bottom:0.5em;
}
#field_submit{
display:inline-block;
margin-top:0 !important;
}
.gform_wrapper .gfield+.gfield{
margin-top:0
}
Email
gform.initializeOnLoaded( function() {gformInitSpinner( 7, 'https://www.carbonbrief.org/wp-content/plugins/gravityforms/images/spinner.svg', false );jQuery('#gform_ajax_frame_7').on('load',function(){var contents = jQuery(this).contents().find('*').html();var is_postback = contents.indexOf('GF_AJAX_POSTBACK') >= 0;if(!is_postback){return;}var form_content = jQuery(this).contents().find('#gform_wrapper_7');var is_confirmation = jQuery(this).contents().find('#gform_confirmation_wrapper_7').length > 0;var is_redirect = contents.indexOf('gformRedirect(){') >= 0;var is_form = form_content.length > 0 && ! is_redirect && ! is_confirmation;var mt = parseInt(jQuery('html').css('margin-top'), 10) + parseInt(jQuery('body').css('margin-top'), 10) + 100;if(is_form){jQuery('#gform_wrapper_7').html(form_content.html());if(form_content.hasClass('gform_validation_error')){jQuery('#gform_wrapper_7').addClass('gform_validation_error');} else {jQuery('#gform_wrapper_7').removeClass('gform_validation_error');}setTimeout( function() { /* delay the scroll by 50 milliseconds to fix a bug in chrome */ jQuery(document).scrollTop(jQuery('#gform_wrapper_7').offset().top - mt); }, 50 );if(window['gformInitDatepicker']) {gformInitDatepicker();}if(window['gformInitPriceFields']) {gformInitPriceFields();}var current_page = jQuery('#gform_source_page_number_7').val();gformInitSpinner( 7, 'https://www.carbonbrief.org/wp-content/plugins/gravityforms/images/spinner.svg', false );jQuery(document).trigger('gform_page_loaded', [7, current_page]);window['gf_submitting_7'] = false;}else if(!is_redirect){var confirmation_content = jQuery(this).contents().find('.GF_AJAX_POSTBACK').html();if(!confirmation_content){confirmation_content = contents;}jQuery('#gform_wrapper_7').replaceWith(confirmation_content);jQuery(document).scrollTop(jQuery('#gf_7').offset().top - mt);jQuery(document).trigger('gform_confirmation_loaded', [7]);window['gf_submitting_7'] = false;wp.a11y.speak(jQuery('#gform_confirmation_message_7').text());}else{jQuery('#gform_7').append(contents);if(window['gformRedirect']) {gformRedirect();}}jQuery(document).trigger("gform_pre_post_render", [{ formId: "7", currentPage: "current_page", abort: function() { this.preventDefault(); } }]); if (event && event.defaultPrevented) { return; } const gformWrapperDiv = document.getElementById( "gform_wrapper_7" ); if ( gformWrapperDiv ) { const visibilitySpan = document.createElement( "span" ); visibilitySpan.id = "gform_visibility_test_7"; gformWrapperDiv.insertAdjacentElement( "afterend", visibilitySpan ); } const visibilityTestDiv = document.getElementById( "gform_visibility_test_7" ); let postRenderFired = false; function triggerPostRender() { if ( postRenderFired ) { return; } postRenderFired = true; gform.core.triggerPostRenderEvents( 7, current_page ); if ( visibilityTestDiv ) { visibilityTestDiv.parentNode.removeChild( visibilityTestDiv ); } } function debounce( func, wait, immediate ) { var timeout; return function() { var context = this, args = arguments; var later = function() { timeout = null; if ( !immediate ) func.apply( context, args ); }; var callNow = immediate && !timeout; clearTimeout( timeout ); timeout = setTimeout( later, wait ); if ( callNow ) func.apply( context, args ); }; } const debouncedTriggerPostRender = debounce( function() { triggerPostRender(); }, 200 ); if ( visibilityTestDiv && visibilityTestDiv.offsetParent === null ) { const observer = new MutationObserver( ( mutations ) => { mutations.forEach( ( mutation ) => { if ( mutation.type === 'attributes' && visibilityTestDiv.offsetParent !== null ) { debouncedTriggerPostRender(); observer.disconnect(); } }); }); observer.observe( document.body, { attributes: true, childList: false, subtree: true, attributeFilter: [ 'style', 'class' ], }); } else { triggerPostRender(); } } );} );
After identifying their "readiness" for transition, countries will be sorted into four "archetypes", says the roadmap, leading to the identification of specific policy "levers" for taking action.
The roadmap calls for action in three distinct "phases".
The first phase should be from now until 2028, when the second global stocktake of progress towards the Paris Agreement is due to conclude at COP33.
In this phase, "efforts focus on institutions and long-term signals", says the roadmap.
The second phase is from 2028-2030, when the next round of UN climate pledges, known as nationally determined contributions (NDCs), are due.
This phase should focus on the "physical transformation of energy systems", says the roadmap.
The final phase is 2031-2033 - 10 years after the call for all countries to help with "transitioning away from fossil fuels" in "this critical decade" at COP28.
This phase should focus on the scaling up of the transition, according to the roadmap.
All of these elements are summarised in the graphic below, which was presented to journalists and civil society during a press briefing.
 Credit: COP30 presidency
At the press briefing, Toni added that each stage of the roadmap was designed to be "extremely pragmatic and easy for countries to take a look at it".
The approach has broadly been welcomed by civil society and experts.
Dr Natalie Jones, a senior policy adviser at the International Institute for Sustainable Development (IISD), tells Carbon Brief that the roadmap sends an "important political signal that the transition away from fossil fuels remains firmly on the international agenda". She adds:
"It also gives governments practical guidance to plan that transition in ways that reflect their national circumstances, strengthen energy security and protect livelihoods."
Avantika Goswami, a climate policy expert at the Centre for Science and Environment in New Delhi, India, tells Carbon Brief that the roadmap is a "unique and consultative method of multilateralism". She says:
"[The roadmap] is one that is put forth by a developing country, via a consultative process that invited submissions from all parties and civil society.
"The analytical framework proposed captures the complexity of the fossil-fuel transition. Countries must now use it to chart out pathways in line with their historical responsibility and current capacity."
Ploy Achakulwisut, a former UN adviser on fossil fuels, wrote on LinkedIn that she was "deeply impressed" with Brazil's approach, including its use of a "readiness index". She added:
"[The index] provides a method for identifying countries that face similar transition conditions and for understanding how different exposure-capacity 'archetypes' can generate distinct implementation needs and opportunities.
"The latter can 'support more targeted international cooperation', helping the international community to align finance, technology, capacity-building, and technical assistance with country-specific needs and existing capabilities."
How will the fossil-fuel roadmap be discussed at COP31?Brazil's fossil-fuel roadmap comes just a week before the next round of UN climate talks, COP31, kicks off in Antalya, Turkey.
COP31 co-presidents Turkey and Australia have set out a wide range of priorities for the summit, including a target to increase the share of global final energy consumption met by electricity from almost 24% in 2023 to 35% by 2035.
Speaking at the press briefing, COP30 president André Aranha Corrêa do Lago said that this electrification goal was "complementary" to the aims of the fossil-fuel roadmap.
Carbon Brief understands that some parties feel that Turkey and Australia's focus on electrification over fossil fuels is an attempt to avoid a re-hashing of the lengthy debates at COP30.
Both Corrêa do Lago and Toni were reluctant to speculate on how the fossil-fuel roadmap might be taken up and discussed during COP31, with Toni telling journalists that they were "hoping for the best".
When asked about how Brazil hoped the roadmap would be received by those that specifically opposed its inclusion at COP30, Corrêa do Lago declined to address other countries directly, but said:
"Let's remind ourselves we already have a consensus [on transitioning away from fossil fuels, agreed at COP28] and we already have the instruments."
Jones tells Carbon Brief that, following on from the roadmap, the "task now is to build on that signal with action", adding:
"At COP31, more governments should announce national fossil-fuel transition roadmaps and explain how these will inform their national climate plans. The conference should also [formally] recognise the global roadmap and establish a route for its findings to inform the second global stocktake.
"For vulnerable countries dependent on fossil-fuel revenues, credible plans must be matched by international finance and support to diversify their economies and sustain public services. This roadmap can help turn a shared commitment into practical progress."
Related
Interactive: Who wants what at the COP31 climate change summit
02.11.2026
COP31 Antalya
Experts: What China wants from the COP31 climate talks
29.10.2026
China policy
Interview: COP31 president says electrification is 'surest way to protect citizens'
10.07.2026
COP31 Antalya
Bonn climate talks: Key outcomes from the June 2026 UN climate conference
19.06.2026
Adaptation
The post Q&A: What is in the global 'roadmap' for transitioning away from fossil fuels? appeared first on Carbon Brief.
Following this year's UN COP17 biodiversity conference, Carbon Brief's journalists hosted a livestream to explain what happened at the summit.
Carbon Brief's Orla Dwyer and Aruna Chandrasekhar have been on the ground in Yerevan, Armenia, over the past two weeks, covering the negotiations.
They were joined on the livestream by associate editors Dr Giuliana Viglione and Daisy Dunne, who were following the talks from Washington DC and London, respectively.
Carbon Brief has also published its 10,000-word explainer of COP17, which lays out the key outcomes in detail.
Membership
Support award-winning climate journalism Join CB+Orla and Aruna kicked off the livestream by explaining the biggest issues at the event, including biodiversity finance and the first "global review" of progress towards reversing nature loss.
The four journalists then took live questions from the audience in an "ask me anything" format, covering issues such as "nature-harming subsidies", marine biodiversity and the status of the Cali fund, which is meant to raise private-sector finance.
A recording of the webinar (below) is now available to watch on YouTube.
 COP17: Key outcomes agreed at the UN biodiversity conference in Yerevan
31.10.2026
COP17 Yerevan
 COP17: Which countries have released new pledges to tackle nature loss?
16.10.2026
COP17 Yerevan
 COP17: Tracking progress towards the UN's 2030 nature targets
15.10.2026
COP17 Yerevan
 COP17: Developed countries 'fall far short' of UN targets for nature finance
15.10.2026
COP17 Yerevan
The post CB Live: Carbon Brief's team at COP17 on the nature talks' key outcomes appeared first on Carbon Brief.
The upcoming COP31 climate talks in Antalya, Turkey need to respond to the latest science on global warming, which is "really scary", says UK climate minister Katie White.
In an interview with Carbon Brief setting out the UK's priorities for the summit, White also responds to suggestions that the government is walking back its climate policies.
White says the "shocking" impact of extreme heat and wildfires this summer makes it clear that climate change "isn't something far off; it's something we're living through".
She adds that the UK will be working to "hold up the science", including the Intergovernmental Panel on Climate Change (IPCC) reports that should be the "basis of discussions".
The COP31 presidency push on electrification is "going to be key", says White, who points to other priorities for the UK that include tackling methane emissions and reducing deforestation.
White says the recent approval of the Jackdaw gas field in the North Sea is "fully in line" with carbon budgets and that the UK continues to support the "transition away from fossil fuels".
She adds that the Hormuz crisis has helped drive the "biggest uptake…we've ever seen" in the UK for solar, electric vehicles and heat pumps.
Finally, White defends the new approach set out in the budget by chancellor John Healey, including a greater focus on affordability, as a "natural evolution" of UK government policy.
Carbon Brief: Katie White, thank you very much for joining Carbon Brief today. Next week we're going to be heading to COP31 climate talks in Antalya in Turkey.
We've seen this year the UN warning that a temporary overshoot of 1.5C degrees is now inevitable. We've had 50,000 excess heat deaths across Europe this summer. We've had extreme weather events hitting Nepal, deadly floods there. Heading into the talks, what would you say the UK's priorities are?
Katie White: Thanks, Simon. Look, just to say, it's great to be here. I'm a big fan of Carbon Brief and the work you've been doing. I think it's incredibly important that there are people who are focused on the facts and have really excellent commentary. So just to say thank you, and it's good to be here to discuss with you.
Look, this year has been a very significant year in terms of climate, particularly sat here in the UK. I think we have really felt the impacts of climate change for the first time. For you and me, who've been working on this for a long time [and] we talk about it. But even so - I don't know how you felt - but I was even shocked by the implications of what that was for everyday life, for people actually sleeping at night. You know, in terms of parliament, I had colleagues who had to go pick up their children because their schools weren't available, and you know, tragedies in terms of older people struggling in the heat.
Not to mention the wildfires that we had across the country. I went to visit one in Romford and I think just standing - literally in the ashes - and seeing people's homes really close by. My colleague in Stourbridge, obviously, they had burnt-out houses - you know, devastating. And you think about it - and I talked with her about - the actual real-life implications of that.
Membership
Support award-winning climate journalism Join CB+Obviously, people think about it, but then the after-effects, and you know the challenges with insurance and the challenge with all these sky boxes, and all of the things that come - those smaller things, as well as the tragedies around your photos, and all of that being lost.
So I think it's really opened, sadly, another door for us in terms of the climate-change journey. This isn't something far off; it's something we're living through. I know that's been the case for many countries for a long time, but it really felt like a shift here in the UK.
You're right, the science, once again, is really scary. The overshoot report is incredibly concerning. Scientifically, obviously, they look for a longer period. But I think the main message - for me as a politician - is this is really worrying. And every year we have another call to action. How do we translate that call into actual delivery? And that's the bit we need to make sure of, because you know, I think we have to be listening to the science, and the science is fundamental and key. And we might talk about the IPCC [Intergovernmental Panel on Climate Change] and all the elements of that. But also, for me, how do we translate that?
It's not, as you all know, it's not the big global stocktake COP [this year in Antalya]. So it's not going to be that big event, where we have it every five years. But we still need to be making significant progress. So we really focus a lot on the science, on the "action agenda" and on those political decisions - that "cover decision" that the Australian presidency [of negotiations] has said that they're going to pursue.
So in terms of the action agenda, which obviously the Turkish [presidency] has led on and [has] been really forthright about leading on this, I think electrification is going to be key. It's something that shot up the agenda.
I think most of your audience will know what electrification is, but for anyone outside of the climate bubble [it is] around electrifying our homes, electrifying our transportation. And in the UK, we've done a good job of decarbonising our electricity system, but we need to be pulling down on that and increasing demand to make sure that we take full advantage of the clean electricity that we have, which would be good for bills, but also around reducing our emissions as well. So something around electrification, we're expecting a lot of talk of that. [It is] something the Turks have been talking about a lot.
Methane is another area which we've been working on, but I expect there will be some progress in terms of methane. Forests, you'll know that we've pledged an investment to the [Tropical Forest Forever] TFFF, so we will be hoping for some momentum around that forests agenda.
var gform;gform||(document.addEventListener("gform_main_scripts_loaded",function(){gform.scriptsLoaded=!0}),document.addEventListener("gform/theme/scripts_loaded",function(){gform.themeScriptsLoaded=!0}),window.addEventListener("DOMContentLoaded",function(){gform.domLoaded=!0}),gform={domLoaded:!1,scriptsLoaded:!1,themeScriptsLoaded:!1,isFormEditor:()=>"function"==typeof InitializeEditor,callIfLoaded:function(o){return!(!gform.domLoaded||!gform.scriptsLoaded||!gform.themeScriptsLoaded&&!gform.isFormEditor()||(gform.isFormEditor()&&console.warn("The use of gform.initializeOnLoaded() is deprecated in the form editor context and will be removed in Gravity Forms 3.1."),o(),0))},initializeOnLoaded:function(o){gform.callIfLoaded(o)||(document.addEventListener("gform_main_scripts_loaded",()=>{gform.scriptsLoaded=!0,gform.callIfLoaded(o)}),document.addEventListener("gform/theme/scripts_loaded",()=>{gform.themeScriptsLoaded=!0,gform.callIfLoaded(o)}),window.addEventListener("DOMContentLoaded",()=>{gform.domLoaded=!0,gform.callIfLoaded(o)}))},hooks:{action:{},filter:{}},addAction:function(o,r,e,t){gform.addHook("action",o,r,e,t)},addFilter:function(o,r,e,t){gform.addHook("filter",o,r,e,t)},doAction:function(o){gform.doHook("action",o,arguments)},applyFilters:function(o){return gform.doHook("filter",o,arguments)},removeAction:function(o,r){gform.removeHook("action",o,r)},removeFilter:function(o,r,e){gform.removeHook("filter",o,r,e)},addHook:function(o,r,e,t,n){null==gform.hooks[o][r]&&(gform.hooks[o][r]=[]);var d=gform.hooks[o][r];null==n&&(n=r+"_"+d.length),gform.hooks[o][r].push({tag:n,callable:e,priority:t=null==t?10:t})},doHook:function(r,o,e){var t;if(e=Array.prototype.slice.call(e,1),null!=gform.hooks[r][o]&&((o=gform.hooks[r][o]).sort(function(o,r){return o.priority-r.priority}),o.forEach(function(o){"function"!=typeof(t=o.callable)&&(t=window[t]),"action"==r?t.apply(null,e):e[0]=t.apply(null,e)})),"filter"==r)return e[0]},removeHook:function(o,r,t,n){var e;null!=gform.hooks[o][r]&&(e=(e=gform.hooks[o][r]).filter(function(o,r,e){return!!(null!=n&&n!=o.tag||null!=t&&t!=o.priority)}),gform.hooks[o][r]=e)}}); #gform_wrapper_4[data-form-index="0"].gform-theme,[data-parent-form="4_0"]{--gf-color-primary: #204ce5;--gf-color-primary-rgb: 32, 76, 229;--gf-color-primary-contrast: #fff;--gf-color-primary-contrast-rgb: 255, 255, 255;--gf-color-primary-darker: #001AB3;--gf-color-primary-lighter: #527EFF;--gf-color-secondary: #fff;--gf-color-secondary-rgb: 255, 255, 255;--gf-color-secondary-contrast: #112337;--gf-color-secondary-contrast-rgb: 17, 35, 55;--gf-color-secondary-darker: #F5F5F5;--gf-color-secondary-lighter: #FFFFFF;--gf-color-out-ctrl-light: rgba(17, 35, 55, 0.1);--gf-color-out-ctrl-light-rgb: 17, 35, 55;--gf-color-out-ctrl-light-darker: rgba(104, 110, 119, 0.35);--gf-color-out-ctrl-light-lighter: #F5F5F5;--gf-color-out-ctrl-dark: #585e6a;--gf-color-out-ctrl-dark-rgb: 88, 94, 106;--gf-color-out-ctrl-dark-darker: #112337;--gf-color-out-ctrl-dark-lighter: rgba(17, 35, 55, 0.65);--gf-color-in-ctrl: #fff;--gf-color-in-ctrl-rgb: 255, 255, 255;--gf-color-in-ctrl-contrast: #112337;--gf-color-in-ctrl-contrast-rgb: 17, 35, 55;--gf-color-in-ctrl-darker: #F5F5F5;--gf-color-in-ctrl-lighter: #FFFFFF;--gf-color-in-ctrl-primary: #204ce5;--gf-color-in-ctrl-primary-rgb: 32, 76, 229;--gf-color-in-ctrl-primary-contrast: #fff;--gf-color-in-ctrl-primary-contrast-rgb: 255, 255, 255;--gf-color-in-ctrl-primary-darker: #001AB3;--gf-color-in-ctrl-primary-lighter: #527EFF;--gf-color-in-ctrl-light: rgba(17, 35, 55, 0.1);--gf-color-in-ctrl-light-rgb: 17, 35, 55;--gf-color-in-ctrl-light-darker: rgba(104, 110, 119, 0.35);--gf-color-in-ctrl-light-lighter: #F5F5F5;--gf-color-in-ctrl-dark: #585e6a;--gf-color-in-ctrl-dark-rgb: 88, 94, 106;--gf-color-in-ctrl-dark-darker: #112337;--gf-color-in-ctrl-dark-lighter: rgba(17, 35, 55, 0.65);--gf-radius: 3px;--gf-font-size-secondary: 14px;--gf-font-size-tertiary: 13px;--gf-icon-ctrl-number: url("data:image/svg+xml,%3Csvg width='8' height='14' viewBox='0 0 8 14' fill='none' xmlns='http://www.w3.org/2000/svg'%3E%3Cpath fill-rule='evenodd' clip-rule='evenodd' d='M4 0C4.26522 5.96046e-08 4.51957 0.105357 4.70711 0.292893L7.70711 3.29289C8.09763 3.68342 8.09763 4.31658 7.70711 4.70711C7.31658 5.09763 6.68342 5.09763 6.29289 4.70711L4 2.41421L1.70711 4.70711C1.31658 5.09763 0.683417 5.09763 0.292893 4.70711C-0.0976311 4.31658 -0.097631 3.68342 0.292893 3.29289L3.29289 0.292893C3.48043 0.105357 3.73478 0 4 0ZM0.292893 9.29289C0.683417 8.90237 1.31658 8.90237 1.70711 9.29289L4 11.5858L6.29289 9.29289C6.68342 8.90237 7.31658 8.90237 7.70711 9.29289C8.09763 9.68342 8.09763 10.3166 7.70711 10.7071L4.70711 13.7071C4.31658 14.0976 3.68342 14.0976 3.29289 13.7071L0.292893 10.7071C-0.0976311 10.3166 -0.0976311 9.68342 0.292893 9.29289Z' fill='rgba(17, 35, 55, 0.65)'/%3E%3C/svg%3E");--gf-icon-ctrl-select: url("data:image/svg+xml,%3Csvg width='10' height='6' viewBox='0 0 10 6' fill='none' xmlns='http://www.w3.org/2000/svg'%3E%3Cpath fill-rule='evenodd' clip-rule='evenodd' d='M0.292893 0.292893C0.683417 -0.097631 1.31658 -0.097631 1.70711 0.292893L5 3.58579L8.29289 0.292893C8.68342 -0.0976311 9.31658 -0.0976311 9.70711 0.292893C10.0976 0.683417 10.0976 1.31658 9.70711 1.70711L5.70711 5.70711C5.31658 6.09763 4.68342 6.09763 4.29289 5.70711L0.292893 1.70711C-0.0976311 1.31658 -0.0976311 0.683418 0.292893 0.292893Z' fill='rgba(17, 35, 55, 0.65)'/%3E%3C/svg%3E");--gf-icon-ctrl-search: url("data:image/svg+xml,%3Csvg width='640' height='640' xmlns='http://www.w3.org/2000/svg'%3E%3Cpath d='M256 128c-70.692 0-128 57.308-128 128 0 70.691 57.308 128 128 128 70.691 0 128-57.309 128-128 0-70.692-57.309-128-128-128zM64 256c0-106.039 85.961-192 192-192s192 85.961 192 192c0 41.466-13.146 79.863-35.498 111.248l154.125 154.125c12.496 12.496 12.496 32.758 0 45.254s-32.758 12.496-45.254 0L367.248 412.502C335.862 434.854 297.467 448 256 448c-106.039 0-192-85.962-192-192z' fill='rgba(17, 35, 55, 0.65)'/%3E%3C/svg%3E");--gf-label-space-y-secondary: var(--gf-label-space-y-md-secondary);--gf-ctrl-border-color: #686e77;--gf-ctrl-size: var(--gf-ctrl-size-md);--gf-ctrl-label-color-primary: #112337;--gf-ctrl-label-color-secondary: #112337;--gf-ctrl-choice-size: var(--gf-ctrl-choice-size-md);--gf-ctrl-checkbox-check-size: var(--gf-ctrl-checkbox-check-size-md);--gf-ctrl-radio-check-size: var(--gf-ctrl-radio-check-size-md);--gf-ctrl-btn-font-size: var(--gf-ctrl-btn-font-size-md);--gf-ctrl-btn-padding-x: var(--gf-ctrl-btn-padding-x-md);--gf-ctrl-btn-size: var(--gf-ctrl-btn-size-md);--gf-ctrl-btn-border-color-secondary: #686e77;--gf-ctrl-file-btn-bg-color-hover: #EBEBEB;--gf-field-img-choice-size: var(--gf-field-img-choice-size-md);--gf-field-img-choice-card-space: var(--gf-field-img-choice-card-space-md);--gf-field-img-choice-check-ind-size: var(--gf-field-img-choice-check-ind-size-md);--gf-field-img-choice-check-ind-icon-size: var(--gf-field-img-choice-check-ind-icon-size-md);--gf-field-pg-steps-number-color: rgba(17, 35, 55, 0.8);} InstagramThis field is for validation purposes and should be left unchanged.Free fortnightly newsletter
.preheader p{ margin-top: 0; font-family: 'PT Sans', sans-serif; font-weight: var(--type--3--font-weight--bold); color: var(--button--color); font-size: var(--button--font-size, inherit); } .newsletter-inline{
display: flex;
border: solid 1px #333333;
padding: 1em;
background: #ffffff;
}
.inline-email{
display:inline-block;
margin-right:1em;
margin-top:0 !important;
margin-bottom:0.5em;
}
#field_submit{
display:inline-block;
margin-top:0 !important;
}
.gform_wrapper .gfield+.gfield{
margin-top:0
}
Email
gform.initializeOnLoaded( function() {gformInitSpinner( 4, 'https://www.carbonbrief.org/wp-content/plugins/gravityforms/images/spinner.svg', false );jQuery('#gform_ajax_frame_4').on('load',function(){var contents = jQuery(this).contents().find('*').html();var is_postback = contents.indexOf('GF_AJAX_POSTBACK') >= 0;if(!is_postback){return;}var form_content = jQuery(this).contents().find('#gform_wrapper_4');var is_confirmation = jQuery(this).contents().find('#gform_confirmation_wrapper_4').length > 0;var is_redirect = contents.indexOf('gformRedirect(){') >= 0;var is_form = form_content.length > 0 && ! is_redirect && ! is_confirmation;var mt = parseInt(jQuery('html').css('margin-top'), 10) + parseInt(jQuery('body').css('margin-top'), 10) + 100;if(is_form){jQuery('#gform_wrapper_4').html(form_content.html());if(form_content.hasClass('gform_validation_error')){jQuery('#gform_wrapper_4').addClass('gform_validation_error');} else {jQuery('#gform_wrapper_4').removeClass('gform_validation_error');}setTimeout( function() { /* delay the scroll by 50 milliseconds to fix a bug in chrome */ jQuery(document).scrollTop(jQuery('#gform_wrapper_4').offset().top - mt); }, 50 );if(window['gformInitDatepicker']) {gformInitDatepicker();}if(window['gformInitPriceFields']) {gformInitPriceFields();}var current_page = jQuery('#gform_source_page_number_4').val();gformInitSpinner( 4, 'https://www.carbonbrief.org/wp-content/plugins/gravityforms/images/spinner.svg', false );jQuery(document).trigger('gform_page_loaded', [4, current_page]);window['gf_submitting_4'] = false;}else if(!is_redirect){var confirmation_content = jQuery(this).contents().find('.GF_AJAX_POSTBACK').html();if(!confirmation_content){confirmation_content = contents;}jQuery('#gform_wrapper_4').replaceWith(confirmation_content);jQuery(document).scrollTop(jQuery('#gf_4').offset().top - mt);jQuery(document).trigger('gform_confirmation_loaded', [4]);window['gf_submitting_4'] = false;wp.a11y.speak(jQuery('#gform_confirmation_message_4').text());}else{jQuery('#gform_4').append(contents);if(window['gformRedirect']) {gformRedirect();}}jQuery(document).trigger("gform_pre_post_render", [{ formId: "4", currentPage: "current_page", abort: function() { this.preventDefault(); } }]); if (event && event.defaultPrevented) { return; } const gformWrapperDiv = document.getElementById( "gform_wrapper_4" ); if ( gformWrapperDiv ) { const visibilitySpan = document.createElement( "span" ); visibilitySpan.id = "gform_visibility_test_4"; gformWrapperDiv.insertAdjacentElement( "afterend", visibilitySpan ); } const visibilityTestDiv = document.getElementById( "gform_visibility_test_4" ); let postRenderFired = false; function triggerPostRender() { if ( postRenderFired ) { return; } postRenderFired = true; gform.core.triggerPostRenderEvents( 4, current_page ); if ( visibilityTestDiv ) { visibilityTestDiv.parentNode.removeChild( visibilityTestDiv ); } } function debounce( func, wait, immediate ) { var timeout; return function() { var context = this, args = arguments; var later = function() { timeout = null; if ( !immediate ) func.apply( context, args ); }; var callNow = immediate && !timeout; clearTimeout( timeout ); timeout = setTimeout( later, wait ); if ( callNow ) func.apply( context, args ); }; } const debouncedTriggerPostRender = debounce( function() { triggerPostRender(); }, 200 ); if ( visibilityTestDiv && visibilityTestDiv.offsetParent === null ) { const observer = new MutationObserver( ( mutations ) => { mutations.forEach( ( mutation ) => { if ( mutation.type === 'attributes' && visibilityTestDiv.offsetParent !== null ) { debouncedTriggerPostRender(); observer.disconnect(); } }); }); observer.observe( document.body, { attributes: true, childList: false, subtree: true, attributeFilter: [ 'style', 'class' ], }); } else { triggerPostRender(); } } );} );
So, I think, those are some of the really practical areas of action, as well as making sure we're moving forward, holding up the UNFCCC [UN Framework Convention on Climate Change], holding up the science, so we can keep moving forward and making progress on any of those areas within the cover decision that the Australians will obviously steer us through.
CB: Great, thank you. You mentioned electrification. Obviously, that's a target announced by the Turkish presidency earlier this year. They said they want to see the adoption of a global target for 35% of final energy to come from electricity by 2035.
At the moment, it's a voluntary sign-on pledge, but presumably that's something that could enter into the cover decision, as you mentioned. I guess I'm wondering: is the UK going to sign up to that, if it remains as a voluntary pledge? And would the UK like to see that in the cover decision, brought formally into the [COP31] outcome?
KW: Good questions. Look, so we'll wait and see how we manage the next couple of weeks in terms of [that]. I think we have definitely, domestically, been looking at electrification and how we take advantage of the clean electricity that we have more effectively. Because of the Middle East crisis, broadly, we've seen interest in EVs, in solar panels and heat pumps, just shoot up this year, as people have got increasingly concerned about energy prices. And for those who are in a position, you know, a lot of them have taken advantage.
So we are seeing shifts in the market, and we're looking at what role we can play to encourage and accelerate that. Whether it's supporting the rollout of charging points for electric vehicles. You'll probably know this, Simon, but there are more public charging points in the UK now than petrol pumps, which I think is an incredible fact - and most people don't know. That's not including those within driveways, of which nearly 70% of the UK has access to a driveway, so all of those people who might have their own home charging, there is more public.
We are making this infrastructure more easy, more accessible, so that people can make that shift. But we are [already] seeing the shift, you know, we've got two million EVs on the road. Super excitingly for the motor geeks, the second-hand [EV] car market is really starting to - excuse the pun - "motor". Actually, that does mean a big shift in terms of accessibility.
So we're seeing this happen within the UK. We'll look at whether that's a helpful target for us, but in terms of the focus, the ambition on electrification in the UK will remain. And I'm really pleased to see it as part of the negotiations this year or the action agenda.
It was interesting to see the Europeans do their own electrification - I don't know whether they called it a plan or a roadmap, everybody gets caught up on these words - but they also brought forward [an "action plan"]. So obviously, we're looking at where we can, you know, be a little bit more aligned with them.
CB: You mentioned roadmaps. Now, obviously, last year at the COP, the big debate, slightly outside of the formal negotiations, was around the idea of a roadmap away from fossil fuels and the UK was one of more than 100 countries that were really pushing for that to again be brought into the formal outcome of the summit in Brazil. Is that something that the UK is going to be pushing again this year?
KW: For sure. So look, we very much support the agenda around the transition away from fossil fuels. You know, in terms of, how do we support countries, how do we work together in terms of moving away from that? You'll know that Rachel Kyte, our special representative, was in Santa Marta in April of this year to talk through [this topic] and we hosted a follow-up event at Wilton Park around the London Climate Action Week. So you know, very keen to support and work that through.
It's obviously a hard agenda, but it's something that I think we should have been discussing for a while in terms of the COP processes. So it was great that we managed to do that. I think it was as a result of lots of different people talking about it, different campaigns, different, you know, how do we work together around this, in terms of managing the resources we have most effectively, and transitioning away. [That's] for climate reasons, for health reasons and, in large part, economic reasons as well.
CB: Great. You mentioned the IPCC timeline. This is obviously something that's been rolling on for quite a while. There's been a group of countries making a concerted effort to delay the publication of the next IPCC assessment report, so that it won't align with the next global stocktake under the Paris Agreement.
The UK, as far as I understand, is pushing for that timeline to be accelerated, or to at least align with the stocktake. I just want to confirm that that's the UK's position and then ask, what is your understanding of the arguments being made for not doing that, for not aligning those timelines?
KW: So look, we obviously would like to have as much of the science ready for the global stocktake. That would be the ideal outcome in terms of what we are looking for, and we have said that we will continue to say that we would also like an outcome.
So, in a sense, we would like to make sure that we have a decision and we are moving this forward, and we don't get caught up in having longer negotiations, which stall us making any progress at all.
I wasn't at the [IPCC] meeting this autumn, but in terms of [what] I understand, [IPCC chair Prof] Jim Skea did a good job of trying to navigate that and making sure that this is inclusive. We want to listen to concerns around inclusivity, but we also want to make progress, because of the reasons that we talked about right up front: there is some really scary science going forward. The IPCC is peer-reviewed, it's the best in the world, and we want to make sure that that is the basis of discussions.
So the more we can align that together, the better. But we're also practical. We want to work with everybody. We want to listen to everybody. But we are keen to move that forward and hold up the IPCC in the way it has been. It's become the most respected, established platform for all that the negotiations are based on.
CB: Great, thank you. I want to turn to the UK now, if I can. So, under the Paris Agreement, the UK has pledged to cut its greenhouse gas emissions to 68% below 1990 levels by 2030. In June, the Climate Change Committee, in its assessment, said something like 17% of the cuts required to meet that target just didn't have plans in place.
The government's own carbon budget delivery plan said that current policies were falling short of what would be needed. And then, obviously, since then we've had a number of cuts. We've had cuts to heat pump subsidies, cuts to hydrogen and carbon-capture and storage. We're expecting to see further watering down of the zero-emission vehicles mandate for electric vehicles. We just had approval of new drilling at Jackdaw. We may also see Rosebank being approved.
When you're at the COP in Antalya, how will you be reassuring UK partners that the UK remains committed to its climate pledge?
KW: So look, it's absolutely right that you pick out any of the challenges - and say where the challenges are to our evidence. That's really helpful, as part of our process of doing that. I would also then say, there are a whole bunch of other things - on the side of positives - that are moving forward, some of which we have touched on.
We put forward a carbon budget growth and delivery plan last year that we had to redo, because obviously there had been a legal challenge. We did that. It was a very comprehensive process. You know, a huge amount of work to make sure that we were on track to deliver that. So that is the case. The Climate Change Committee was obviously coming back on what was happening now, and we will report to parliament [in response to the committee] in the normal way. I will leave that report to talk for itself when it comes out to parliament.
We also - the great thing about the Climate Change Act and the carbon budgets is that it does allow flexibility over time. You have that trajectory, you have the volume of emissions over time, but it does allow you to adjust and course correct. There are things, in terms of challenges, that come forward.
So let's take the Middle East crisis. Obviously, that's been a big disruption to our energy and climate system. Arguably, one of the biggest disruptions we've ever had. Now, that has led to a few things happening.
One is to say that electrification - you know, people are moving towards the biggest uptake in solar, heat pumps and EVs that we've ever seen. So we're seeing that trajectory go up. That's great, and that is on the positive side. At the same time, it has meant geopolitically, people are looking at their energy security and where you do have access to fossil fuels, people are considering those options.
We made the Jackdaw decision fully in line [with our carbon budgets]. We looked at the emissions - and emissions would actually be a tiny bit lower because of transportation from Norway. So it is absolutely within those boundaries.
But of course, I'm constantly keeping an eye on how that budget is moving. In the same way that over the road [in Whitehall] at HMT [the Treasury], they're keeping an eye on their financial budget, as they should do, I will keep an eye on the carbon budget, as will the secretary of state [Miatta Fahnbulleh]. So we will be keeping a look.
But I think let's also be clear that the UK has got a good story to tell. I of course want it to be better, and that's part of my job, to make sure that we have the next chapter evolving and we can keep telling our story.
But right now, we have a pretty good story to tell. You know, we've got over [a] 50% reduction in emissions, whilst having 80% [economic] growth since 1990. So we have got a good story to tell. We are making those transitions and we will continue to say that. But also, we'll continue to listen and learn because nobody has got the perfect plan for this. No one country has got all the answers or the solutions.
So I think, being clear where we've had success, being honest where it's not worked, and having a bit of humility to learn from others along the way, is how we're going to approach the COP.
CB: Great, thank you. I want to ask about climate finance. The UK is one of the only major donors to have made a new climate-finance pledge, offering £6bn, I believe, over three years. However, that is, relative to the last financial year, roughly halving; it was about £4bn in 2025-26 and it's [now] £6bn over three years, so roughly £2bn a year.
Again, I'm just curious how you're going to be talking about that with the UK's international partners, the developing countries that will be looking to the UK for that kind of support.
KW: In terms of the £6bn, so look, let's also be clear. So you're absolutely right that we - the [previously pledged] £11.6bn was over a five-year period. The £6bn is over a three-year period, and we're also talking about an additional £6bn in terms of other sources that we're looking at. So it is still a sizeable amount of money and investment.
Of course, it's not enough in terms of what the need is, and as the need increases over time, we need to be exploring other options, which is why I'm very excited about the TFFF, because it starts a new way of mobilising finance, which might unlock a whole other range of capital, which is urgently needed.
So, look, we have the £11.6bn [and] we delivered absolutely every bit of it. So I think we're seen as someone who is a credible donor, who delivers what they say we're going to do. We've also laid out a plan. We've been working across government with my colleagues at the Foreign Office and with Defra [Department of Environment, Food and Rural Affairs] in terms of how we're going to do that. Which, again, was something that developing countries were really keen [on], that we laid out that plan beforehand, so that there is some element of expectation, and it's not, you know, done at the last minute, and they can plan ahead at the same time.
We are, you know, the biggest donors of the Green Climate Fund as well, and we've looked at how we protect the climate element of our resources within the ODA [overseas development aid] cuts, which have been a cut to our international development aid, I can't say anything different to that. So we have looked at how we protect [climate] within it.
So, look, of course, I will be talking about what we have done and what we continue to do, and how we've listened to countries and laid that [plan] out, so there is some element that they can help plan ahead. But also, looking at what those alternative sources, for instance, around the structuring of the TFFF, to make sure we're looking at other options, because we do need to meet the need. The need is growing, and the finance pot needs to do the same.
CB: Thank you. One final question, if I may. Last week we obviously had the first budget from the new chancellor, John Healey. There's been a lot of conversation and media coverage since that budget about what he described as a new path for energy policy in the UK. There's been quite a lot of media coverage - and perhaps briefing from government insiders and so on - suggesting that this is a real shift in the government's approach. Effectively, giving up on - or putting slightly to the side - the clean power 2030 target.
Again, you're going to be going into the COP next week. People, I'm sure, will have been reading the papers. I wonder how you will explain to them what's going on?
KW: So, look, the first thing I'd say is it was great to hear the chancellor say on the floor of the house [of parliament] about net-zero, his commitment to net-zero by 2050 and our steadfast approach to delivering that. I think it's really helpful. You know, the chancellor's voice counts for a lot. We've heard the prime minister say it twice. He's written articles on it as well, so it's great to see that commitment from the top. There has been a lot of politicisation around net-zero, so I think the direction of travel is absolutely clear.
[The] secretary of state has said that her number one aim is around affordability. We know that we are in a cost of living crisis. At the same time, the Climate Change Committee has said the best thing we could do [to lower emissions] is bring down electricity prices, and so I think there is a really great alignment between those three things [cost, climate and security].
The clean-power mission has been incredibly effective in terms of getting a lot of clean power built. We now need to make sure we're utilising that clean power across the board, and we need to, and we want to do it in the most cost-effective way possible.
As you can probably hear from my accent, I'm from Yorkshire. We're a little bit tight [careful with money] and I want to make sure that we are using that energy most effectively. And the system at the moment is not set up to do that. There are some pretty ineffective elements of it, that we want to make sure that we're using far more effectively.
So I think that is the shift we're looking at. We're now in the next chapter of, how do we make sure that energy - and specifically electricity - is as affordable as possible for consumers, for our constituents up and down the country, but also for small businesses. And how do we make sure that demand, that use of the grid, is [met by] connecting some of these great [clean-energy projects].
You know, the last government did build some of these offshore wind turbines. They just didn't connect them all, so we need to make sure that we've got all of these things connected, and then we're utilising it really effectively, and we're supporting consumers and businesses to draw down on that.
So I think it's a really exciting opportunity for us. But I think it's just a natural evolution of the next step, to make sure that the UK citizens are getting the best value from the infrastructure that we already have.
CB: Brilliant, very, very quickly, before you have to go, the UK is going to be leading the umbrella group of countries at the COP. So coming back to the COP, I'm just curious how the UK is going to deal with being in that spotlight [and] make use of that position?
KW: Look, we are sending a great team of ministers to the COP. Obviously, the secretary of state, it's going to be her first time leading the delegation, but our ex-secretary of state [Ed Miliband] is there in his new role. He's going as the foreign secretary and the prime minister [Andy Burnham] is going, and I will also be there as well. So I think we are turning up, making sure that Britain is fully part of the conversation.
We do that in lots of different ways, whether it's part of the umbrella group or whether it's on our own or whether it's part of - I co-chair the Forest and Climate Leaders Partnership. We're always looking at ways where the UK can show up and try to make a positive difference.
So again, I think we'll be doing that, but working closely with our umbrella colleagues. We've been in the group, so it's a natural step for us to step up and do that. But I think operating in different areas of the ecosystem helps us to make sure we can bring forward a really comprehensive, thoughtful approach to the negotiations.
CB: Brilliant! Thanks very much, Katie, and great to have you.
Related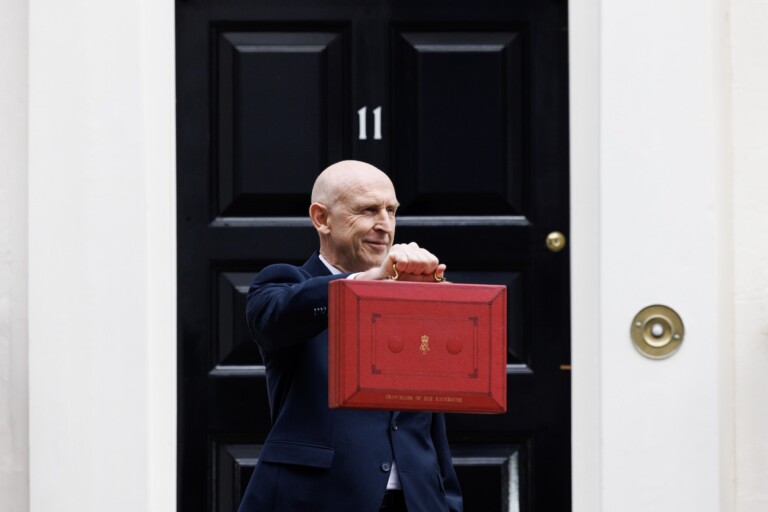 UK budget 2026: Key climate and energy announcements
28.10.2026
UK policy
 Analysis: How the UK spent more than £11.6bn on climate aid since 2021
28.10.2026
UK policy
 Revealed: UK relied on £2bn of 'questionable accounting' to hit its climate-aid goal
28.10.2026
UK policy
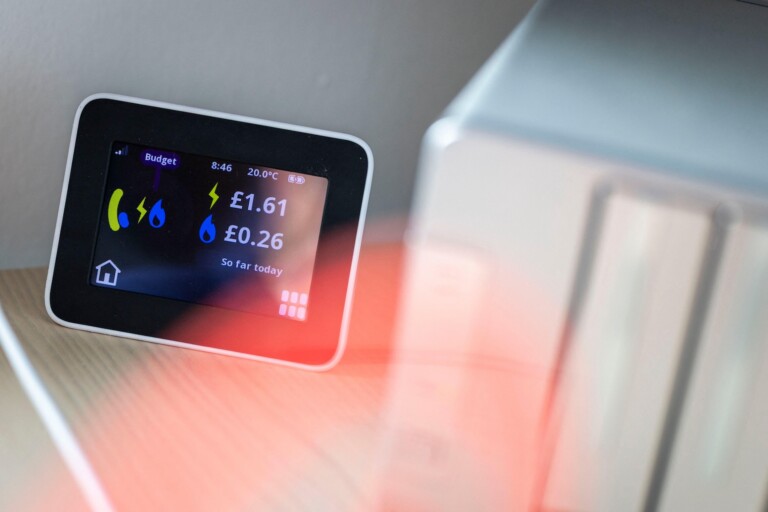 Q&A: Why are UK energy bills so high - and how could they be lowered?
27.10.2026
Oil and gas
The post UK climate minister Katie White: COP31 must respond to 'really scary' science appeared first on Carbon Brief.
- A record August and the second-warmest year to date
- A record-setting El Niño event
- Record heat across much of the world
- Good odds of being world's warmest year
- Datasets are split on whether 2026 is headed for a record
- 2027 very likely to be the warmest year on record
- Earth's energy imbalance has more than doubled
- Arctic sea ice minimum tied for 10th lowest, Antarctic near record lows
With three-quarters of the year now past, it is virtually certain that 2026 will be the warmest or second-warmest year on record.
A rapidly strengthening El Niño, alongside human-caused global warming, made this year's August the warmest on record and September the second-warmest.
El Niño is the warm phase of a recurring climate pattern in the tropical Pacific that releases heat from the ocean into the atmosphere and temporarily boosts global temperatures.
Carbon Brief's analysis gives 2026 a 67% chance of surpassing 2024 as the warmest year on record across an average of six global temperature datasets.
In January, it is likely the groups that report global surface temperatures will be divided on whether 2026 officially beat 2024's record.
Currently, the odds for a record year range from as high as 97% in Berkeley Earth's dataset to less than 20% in European Copernicus/ECMWF's ERA5 reanalysis product.
With El Niño expected to intensify into the winter, Carbon Brief projects that 2027 will be 1.7C above pre-industrial levels, with a 96% chance that it is the warmest year on record.
In this latest "state of the climate" quarterly update, Carbon Brief finds:
- August 2026 was the warmest August on record in all six major datasets, at around 0.12C above the previous record. September was the second-warmest September, behind 2023.
- January-September was the second-warmest such period on record, at around 1.45C above pre-industrial levels, behind only 2024.
- El Niño broke the daily "Niño3.4" region record in September and has stayed above the previous record every day since. Nearly all forecast model runs have it as the strongest El Niño on record, with a peak of around 4C occurring this winter.
- Around 22% of the world's surface saw its warmest July-September on record, including much of the tropical Pacific, the western Mediterranean and Iberia. Western Europe had its hottest summer on record and Spain its warmest September, beating the previous record by 0.7C.
- Carbon Brief projects that 2026 will end up around 1.52C above pre-industrial levels, with a 67% chance of beating 2024's record.
- Whether 2026 is declared the warmest year depends on the dataset; a record is likely in Berkeley Earth and NASA GISTEMP, is too close to call in HadCRUT5, JRA-3Q and NOAA and is unlikely in ERA5.
- Earth's energy imbalance has more than doubled since the start of the satellite record, from around 0.5 watts per metre squared (W/m2) in the 2000s to around 1.25W/m2 over the past decade.
- The Arctic sea ice minimum was tied for 10th lowest in the satellite record, while Antarctic sea ice saw its third-lowest winter peak.
- This year's record-setting El Niño will have its largest effect on global temperatures in 2027. Carbon Brief projects 2027 at around 1.7C above pre-industrial levels, with a 96% chance that it will be the warmest year on record.
 A record August and the second-warmest year to date
Carbon Brief analyses records from six different groups that report global surface temperatures:
- NASA's GISTEMP
- NOAAGlobalTemp
- The Met Office Hadley Centre and University of East Anglia's HadCRUT5
- Berkeley Earth
- Copernicus/ECMWF's ERA5 reanalysis product
- The Japan Meteorological Agency's JRA-3Q reanalysis product
There are a number of additional groups that feature in Carbon Brief's annual "state of the climate" update, but are not included here due to a lack of regular monthly updates.
The first nine months of 2026 were the second warmest on record in all six datasets, behind only 2024.
The figure below shows annual temperatures in each dataset since 1970, along with the 2026 average to date.
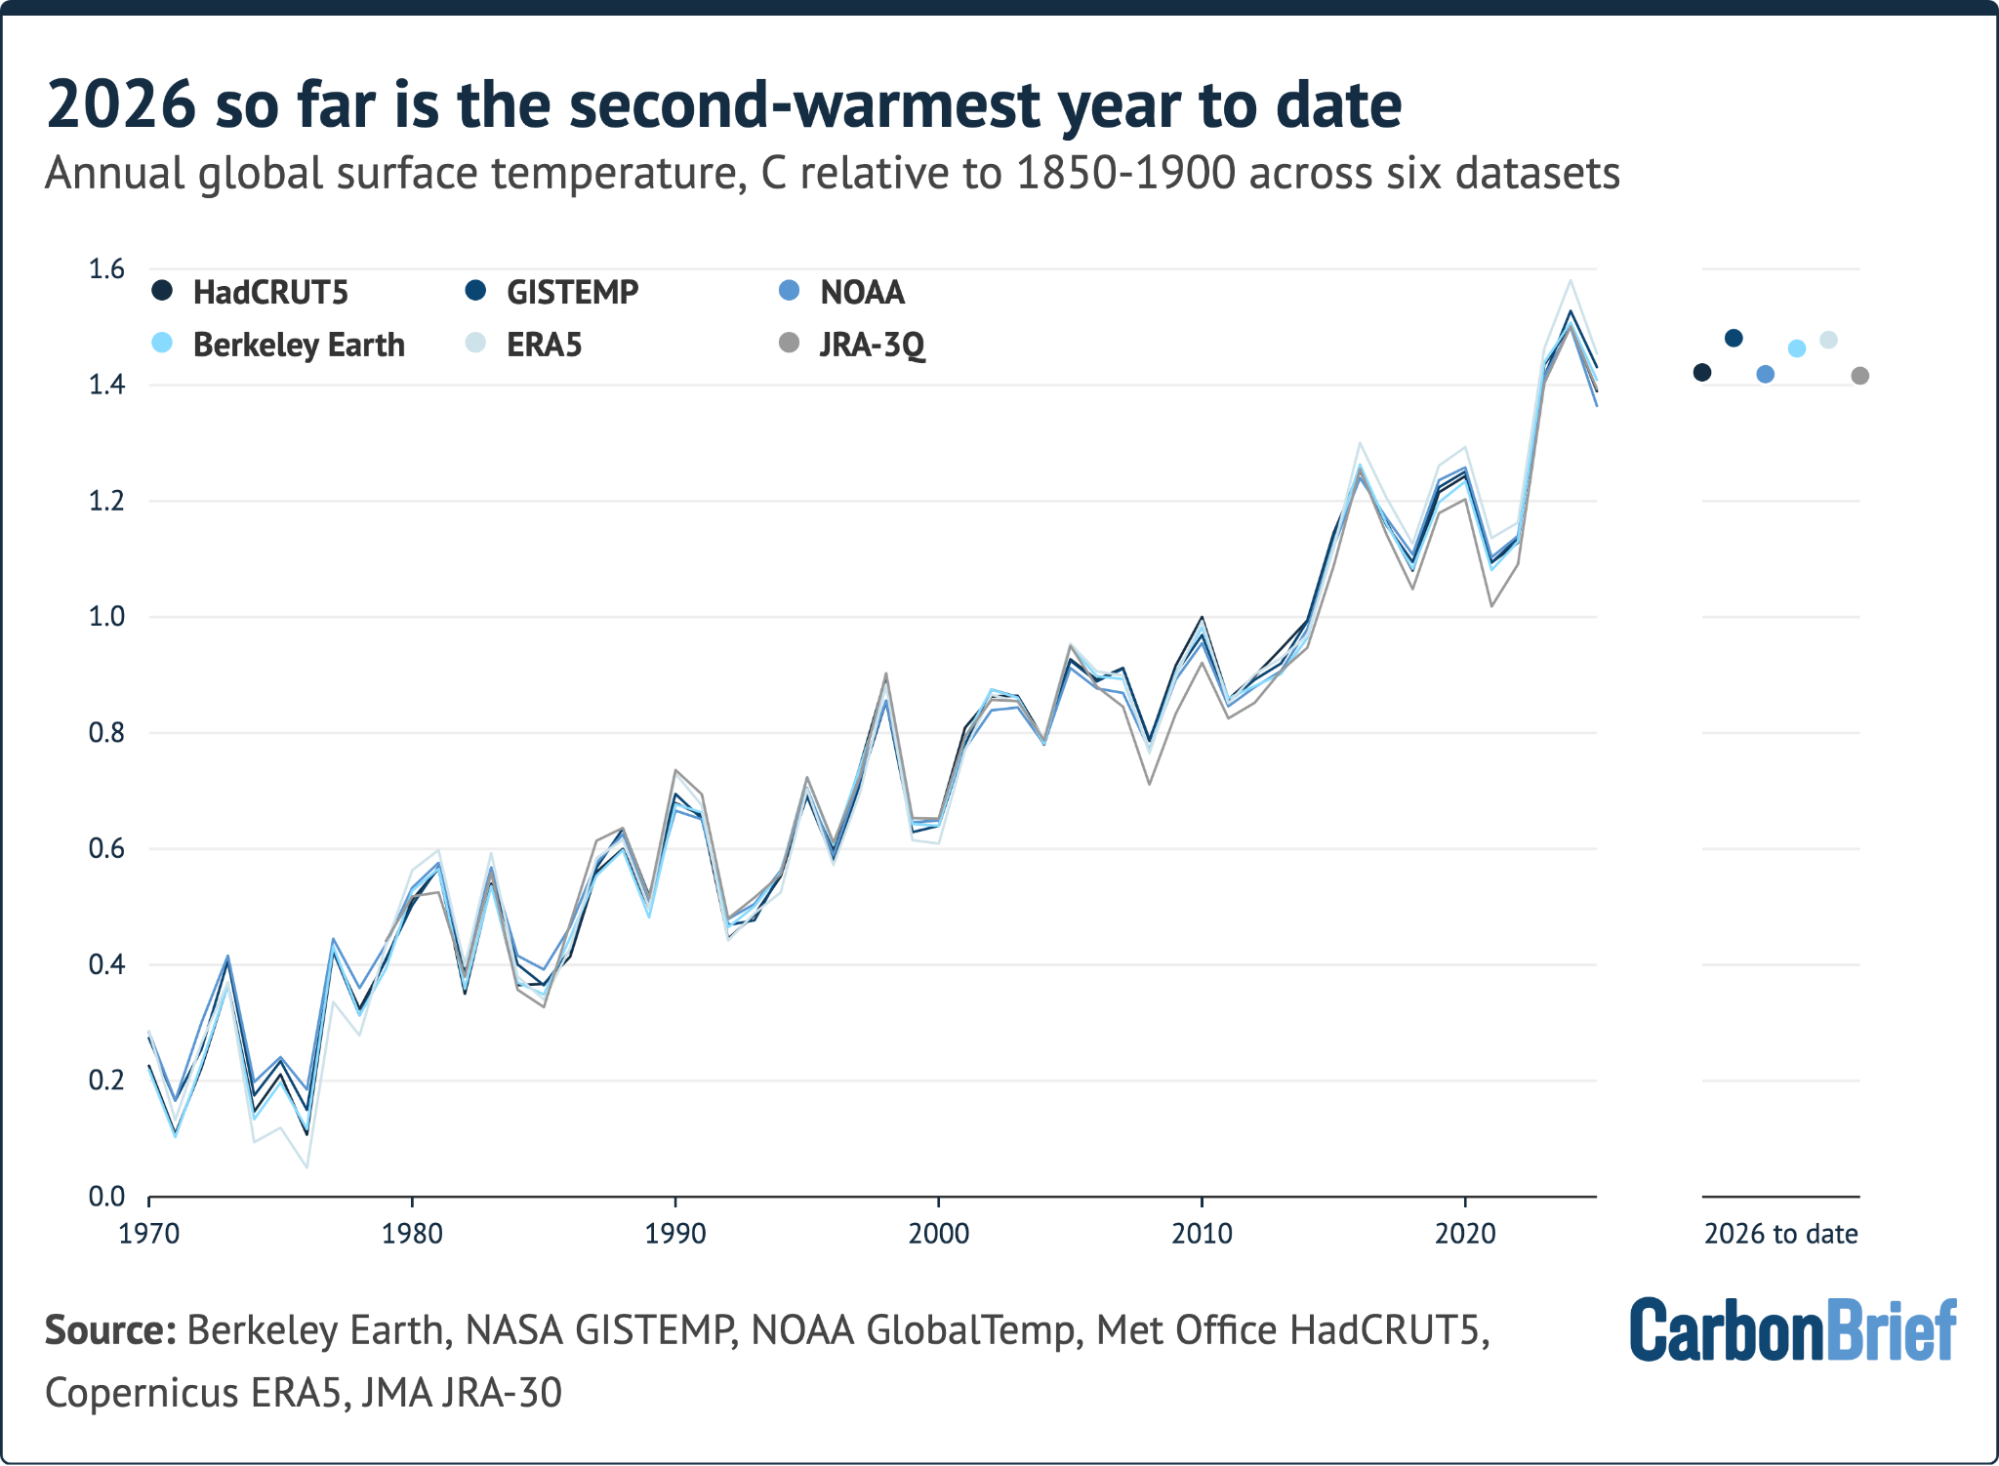 Global mean surface temperatures datasets aligned on a common 1981-2010 baseline, then shifted by the average 1850-1900 to 1981-2010 warming (0.67C) in HadCRUT5, NOAA and Berkeley Earth. 2026 to-date dots are staggered horizontally to avoid overlaps and the HadCRUT5 is for January-August as September data was not available at time of publication.
The year got off to a comparatively slow start. Each month from January to June ran cooler than the same month in 2024, as the lingering effects of weak La Niña conditions gave way to a developing El Niño.
La Niña and El Nino are the cool and warm phases of the El Niño-Southern Oscillation (ENSO), a recurring climate pattern in the tropical Pacific that reshapes weather patterns around the world.
That changed in the third quarter of the year. July 2026 was the second-warmest July in the six-dataset average and a narrow record in the NASA GISTEMP and NOAA datasets. (NOAA's own assessment described it as tied with July 2024.)
August then set a new record for the month by around 0.12C in the six-dataset average. It was the warmest August on record in every one of the six datasets, by margins ranging from 0.07C (HadCRUT5 and NOAA) to 0.13C (ERA5).
September temperatures stalled a little following the rise in July and August. At around 1.62C, it was the second-warmest September on record in all five datasets to have reported so far, around 0.08C below the record set in September 2023.
The figure below shows each month of 2026 alongside every year since 1940, with 2023, 2024 and 2025 highlighted.
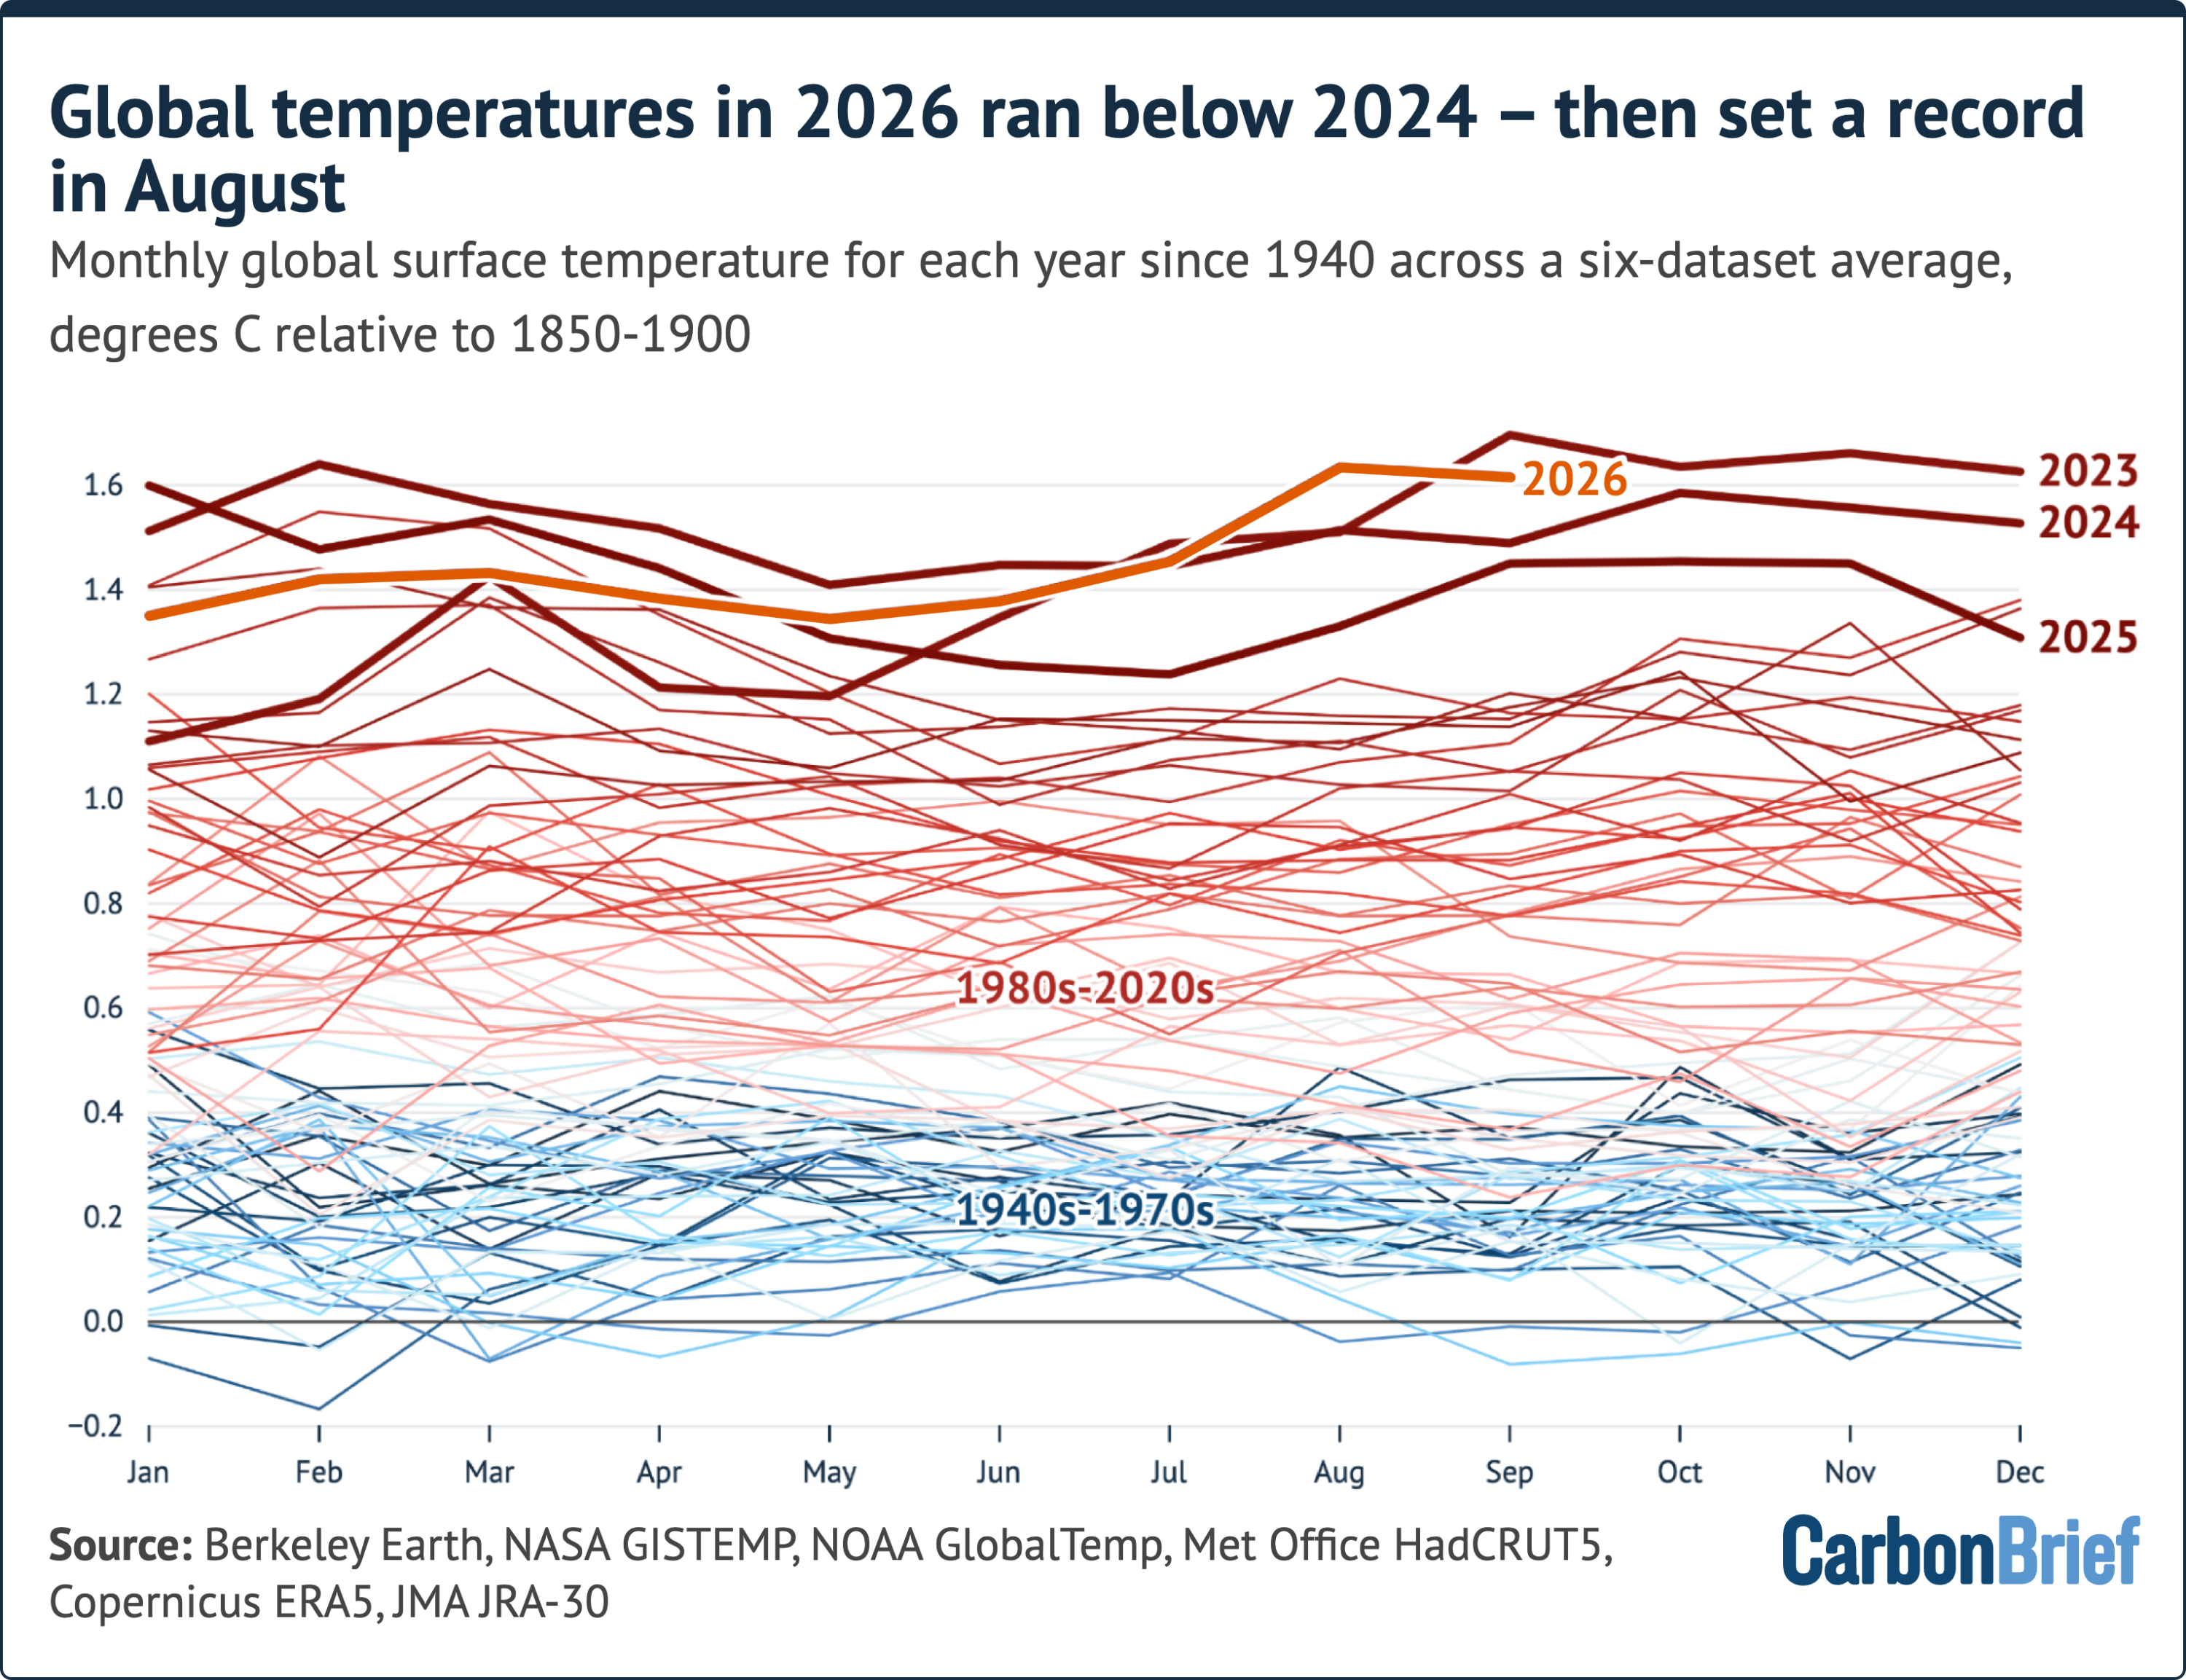 Monthly averages of six global mean surface temperature datasets. The September datapoint excludes HadCRUT5 which had not reported at the time of publication.
Across the six-dataset average, July-September 2026 was effectively tied with the same period in 2023 as the warmest on record, at around 1.57C. It ranked first in GISTEMP and NOAA (and in HadCRUT5 for July-August), and second in Berkeley Earth, ERA5 and JRA-3Q.
The figure below shows the January-September average for every year since 1850. It shows how temperatures in 2026 to date sit at 1.45C - around 0.06C below 2024.
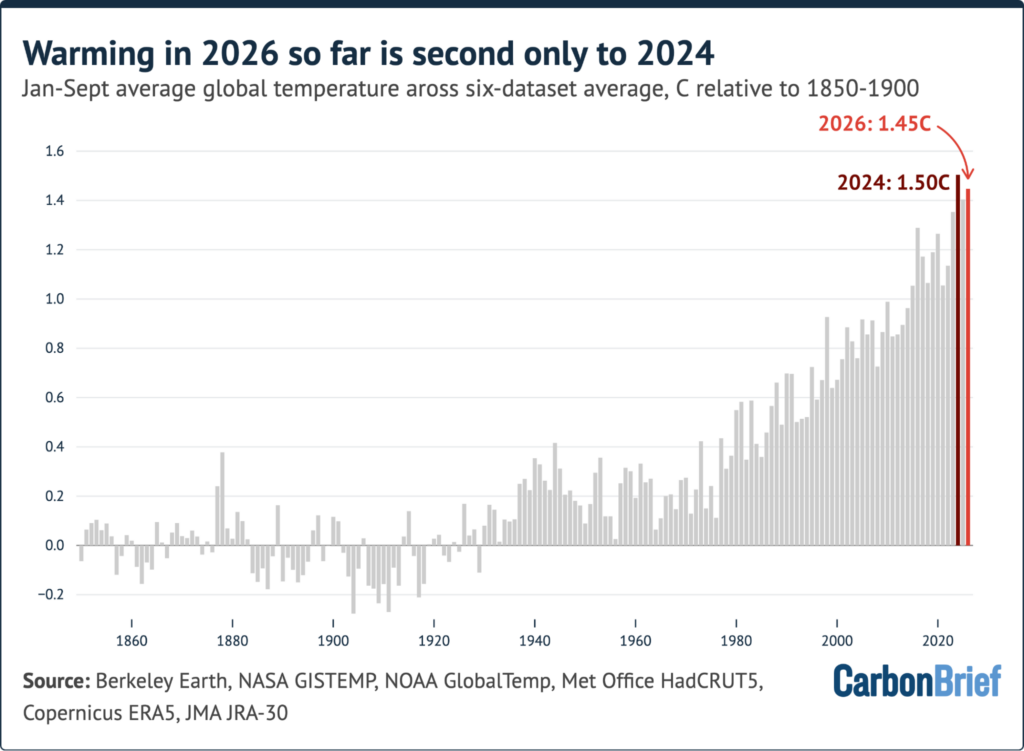 A record-setting El Niño event
In September, El Niño crossed a milestone. The daily sea surface temperature anomaly in the "Niño3.4" region of the tropical Pacific - the area most widely used to gauge El Niño strength - broke the record, previously set in November 2015, to become the strongest event since the satellite era began in 1981.
This year's El Niño has remained above that record every day since. September recorded the highest monthly Niño3.4 region temperature anomaly since records began in the mid-1800s.
As of 18 October, the daily value stood at around 3.5C above the 1996-2025 average for the time of year and around 0.4C above the 2015 peak.
The figure below shows how El Nino is projected to keep intensifying until the end of this year.
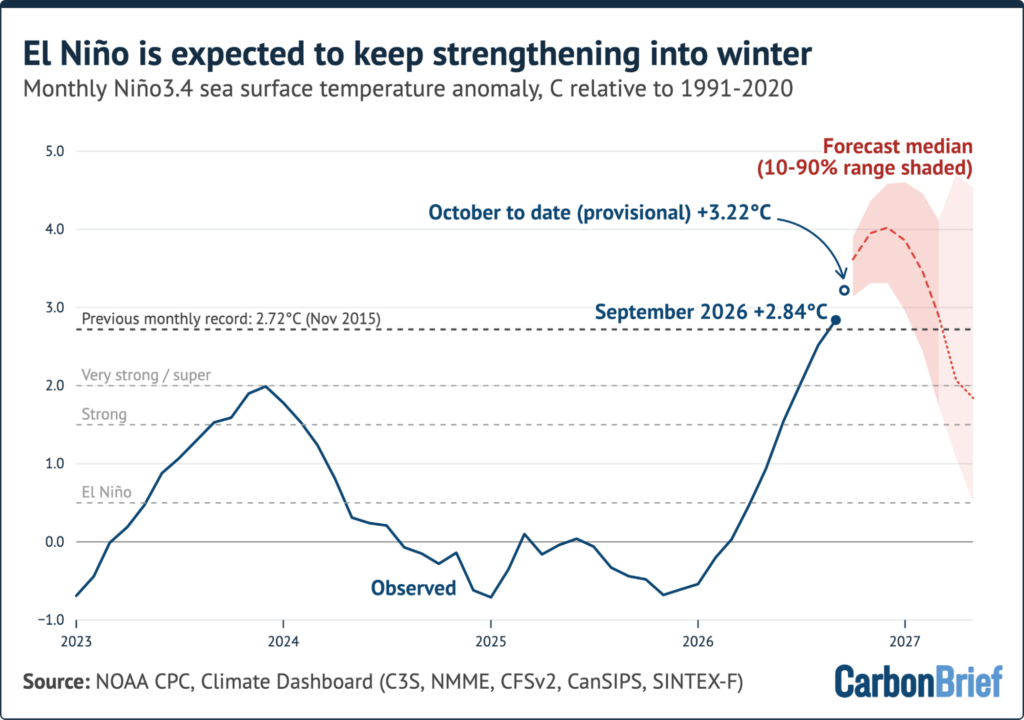 Average of 656 forecasts across 14 dynamical models. The lighter shaded area reflects the period when only seven models are available.
Carbon Brief examined 656 forecasts from 14 different climate models that were run between late September and mid-October. On average they estimate that this year's El Niño will peak around 4C in December - more than 1C above the prior record.
(Ten models expect a December peak and four anticipate a November peak.)
Based on an analysis of tree rings and coral sediments, it is possible that this will be the strongest El Niño event in a millennium.
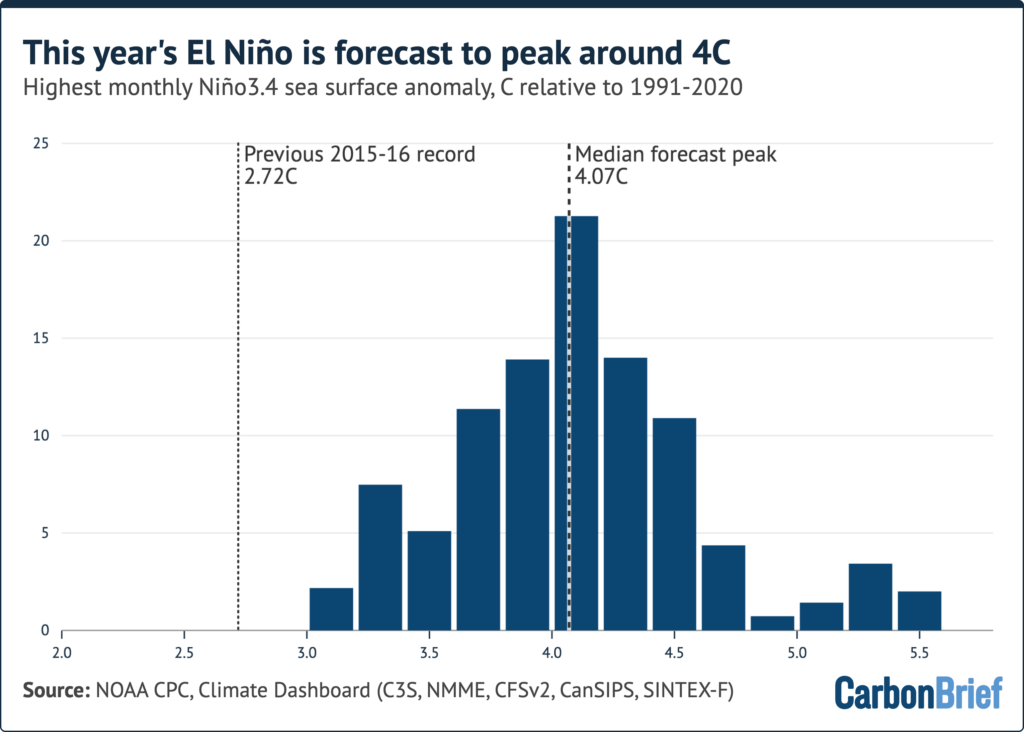 Niño3.4 region sea surface temperature peak warming projected from 656 runs of 14 different dynamical El Niño models. Y-axis denotes the share of model runs in each 0.2C "bin".
The forecasts have strengthened since Carbon Brief's July "state of the climate" update, when El Niño was expected to peak around 3.6C.
While human emissions of CO2 and other greenhouse gases are responsible for effectively all of the Earth's long-term warming, temperatures in any given year are strongly influenced by short-term variations to the Earth's climate associated with El Niño and La Niña events.
Global temperatures tend to lag the tropical Pacific by around three months, which means an El Niño peaking around the end of 2026 will have its largest effect on global temperatures in 2027.
Record heat across much of the worldIn addition to high global average surface temperatures, the past three months have seen records broken across many parts of the planet.
The map below shows July-September 2026 temperatures relative to the 1981-2010 average in the ERA5 reanalysis.
Globally, temperatures were 0.96C above that 30-year period and 1.58C above the ERA5 1850-1900 pre-industrial average.
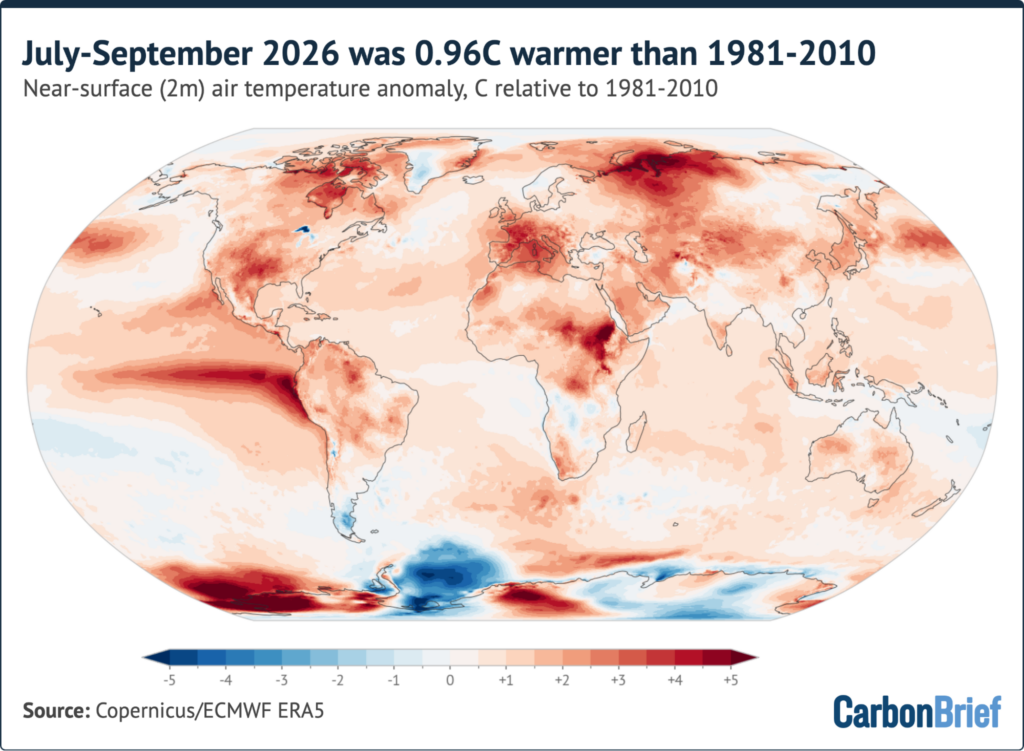
The El Niño is clearly visible as a band of exceptional warmth stretching across the eastern and central tropical Pacific, with temperatures more than 4C above average off the coast of Ecuador and Peru.
Western Europe and the Mediterranean were also unusually warm, with temperatures around 3C above average over France and the western Mediterranean Sea. North-west Russia, the Canadian Arctic, south-central North America, eastern Africa and parts of west Antarctica were also exceptionally warm.
The most notable part of the planet that was colder than usual was the Weddell Sea sector of Antarctica, which came in at more than 2C below average for the season.
The map below shows how July-September 2026 ranked against every year in the ERA5 record (1940-2026) at each location. Areas in dark red saw their warmest July-September on record; blues show areas among the five coldest.
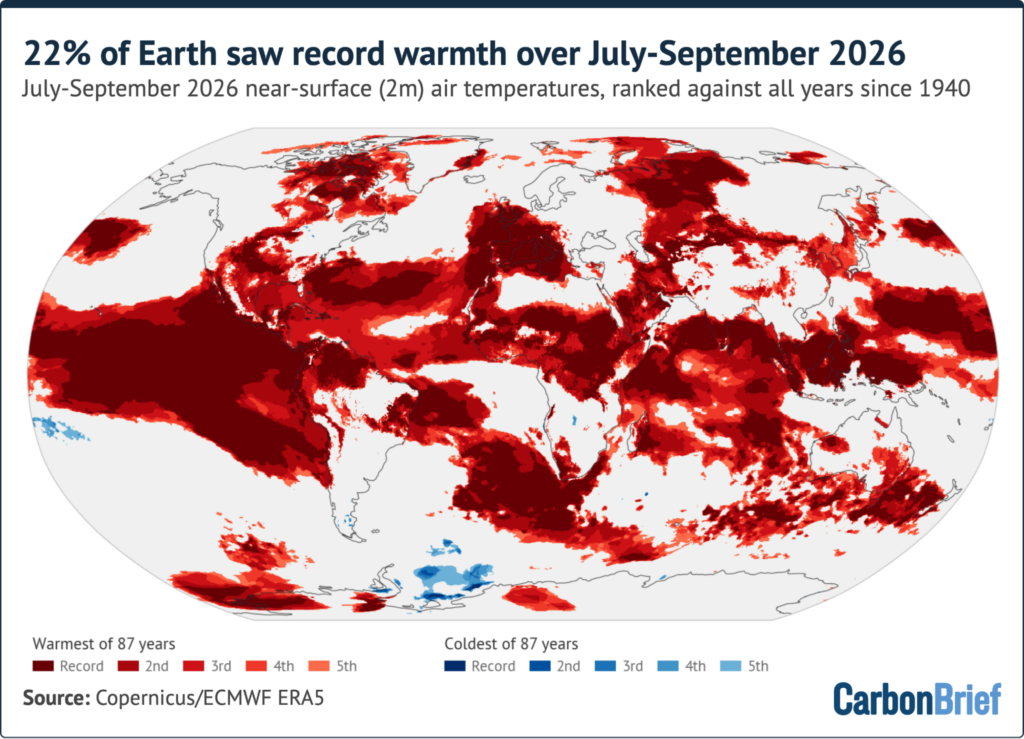 Areas where hot and cold records were set from July-September 2026 compared to the same period in all other years since the ERA5 dataset began in 1940. Share of global surface: 21.5% record warm, 49.9% top-five warm, 0.5% top-five cold and <0.1% record cold.
Around 22% of the world's surface saw its warmest July-September on record and around half experienced one of its five warmest. By contrast, around 0.5% of the world saw one of its five coldest July-September periods.
Record warmth covered most of the El Niño region (including more than 90% of the Niño3 and Niño3.4 regions) along with sizeable parts of the south Atlantic (39%), the tropical Indian Ocean (34%) and the subtropical North Atlantic (25%, with 85% in its five warmest).
On land, around 85% of France and Iberia saw a record-warm July-September.
In September alone, around 20% of the world's surface saw its warmest September on record.
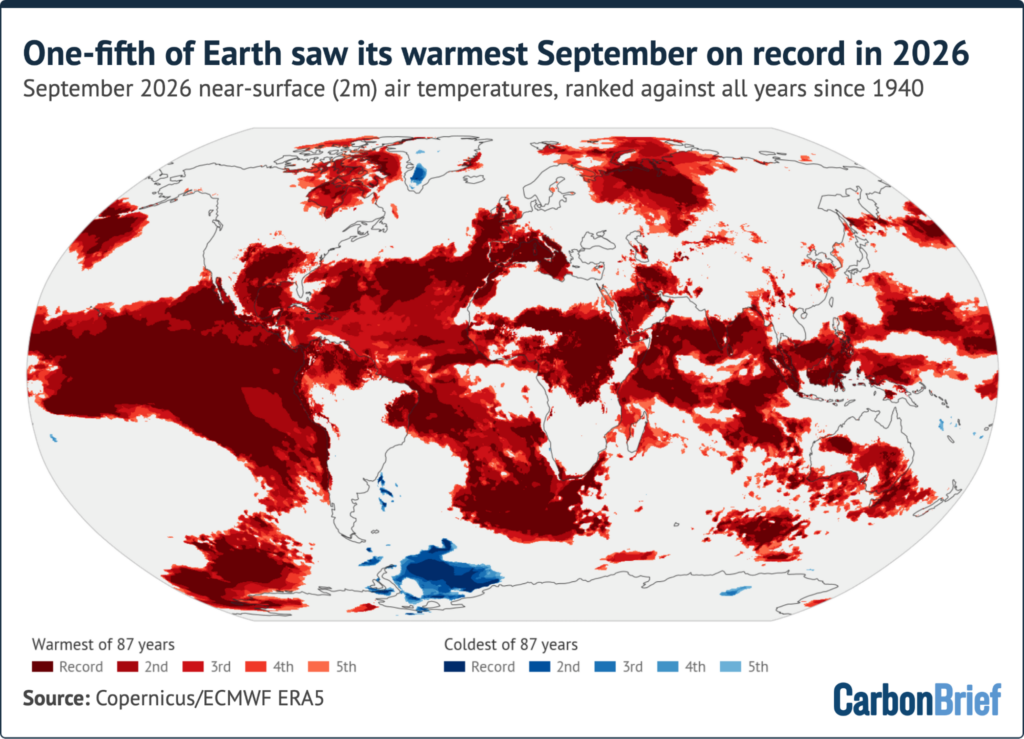
Overall, 55 countries set national records for September average temperatures, including Chile, Colombia, Italy, Kenya, Nigeria, the Philippines, Portugal, Spain, the United Arab Emirates, US and Venezuela.
Europe had an exceptional summer, with the western part of the continent experiencing its hottest summer on record.
Copernicus reported that western Europe's summer averaged 21.7C - 2.5C above the 1991-2020 average - beating the previous record set in 2003. A record 52% of the continent was exposed to "very strong" heat stress by the end of the season.
Europe as a whole had its third-warmest summer, behind 2024 and 2022.
France had its warmest July on record, at 3.8C above the 1991-2020 average. Switzerland had its hottest summer since records began, averaging 17.2C.
The heat persisted into the autumn in south-west Europe. Spain had its warmest September on record, at 3.4C above the 1991-2020 average. This beat the previous record set in 1987 by a remarkable 0.7C.
Rivers across Europe saw their lowest summer flows since the European Flood Awareness System's records began in 1992. By early September, the area burned across the EU was almost twice the 2006-25 average for the time of year, according to Copernicus, extending what had already been a severe fire season.
Elsewhere, the contiguous US had its hottest summer on record and its warmest September, with around 59% of the country in drought conditions.
India's monsoon, which tends to weaken during El Niño years, ended with 12.6% less rainfall than normal, the driest in 11 years.
This year's El Niño event has strongly impacted the hurricane season, suppressing the formation of hurricanes in the Atlantic while contributing to a record-setting number of tropical cyclones in the Pacific.
Good odds of being world's warmest yearCarbon Brief's projection for average global temperature for 2026 combines observed temperatures through September with the latest forecasts of the strength of El Niño. It uses a statistical model trained on the historical relationship between year-to-date temperatures, El Niño conditions and annual temperatures.
The figure below shows the six-dataset average for each year since 1970 (dark blue), the year-to-date January-September 2026 average (blue circle) and Carbon Brief's 2026 estimate (red circle) with its 90% likelihood range (vertical red line).
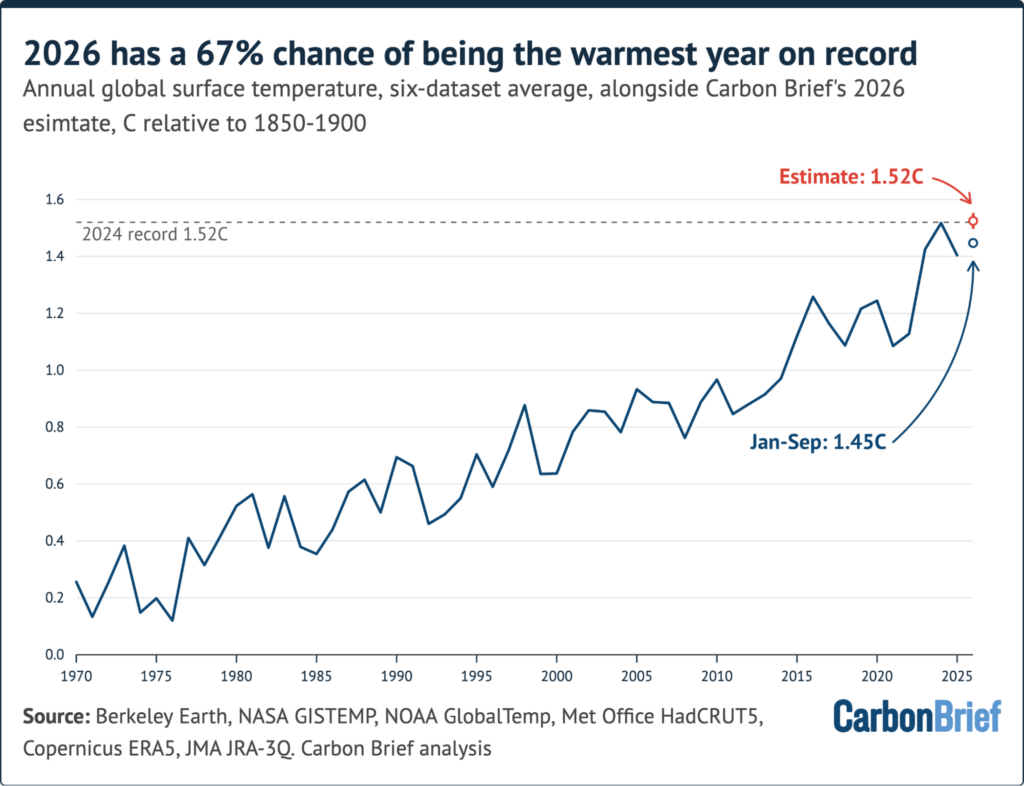 The dark red dot marks Carbon Brief's median projection for 2027, the bar the 50% range and line the 90% range.
The best estimate for 2026 is now around 1.52C above pre-industrial levels, with a 90% range of 1.50C to 1.55C. This is slightly higher - but effectively tied with - the prior record of 1.52C set in 2024.
It marks a slight increase from Carbon Brief's previous projection of 1.51C, set out in its July's "state of the climate" update.
There is an approximately 67% chance of setting a new record this year in the average of the six-datasets examined.
The year 2026 also has a 93% chance of coming in above 1.5C in the six-dataset average (though not in every individual dataset), which would make it the second year above 1.5C, after 2024.
However, a single year above 1.5C does not itself constitute a breach of the Paris Agreement goal, which reflects a longer-term average.
These odds also depend on assumptions that are hard to pin down.
The El Niño forecast for October-December lies beyond any event in the record the model is trained on. The projection assumes the historical relationship between the strength of El Niño and its impact on global temperatures holds for an event this large. If the warming effect of this El Niño turns out to be no larger than that of the strongest past events, the odds of a record year for global temperature would be closer to 50%.
Datasets are split on whether 2026 is headed for a recordDifferent groups of scientific researchers around the world will announce their own results for 2026 in January.
Across the six datasets that Carbon Brief explores there will likely be mixed results, with some datasets showing 2026 as the warmest year on record - and others showing it as the second warmest year.
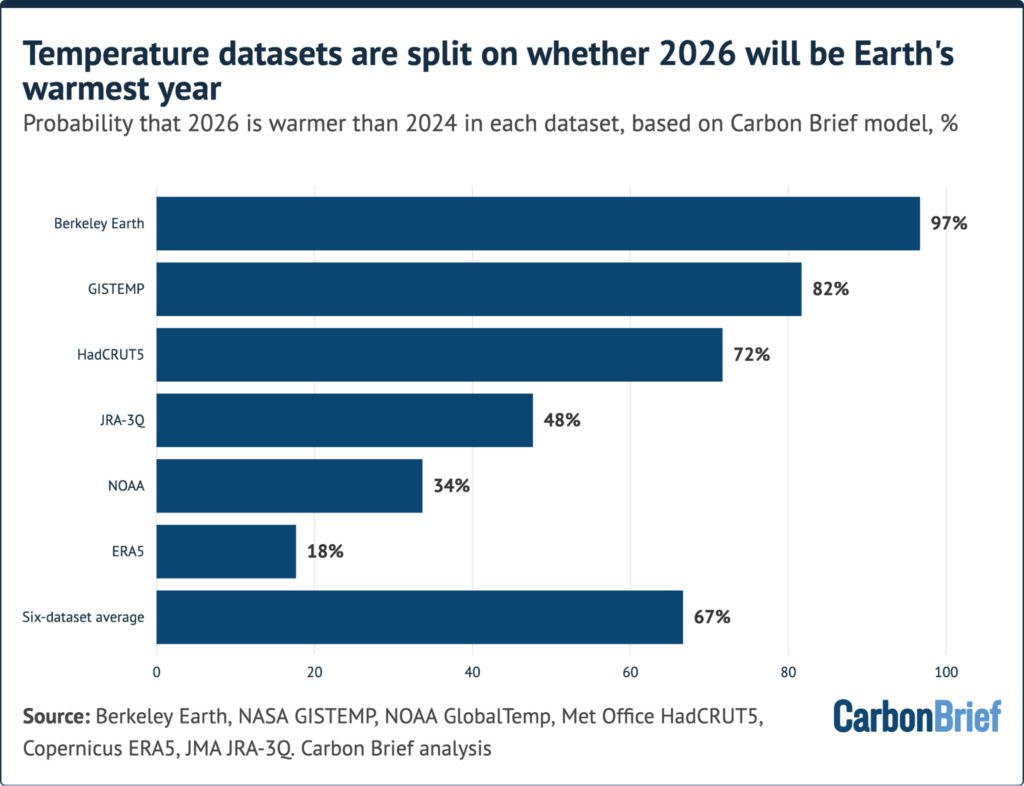 Likelihood of a 2026 record in different datasets using Carbon Brief's model. Carbon Brief's projection is based on each dataset's observations and record. Probability for HadCRUT5 is based on data through August, as September data was not available at time of publication.
Based on temperatures to-date and the current El Niño forecast, Carbon Brief estimates that a 2026 record is very likely in Berkeley Earth (97%) and likely in NASA GISTEMP (82%). It is about as likely as not in JRA-3Q (48%) and NOAA (34%) and unlikely in ERA5 (18%).
HadCRUT5 currently shows a 72% chance of a 2026 record, but this is based on data only through August. Plausible values for September - which the other datasets suggest was slightly cooler than August - would put its odds somewhere between around 50% and 80%.
The difference in odds comes down to how far each temperature group's data for 2026 trails the prior record set in 2024.
For example, over January-September, Berkeley Earth has 2026 around 0.03C cooler than the same months of 2024, so its final three months need to beat those of 2024 by around 0.08C.
ERA5, by contrast, has 2026 around 0.09C behind 2024 over the same period, meaning October-December would need to run around 0.27C warmer than the last three months of 2024.
None of these datasets is "right". They differ in how they fill gaps in regions where fewer observations are taken, such as the poles, and in which sea surface temperature records they use.
The two reanalysis products, ERA5 and JRA-3Q, take a different approach altogether, using a weather model constrained by observations to estimate air temperatures everywhere, rather than combining land and ocean measurements.
There is precedent for a split decision. In January 2015, NASA and NOAA announced that the year 2014 was most likely the warmest on record, while the Met Office described it as tied with 2010. January 2027 could see something similar.
2027 very likely to be the warmest year on recordThe biggest temperature effect of this year's El Niño event will be felt next year. Just as the 2015-16 El Niño helped make 2016 the then-warmest year on record, an event peaking around the end of 2026 will have its largest influence on global temperatures in 2027.
Carbon Brief projects 2027 will end up at around 1.74C above pre-industrial levels, with a relatively wide 90% uncertainty range of 1.54C to 1.95C.
This is based on the historical relationship between year-on-year temperature changes and El Niño conditions in the preceding autumn, factoring in the remaining uncertainty around where temperatures in 2026 will end up.
The figure below shows the six-dataset average for each year since 1970 (dark blue), along with Carbon Brief's projections for 2026 (orange) and 2027 (red).
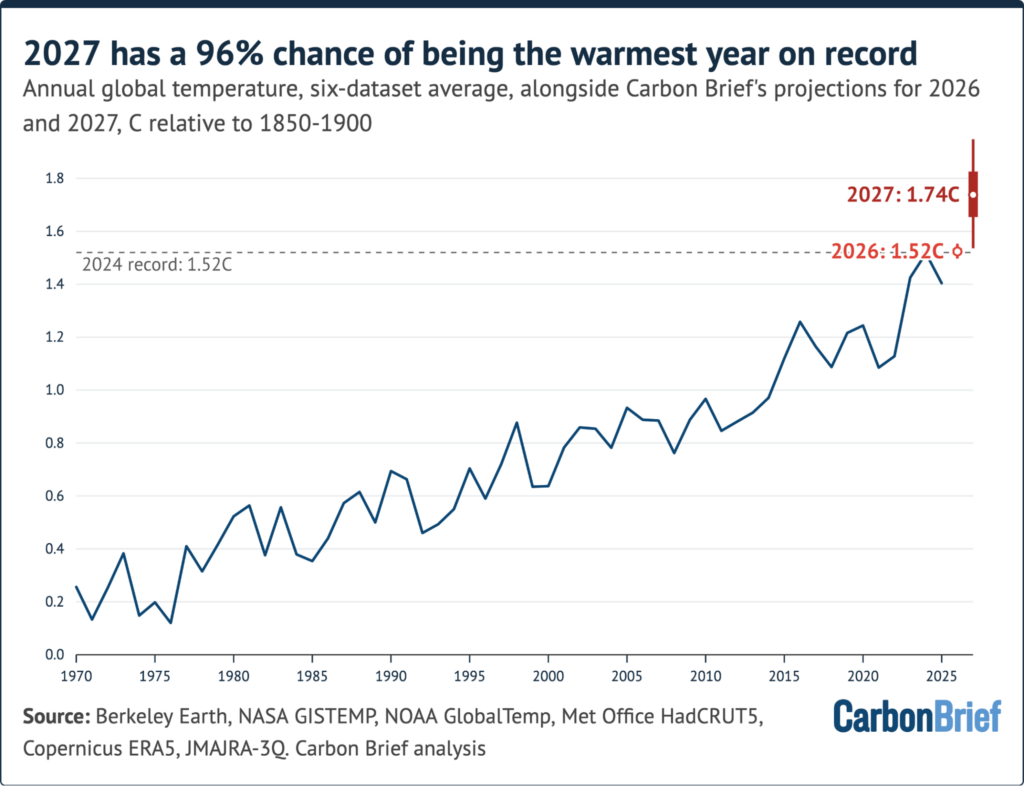 The dark red dot marks Carbon Brief's median projection for 2027, the bar the 50% range and line the 90% range.
This gives 2027 a 96% chance of being warmer than any previous year, including 2026. There is a 98% chance that at least one of 2026 or 2027 will set a new record.
The estimate for 2027 is necessarily much more uncertain than for 2026. None of the year has been observed yet and the result depends on both the peak strength of the El Niño and how quickly it fades.
As noted above, this year's El Niño strength is currently projected to peak well beyond the strongest event in the record on which Carbon Brief's model is trained. Carbon Brief predicts a rise in temperatures between 2026 and 2027 of around 0.2C due to El Niño - larger than the jump that followed any previous El Niño events. The projection assumes the historical relationship between El Niño and global temperatures will hold for an event this large, but it remains to be seen whether this is the case.
Nevertheless, even an average global temperature on even the low end of the range (1.54C) would exceed 2024 and, while Carbon Brief's central estimate of 1.74C would beat it by more than 0.2C.
If these projections bear out, the 2020s will have delivered new records in 2023, 2024, 2027 and, quite possibly, 2026.
Earth's energy imbalance has more than doubledThe rise in global temperatures is a symptom of Earth's rising energy imbalance. This is the difference between the energy the planet absorbs from the sun and the energy it radiates back to space.
As long as this energy imbalance is positive, the Earth system accumulates heat, around 90% of which ends up in the oceans.
Earth's energy imbalance has more than doubled in recent decades. This growing imbalance means the planet is accumulating heat ever faster and that global warming is accelerating.
NASA's CERES satellite instruments have tracked changes in this imbalance at the top of the atmosphere since March 2000.
The figure below shows the Earth's energy imbalance from 2000 to August 2026, with monthly values (faint line), 12-month averages (dark blue), calendar-year averages (dots) and the linear trend (red dashes).
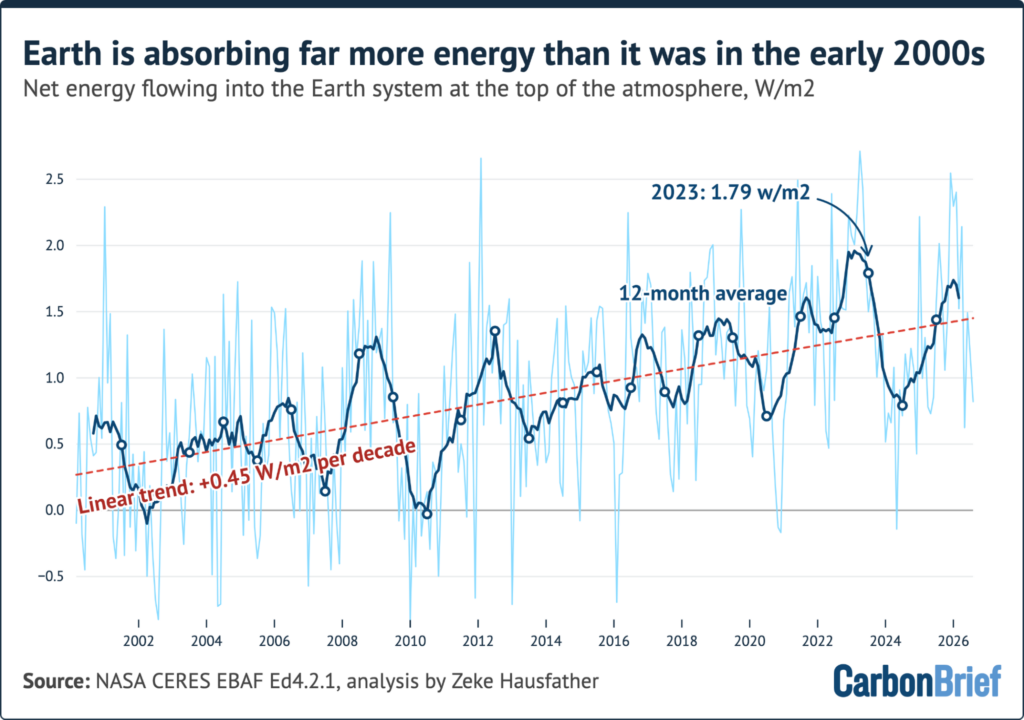 Earth energy imbalance measured by NASA's CERES satellites.
The Earth's energy imbalance rose from an average of around 0.53W/m2 over the first decade of the record (March 2000 to February 2010) to around 1.25W/m2 over the most recent decade (March 2016 to February 2026) - a 2.4-fold increase.
The highest annual energy imbalance recorded to date was in 2023 at 1.79W/m2, while the most recent 12 months (September 2025 to August 2026) averaged at 1.59W/m2.
Several studies, including 2026 research covered by Carbon Brief, have noted that the imbalance appears to have risen faster than most climate models simulate, though the reasons remain unclear.
The measurements also come with some caveats. CERES tracks changes in the imbalance well, but its absolute level is anchored to ocean heat content measurements. Changes to satellite orbits over time add a further uncertainty of around 0.1W/m2 per decade to the trend.
A 2021 study found that independent satellite and in situ observations "each yield statistically indistinguishable decadal increases" in the imbalance between 2005 and 2019.
Over longer periods, CERES shows more energy being accumulated than ocean heat estimates set out by Institute for Atmospheric Physics data and by the authors of the Indicators of Global Climate Change report.
The imbalance typically dips as a strong El Niño peaks and the ocean releases heat to space, as it did in 2024. Next year's energy imbalance may be slightly lower.
Arctic sea ice minimum tied for 10th lowest, Antarctic near record lowsAround mid-September of each year, Arctic sea ice drops to an annual low, whereas Antarctic sea ice grows to its largest area of the year.
On 12 September, Arctic sea ice reached its annual minimum extent, at 4.60m square kilometres (km2) on the five-day average used by the US National Snow and Ice Data Center (NSIDC).
The 2026 minimum shares the 10th lowest spot - alongside 2008, 2010 and 2025 - in the nearly 48-year satellite record and was 1.21m km2 above the record low set in 2012, according to NSIDC.
That represents a modest recovery from earlier in the year, when Arctic sea ice set, or tied, record daily lows on 39 days between January and 2 July, following a joint-lowest winter maximum.
Arctic sea ice extent has not set, or tied, a daily record low since 2 July and has been within the 1979-2010 range for the time of year since the start of August, though still well below the long-term average.
(As Carbon Brief has previously explained, conditions earlier in the year are a poor predictor of the September minimum).
In the southern hemisphere, Antarctic sea ice reached its winter maximum on 14 September, at 17.59m km2. This was the third lowest on record, behind only 2023 and 2024. It recently fell sharply and hit record daily lows for much of the period since early October.
The figure below shows daily Arctic and Antarctic sea ice extent in 2026 (solid lines), compared with the 1979-2010 range (shading) and the record low for each day (dotted line).
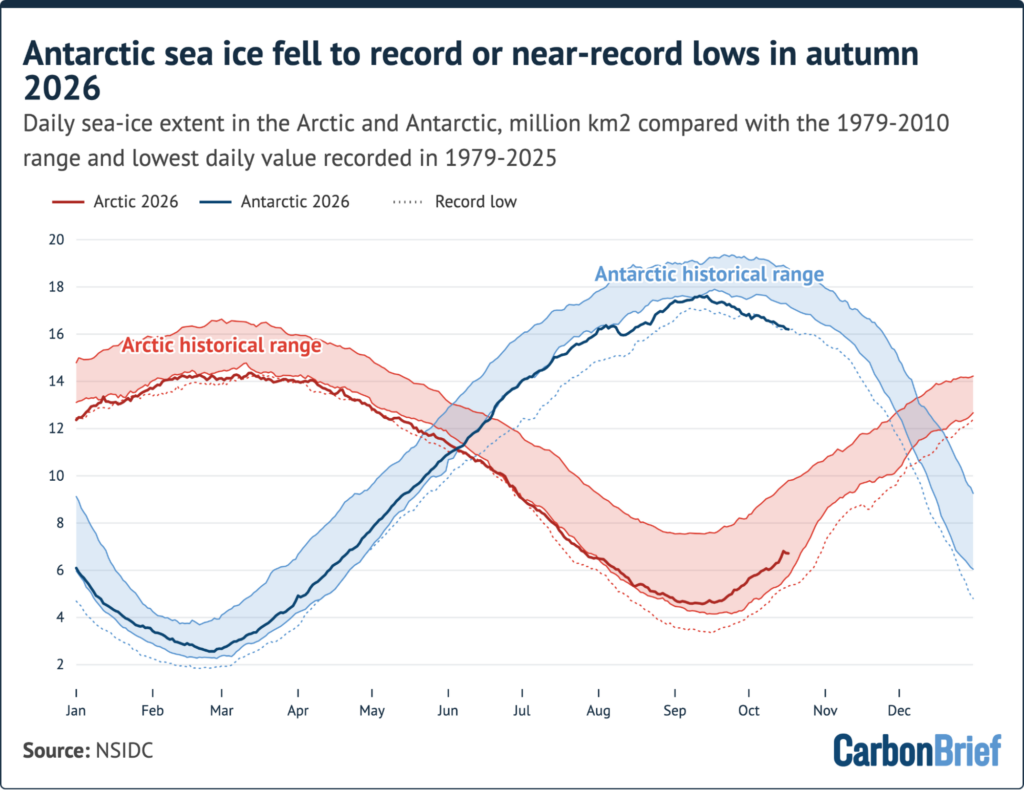 Daily Arctic and Antarctic sea ice extent in 2026 compared to the prior record low and the 1979-2010 historical range. 2026's data runs until 17 October. Arctic minimum and Antarctic maximum calculated using NSIDC's five-day mean.
related
 Experts: How are climate scientists using artificial intelligence?
22.10.2026
Climate modelling
 UNEP: Opportunity has 'been lost' to meet 1.5C warming limit without 'overshoot'
21.10.2026
Climate pollutants
 Guest post: Why tough methane cuts are crucial for keeping warming 'well-below' 2C
01.09.2026
Climate pollutants
 Explainer: The CMIP7 emissions scenarios - and how they explore future climate change
01.09.2026
Climate modelling
The post State of the climate: 2026 likely to tie with 2024 as the warmest year on record appeared first on Carbon Brief.
- Just transition
- Climate finance
- Adaptation and mitigation
- Global stocktake and NDCs
- Action agenda and other issues
Delegates will soon gather in the Turkish resort city of Antalya for UN climate negotiations, against a backdrop of war, energy crisis and climate extremes.
At COP31, nations will try to find agreement on various issues, including climate finance for developing countries and a global "just transition" towards a cleaner economy.
This summit is unusual due to its joint presidency, which means that Australia is leading the negotiations while Turkey hosts the conference.
Outside the formal negotiations, Turkey is also pushing its own priorities as part of a wider "action agenda", including electrification, oceans and "green industrialisation".
In order to track parties' positions on key negotiating points and wider issues at COP31, Carbon Brief has analysed around 100 documents and captured them in the interactive table below.
The first column shows the countries and UN negotiating blocs, the second shows the topics up for debate and the third indicates specific issues within those topics.
The final column indicates the positions that the parties have expressed on each topic. These range from "priority" - meaning the party is likely to be pushing the issue - to "oppose", meaning it is likely to push against it.
This is a "living document" that will be updated over the course of COP31.
Please get in touch if you would like to offer additions by emailing policy@carbonbrief.org.
Brief explanations of the key issues and jargon-filled language that permeate the talks can be found below the interactive table.
@media screen and (max-width: 895px){ .editorial-iframe{ height: 1100px !important } } @media screen and (max-width: 459px){ .editorial-iframe{ height: 1170px !important } } @media screen and (max-width: 370px){ #tableIframe.b-wide-image{ padding:0px !important } } Just transitionAt COP30 in Brazil in 2025, nations agreed to establish a practical mechanism to help drive a "just transition" to a low-carbon economy.
Key aspects of this "Belém-Antalya mechanism" (BAM) - often referred to as the "just transition mechanism" (JTM) - were agreed during the June climate negotiations this year, but many details are missing and dividing lines remain between parties.
Parties have disagreed about the scope of the mechanism and whether it should be tied to the provision of finance.
Nevertheless, following progress in June within the "just transition work programme" (JTWP), civil society groups highlighted that getting the mechanism up and running is a "key expected outcome" from COP31.
Climate financeClimate finance is always a highly contested issue at UN climate negotiations.
Developing countries have successfully pushed for a "work programme" on climate finance to feature on the conference agenda.
These parties see this programme as a way to pressure developed countries into providing more funding from their public coffers, specifically under Article 9.1 of the Paris Agreement. Some are even proposing a "burden sharing" arrangement for climate-finance provision.
This comes against a backdrop of major donors cutting their aid budgets and the Trump administration in the US pressuring multilateral development banks (MDBs) to drop their climate objectives.
Developed countries, which have traditionally been responsible for providing finance, would prefer to keep a broader focus on issues such as improving access to existing finance and broadening the range of donors. Some developing countries, such as small-island states, also support these goals.
Nations have also been discussing Article 2.1c of the Paris Agreement under the "Veredas dialogue". This focuses on making all global "financial flows" consistent with climate action.
Countries have different views about what this involves, with developing countries again hoping to keep the focus on developed countries' responsibilities to financially support them.
Adaptation and mitigationAt negotiations in June, parties were unable to agree on the details of a "global goal on adaptation" (GGA), which is intended to drive climate adaptation worldwide.
Having agreed at COP30 on a list of 59 "indicators" - ways to assess progress towards the GGA - nations now need to refine these before COP32 in Addis Ababa, Ethiopia. This is a highly technical process that involves a taskforce working out how to use and track these indicators.
Broadly, developing countries stress the importance of finance to fund adaptation efforts, rather than simply to track progress. They also want reassurances about a pledge made last year to "triple adaptation finance".
At the June climate negotiations, negotiators also failed to make any progress when discussing the mitigation work programme (MWP) - the only formal agenda item that concerns cutting greenhouse gas emissions.
Among other things, parties disagreed on whether the MWP should continue running over the next few years, or simply be brought to a close.
Global stocktake and NDCsBack in 2023, the first "global stocktake" (GST) of the Paris Agreement set out the state of climate action and what needed to be done to set the world on course.
On mitigation, nations agreed to a package of measures, including "transitioning away from fossil fuels", tripling renewable energy and "halting and reversing deforestation" by 2030.
Some of these outcomes remain contentious among certain parties, particularly large, developing countries and those with economies that rely on fossil-fuel exports.
Developing countries have persistently argued that they need more climate finance to implement the global stocktake outcomes.
Parties were meant to update their climate plans under the Paris Agreement, informed by the first global stocktake, by 2025. These plans, known as nationally determined contributions (NDCs), cover the period out to 2035.
So far, only 150 parties - responsible for three-quarters of global emissions - have submitted new NDCs.
Iran, Vietnam, Egypt and Argentina are among those without new NDCs - and the US has withdrawn its climate plan under the Trump administration.
Some parties, such as the EU, have stressed the need for countries to submit their new NDCs ahead of COP31 - and to ensure they are aligned with the 1.5C temperature limit.
COP31 will also see the launch of the second global stocktake, which will conclude in 2028.
Action agenda and other issuesTurkey will be pushing its "action agenda" priorities at COP31, including global targets for electrification, reducing waste and reducing building-sector emissions.
(The Australian "presidency of negotiations" is intending to pursue a "cover text" decision at COP31 that may capture some of these wider targets, such as the electrification goal.)
The action agenda is meant to provide a complementary track to the formal negotiations, where governments and non-state actors can advance specific, real-world solutions.
A new COP31 presidency effort dubbed the "climate implementation bridge" is also meant to complement these ambitions by turning NDC goals into an "investable project portfolio"
Some parties have explicitly signalled their support for various elements beyond the formal negotiations, in the run-up to COP31.
For example, a joint letter signed by 105 parties called for COP31 to "put the ocean at the heart of climate action" by embedding ocean-based climate action in the UNFCCC architecture.
Experts: What China wants from the COP31 climate talks
29.10.2026
China policy
Interview: COP31 president says electrification is 'surest way to protect citizens'
10.07.2026
COP31 Antalya
Bonn climate talks: Key outcomes from the June 2026 UN climate conference
19.06.2026
Adaptation
The post Interactive: Who wants what at the COP31 climate change summit appeared first on Carbon Brief.
- Formal negotiations
- Finance
- Global review
- Global report
- Digital sequence information
- Harmful subsidies
- Marine biodiversity
- Planning, monitoring, reporting and review
- Article 8(j) implementation
- Biodiversity and climate change
- Links with other bodies
- Around the COP
- Armenian presidency
- Protests
- Lobbying and influence
- Carbon and biodiversity markets
Countries have completed the first "global review" of their progress towards reversing nature loss by 2030 at the COP17 biodiversity talks in Yerevan, Armenia.
The review "notes with deep concern" that, unless action is "rapidly accelerated", the goal to reverse nature loss and meet a set of 23 targets by 2030 "will not be achieved".
It "urges" countries to accelerate action, including by "increased ambition in addressing the gaps".
Much of the discussions in Yerevan focused on how to raise the necessary funds to help developing countries protect nature.
Some major economies pushed to expand the range of nations that are expected to provide finance, with countries agreeing at the end of the two weeks of talks that non-donors that want to contribute can "signal interest" before COP18.
This came after developed countries failed to meet a target to significantly ramp up nature finance over the last few years.
It also came as a landmark fund agreed at COP16 in Colombia to pay communities for the genetic resources derived from nature stands nearly empty two years on.
The Yerevan talks marked the halfway point of the "Kunming-Montreal Global Biodiversity Framework" (GBF), the "Paris Agreement for nature" first made in 2022 and due to be achieved by 2030.
During the nearly 12-hour-long final plenary, countries voted for Quito, Ecuador, to host the COP18 nature talks, which will be held in 2028.
Countries managed to sign off on all the major negotiation texts, marking a stark contrast to COP16, which ran so far over time that the Colombian presidency lost "quorum", forcing talks to resume in Rome months later.
Below, Carbon Brief has detailed analysis of all of the key outcomes from COP17.
Formal negotiations Finance
Finance, predictably, was at the heart of the discord and deadlock at the Yerevan talks.
At COP17, discussions on finance had to achieve several outcomes.
The first part - to take stock of biodiversity finance mobilised so far to meet the nature deal's goals - fell under the global review.
As the global report noted, developed countries failed to meet their commitments to raise "at least $20bn a year by 2025" for nature. Delegates pointed to falling aid levels and a sharp 27% decline in environmental funding for the 2026-30 period.
The second part was to agree on how to mobilise resources for the next four years, to meet the GBF's goals and targets.
Calls to "broaden the contributor base" of who pays to protect nature - and whether that should include emerging economies - became the most fraught element of the talks. Eventually, countries agreed on what Switzerland described as a "super, mega-delicate" text. It hinged on major "political compromises", with "no major winner or loser", according to Kenya.
Per the decision, countries that want to be included on a list of developed country donors can "signal interest" through bilateral, confidential consultations before COP18 and every alternate COP after.
Finally, countries also agreed on criteria to shape and resource a new, permanent financial mechanism to protect nature after 2030.
However, this did not immediately take the form of a new fund under the COP that biodiverse countries have demanded since 2022, deferring the mechanism's institutional structure to COP18.
Resource mobilisation discussions at the GBF's halfway mark were supposed to agree on how to close the "biodiversity finance gap" and to "increase resources from all sources" to "at least" $200bn per year by 2030, as set out in target 19 of the GBF.
The talks were largely dominated by a push, led by the JUSCANZ bloc of developed countries, to "broaden the contributor base". This could see emerging economies, such as Qatar, China, Saudi Arabia and India, being added to the list of countries that pay to protect nature.
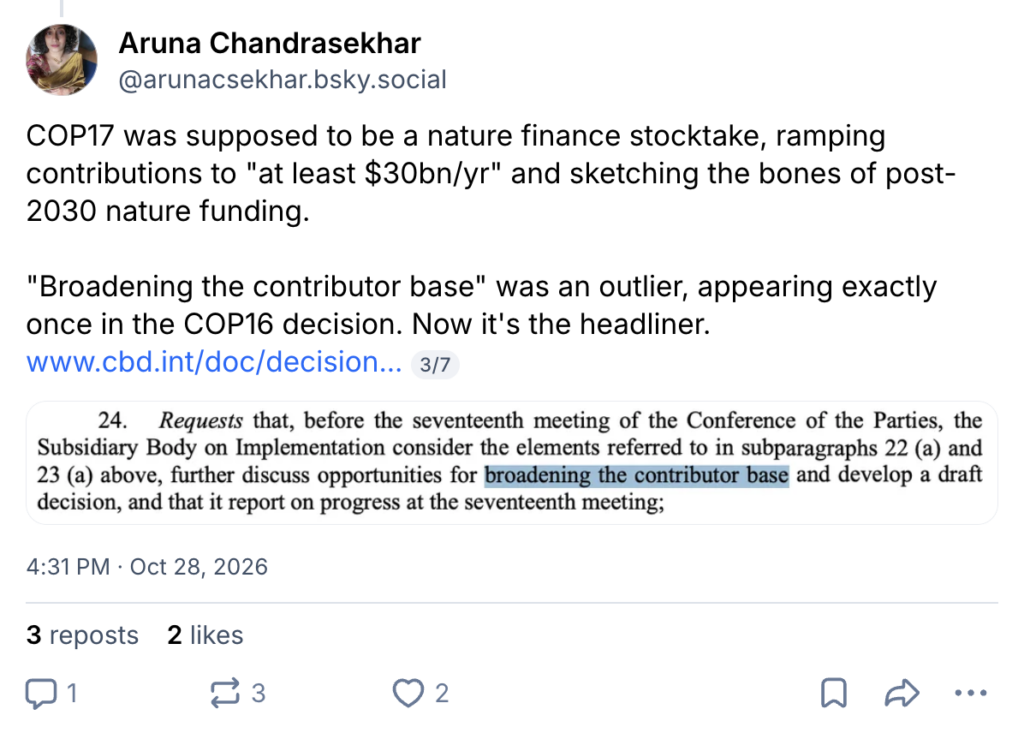
Article 20 of the UN Convention on Biological Diversity (CBD) states that developed countries "shall provide new and additional financial resources" to developing countries to meet the costs of implementing measures to protect nature.
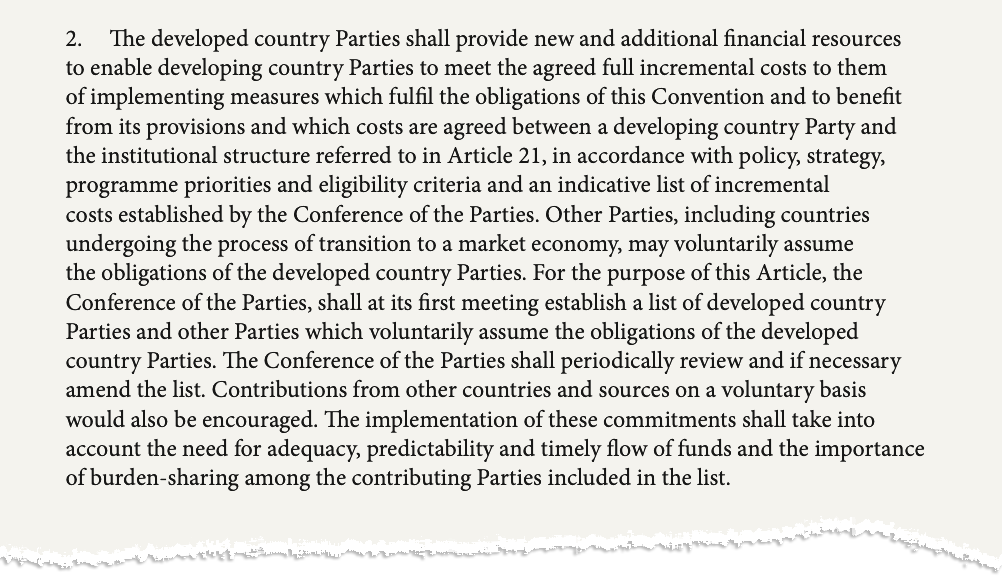 The second paragraph of Article 20 of the UN biodiversity convention. Source: UN CBD
The text states that other countries - including emerging economies - may "voluntarily assume" these obligations to pay. However, it adds that this list of developed countries "shall" be reviewed periodically and amended "if necessary".
The list was last amended in 2006.
(See this "jargon buster" which explains the specific meaning and legal weight of various terms and verbs used in UN formal documents.)
Discussions around this fraught subject had reached a dead end at intersessional talks this year, but resurfaced in Yerevan.
The first "non-paper" had four different options for expanding the contributor base. These ranged from using the World Bank's country income groups "as a proxy" to identify high-income countries, to commissioning a study on the impacts of being included on the list.
By 21 October, the number of options swelled to eight, including two from Saudi Arabia and one from Peru.
Some countries "expressed concern" that certain options were based on a CBD secretariat study on "what constitutes a developed country", Earth Negotiations Bulletin reported.
By the end of the first week, it was clear that the finance deadlock would have to go into informal ministerial consultations for any consensus to emerge.
At a press conference on 28 October, Christopher O'Sullivan, Ireland's nature minister and representing the EU delegation, told Carbon Brief:
"Our position isn't that we want to pull back in terms of contributing…but it's been 20 years since that list was added to, times have changed and there are new realities. We just simply want those new realities reflected. I don't fully understand why there's so much opposition to that."
The EU chose not to comment on which countries it would like to see on that list.
Lim Li Ching from the Third World Network, meanwhile, called the push for others to "assume the obligations" of developed countries "sheer hypocrisy", adding that any country could make a voluntary contribution. She told Carbon Brief:
"At a forum like the CBD, this linking of income status with finance does not take into account where historical and current responsibilities lie. If you want to generate more funding for biodiversity, let's look at sovereign debt burdens and rules, which are inequitable for developing countries. But if you can fund wars, and provide resources for your defence industry, then you know where the priorities are."
On 29 October - at a plenary meant to adopt final texts for the most contentious subjects - Norway's Gaute Hanssen announced that resource-mobilisation discussions would go into a smaller "friends of the chair" meeting.
Facilitated by Carolina Caceres from Canada and Imèn Meliane from Tunisia, the meeting would discuss the most contentious elements of a draft decision that had swelled to 112 brackets, denoting areas of disagreement on specific details in the text.
While the meeting was open to all, countries that were called to be present included Brazil, Canada, Chile, China, the EU, Fiji, Norway, Russia, Switzerland, Saudi Arabia, South Africa and the UK.
At the same time, a "non paper" text by finance and environment ministers laid out countries' red lines and compromises.
With the COP31 climate summit in Turkey looming, all eyes are on China to see what the country will push for in the negotiations.
At COP30 last year, China helped to secure a "dialogue" on climate-related "unilateral trade measures", as well as a two-year "work programme" concerning climate finance.
The nation also championed south-south cooperation throughout the conference and co-led a summit on methane, alongside Brazil and the UK.
In a recent press conference, China's environment vice-minister Li Gao noted the need to "uphold multilateralism" and send a "clear political signal" that the global community is united around climate action.
var gform;gform||(document.addEventListener("gform_main_scripts_loaded",function(){gform.scriptsLoaded=!0}),document.addEventListener("gform/theme/scripts_loaded",function(){gform.themeScriptsLoaded=!0}),window.addEventListener("DOMContentLoaded",function(){gform.domLoaded=!0}),gform={domLoaded:!1,scriptsLoaded:!1,themeScriptsLoaded:!1,isFormEditor:()=>"function"==typeof InitializeEditor,callIfLoaded:function(o){return!(!gform.domLoaded||!gform.scriptsLoaded||!gform.themeScriptsLoaded&&!gform.isFormEditor()||(gform.isFormEditor()&&console.warn("The use of gform.initializeOnLoaded() is deprecated in the form editor context and will be removed in Gravity Forms 3.1."),o(),0))},initializeOnLoaded:function(o){gform.callIfLoaded(o)||(document.addEventListener("gform_main_scripts_loaded",()=>{gform.scriptsLoaded=!0,gform.callIfLoaded(o)}),document.addEventListener("gform/theme/scripts_loaded",()=>{gform.themeScriptsLoaded=!0,gform.callIfLoaded(o)}),window.addEventListener("DOMContentLoaded",()=>{gform.domLoaded=!0,gform.callIfLoaded(o)}))},hooks:{action:{},filter:{}},addAction:function(o,r,e,t){gform.addHook("action",o,r,e,t)},addFilter:function(o,r,e,t){gform.addHook("filter",o,r,e,t)},doAction:function(o){gform.doHook("action",o,arguments)},applyFilters:function(o){return gform.doHook("filter",o,arguments)},removeAction:function(o,r){gform.removeHook("action",o,r)},removeFilter:function(o,r,e){gform.removeHook("filter",o,r,e)},addHook:function(o,r,e,t,n){null==gform.hooks[o][r]&&(gform.hooks[o][r]=[]);var d=gform.hooks[o][r];null==n&&(n=r+"_"+d.length),gform.hooks[o][r].push({tag:n,callable:e,priority:t=null==t?10:t})},doHook:function(r,o,e){var t;if(e=Array.prototype.slice.call(e,1),null!=gform.hooks[r][o]&&((o=gform.hooks[r][o]).sort(function(o,r){return o.priority-r.priority}),o.forEach(function(o){"function"!=typeof(t=o.callable)&&(t=window[t]),"action"==r?t.apply(null,e):e[0]=t.apply(null,e)})),"filter"==r)return e[0]},removeHook:function(o,r,t,n){var e;null!=gform.hooks[o][r]&&(e=(e=gform.hooks[o][r]).filter(function(o,r,e){return!!(null!=n&&n!=o.tag||null!=t&&t!=o.priority)}),gform.hooks[o][r]=e)}}); #gform_wrapper_6[data-form-index="0"].gform-theme,[data-parent-form="6_0"]{--gf-color-primary: #204ce5;--gf-color-primary-rgb: 32, 76, 229;--gf-color-primary-contrast: #fff;--gf-color-primary-contrast-rgb: 255, 255, 255;--gf-color-primary-darker: #001AB3;--gf-color-primary-lighter: #527EFF;--gf-color-secondary: #fff;--gf-color-secondary-rgb: 255, 255, 255;--gf-color-secondary-contrast: #112337;--gf-color-secondary-contrast-rgb: 17, 35, 55;--gf-color-secondary-darker: #F5F5F5;--gf-color-secondary-lighter: #FFFFFF;--gf-color-out-ctrl-light: rgba(17, 35, 55, 0.1);--gf-color-out-ctrl-light-rgb: 17, 35, 55;--gf-color-out-ctrl-light-darker: rgba(104, 110, 119, 0.35);--gf-color-out-ctrl-light-lighter: #F5F5F5;--gf-color-out-ctrl-dark: #585e6a;--gf-color-out-ctrl-dark-rgb: 88, 94, 106;--gf-color-out-ctrl-dark-darker: #112337;--gf-color-out-ctrl-dark-lighter: rgba(17, 35, 55, 0.65);--gf-color-in-ctrl: #fff;--gf-color-in-ctrl-rgb: 255, 255, 255;--gf-color-in-ctrl-contrast: #112337;--gf-color-in-ctrl-contrast-rgb: 17, 35, 55;--gf-color-in-ctrl-darker: #F5F5F5;--gf-color-in-ctrl-lighter: #FFFFFF;--gf-color-in-ctrl-primary: #204ce5;--gf-color-in-ctrl-primary-rgb: 32, 76, 229;--gf-color-in-ctrl-primary-contrast: #fff;--gf-color-in-ctrl-primary-contrast-rgb: 255, 255, 255;--gf-color-in-ctrl-primary-darker: #001AB3;--gf-color-in-ctrl-primary-lighter: #527EFF;--gf-color-in-ctrl-light: rgba(17, 35, 55, 0.1);--gf-color-in-ctrl-light-rgb: 17, 35, 55;--gf-color-in-ctrl-light-darker: rgba(104, 110, 119, 0.35);--gf-color-in-ctrl-light-lighter: #F5F5F5;--gf-color-in-ctrl-dark: #585e6a;--gf-color-in-ctrl-dark-rgb: 88, 94, 106;--gf-color-in-ctrl-dark-darker: #112337;--gf-color-in-ctrl-dark-lighter: rgba(17, 35, 55, 0.65);--gf-radius: 3px;--gf-font-size-secondary: 14px;--gf-font-size-tertiary: 13px;--gf-icon-ctrl-number: url("data:image/svg+xml,%3Csvg width='8' height='14' viewBox='0 0 8 14' fill='none' xmlns='http://www.w3.org/2000/svg'%3E%3Cpath fill-rule='evenodd' clip-rule='evenodd' d='M4 0C4.26522 5.96046e-08 4.51957 0.105357 4.70711 0.292893L7.70711 3.29289C8.09763 3.68342 8.09763 4.31658 7.70711 4.70711C7.31658 5.09763 6.68342 5.09763 6.29289 4.70711L4 2.41421L1.70711 4.70711C1.31658 5.09763 0.683417 5.09763 0.292893 4.70711C-0.0976311 4.31658 -0.097631 3.68342 0.292893 3.29289L3.29289 0.292893C3.48043 0.105357 3.73478 0 4 0ZM0.292893 9.29289C0.683417 8.90237 1.31658 8.90237 1.70711 9.29289L4 11.5858L6.29289 9.29289C6.68342 8.90237 7.31658 8.90237 7.70711 9.29289C8.09763 9.68342 8.09763 10.3166 7.70711 10.7071L4.70711 13.7071C4.31658 14.0976 3.68342 14.0976 3.29289 13.7071L0.292893 10.7071C-0.0976311 10.3166 -0.0976311 9.68342 0.292893 9.29289Z' fill='rgba(17, 35, 55, 0.65)'/%3E%3C/svg%3E");--gf-icon-ctrl-select: url("data:image/svg+xml,%3Csvg width='10' height='6' viewBox='0 0 10 6' fill='none' xmlns='http://www.w3.org/2000/svg'%3E%3Cpath fill-rule='evenodd' clip-rule='evenodd' d='M0.292893 0.292893C0.683417 -0.097631 1.31658 -0.097631 1.70711 0.292893L5 3.58579L8.29289 0.292893C8.68342 -0.0976311 9.31658 -0.0976311 9.70711 0.292893C10.0976 0.683417 10.0976 1.31658 9.70711 1.70711L5.70711 5.70711C5.31658 6.09763 4.68342 6.09763 4.29289 5.70711L0.292893 1.70711C-0.0976311 1.31658 -0.0976311 0.683418 0.292893 0.292893Z' fill='rgba(17, 35, 55, 0.65)'/%3E%3C/svg%3E");--gf-icon-ctrl-search: url("data:image/svg+xml,%3Csvg width='640' height='640' xmlns='http://www.w3.org/2000/svg'%3E%3Cpath d='M256 128c-70.692 0-128 57.308-128 128 0 70.691 57.308 128 128 128 70.691 0 128-57.309 128-128 0-70.692-57.309-128-128-128zM64 256c0-106.039 85.961-192 192-192s192 85.961 192 192c0 41.466-13.146 79.863-35.498 111.248l154.125 154.125c12.496 12.496 12.496 32.758 0 45.254s-32.758 12.496-45.254 0L367.248 412.502C335.862 434.854 297.467 448 256 448c-106.039 0-192-85.962-192-192z' fill='rgba(17, 35, 55, 0.65)'/%3E%3C/svg%3E");--gf-label-space-y-secondary: var(--gf-label-space-y-md-secondary);--gf-ctrl-border-color: #686e77;--gf-ctrl-size: var(--gf-ctrl-size-md);--gf-ctrl-label-color-primary: #112337;--gf-ctrl-label-color-secondary: #112337;--gf-ctrl-choice-size: var(--gf-ctrl-choice-size-md);--gf-ctrl-checkbox-check-size: var(--gf-ctrl-checkbox-check-size-md);--gf-ctrl-radio-check-size: var(--gf-ctrl-radio-check-size-md);--gf-ctrl-btn-font-size: var(--gf-ctrl-btn-font-size-md);--gf-ctrl-btn-padding-x: var(--gf-ctrl-btn-padding-x-md);--gf-ctrl-btn-size: var(--gf-ctrl-btn-size-md);--gf-ctrl-btn-border-color-secondary: #686e77;--gf-ctrl-file-btn-bg-color-hover: #EBEBEB;--gf-field-img-choice-size: var(--gf-field-img-choice-size-md);--gf-field-img-choice-card-space: var(--gf-field-img-choice-card-space-md);--gf-field-img-choice-check-ind-size: var(--gf-field-img-choice-check-ind-size-md);--gf-field-img-choice-check-ind-icon-size: var(--gf-field-img-choice-check-ind-icon-size-md);--gf-field-pg-steps-number-color: rgba(17, 35, 55, 0.8);} CompanyThis field is for validation purposes and should be left unchanged.Free fortnightly newsletter
.preheader p{ margin-top: 0; font-family: 'PT Sans', sans-serif; font-weight: var(--type--3--font-weight--bold); color: var(--button--color); font-size: var(--button--font-size, inherit); } .newsletter-inline{
display: flex;
border: solid 1px #333333;
padding: 1em;
background: #ffffff;
}
.inline-email{
display:inline-block;
margin-right:1em;
margin-top:0 !important;
margin-bottom:0.5em;
}
#field_submit{
display:inline-block;
margin-top:0 !important;
}
.gform_wrapper .gfield+.gfield{
margin-top:0
}
Email
gform.initializeOnLoaded( function() {gformInitSpinner( 6, 'https://www.carbonbrief.org/wp-content/plugins/gravityforms/images/spinner.svg', false );jQuery('#gform_ajax_frame_6').on('load',function(){var contents = jQuery(this).contents().find('*').html();var is_postback = contents.indexOf('GF_AJAX_POSTBACK') >= 0;if(!is_postback){return;}var form_content = jQuery(this).contents().find('#gform_wrapper_6');var is_confirmation = jQuery(this).contents().find('#gform_confirmation_wrapper_6').length > 0;var is_redirect = contents.indexOf('gformRedirect(){') >= 0;var is_form = form_content.length > 0 && ! is_redirect && ! is_confirmation;var mt = parseInt(jQuery('html').css('margin-top'), 10) + parseInt(jQuery('body').css('margin-top'), 10) + 100;if(is_form){jQuery('#gform_wrapper_6').html(form_content.html());if(form_content.hasClass('gform_validation_error')){jQuery('#gform_wrapper_6').addClass('gform_validation_error');} else {jQuery('#gform_wrapper_6').removeClass('gform_validation_error');}setTimeout( function() { /* delay the scroll by 50 milliseconds to fix a bug in chrome */ jQuery(document).scrollTop(jQuery('#gform_wrapper_6').offset().top - mt); }, 50 );if(window['gformInitDatepicker']) {gformInitDatepicker();}if(window['gformInitPriceFields']) {gformInitPriceFields();}var current_page = jQuery('#gform_source_page_number_6').val();gformInitSpinner( 6, 'https://www.carbonbrief.org/wp-content/plugins/gravityforms/images/spinner.svg', false );jQuery(document).trigger('gform_page_loaded', [6, current_page]);window['gf_submitting_6'] = false;}else if(!is_redirect){var confirmation_content = jQuery(this).contents().find('.GF_AJAX_POSTBACK').html();if(!confirmation_content){confirmation_content = contents;}jQuery('#gform_wrapper_6').replaceWith(confirmation_content);jQuery(document).scrollTop(jQuery('#gf_6').offset().top - mt);jQuery(document).trigger('gform_confirmation_loaded', [6]);window['gf_submitting_6'] = false;wp.a11y.speak(jQuery('#gform_confirmation_message_6').text());}else{jQuery('#gform_6').append(contents);if(window['gformRedirect']) {gformRedirect();}}jQuery(document).trigger("gform_pre_post_render", [{ formId: "6", currentPage: "current_page", abort: function() { this.preventDefault(); } }]); if (event && event.defaultPrevented) { return; } const gformWrapperDiv = document.getElementById( "gform_wrapper_6" ); if ( gformWrapperDiv ) { const visibilitySpan = document.createElement( "span" ); visibilitySpan.id = "gform_visibility_test_6"; gformWrapperDiv.insertAdjacentElement( "afterend", visibilitySpan ); } const visibilityTestDiv = document.getElementById( "gform_visibility_test_6" ); let postRenderFired = false; function triggerPostRender() { if ( postRenderFired ) { return; } postRenderFired = true; gform.core.triggerPostRenderEvents( 6, current_page ); if ( visibilityTestDiv ) { visibilityTestDiv.parentNode.removeChild( visibilityTestDiv ); } } function debounce( func, wait, immediate ) { var timeout; return function() { var context = this, args = arguments; var later = function() { timeout = null; if ( !immediate ) func.apply( context, args ); }; var callNow = immediate && !timeout; clearTimeout( timeout ); timeout = setTimeout( later, wait ); if ( callNow ) func.apply( context, args ); }; } const debouncedTriggerPostRender = debounce( function() { triggerPostRender(); }, 200 ); if ( visibilityTestDiv && visibilityTestDiv.offsetParent === null ) { const observer = new MutationObserver( ( mutations ) => { mutations.forEach( ( mutation ) => { if ( mutation.type === 'attributes' && visibilityTestDiv.offsetParent !== null ) { debouncedTriggerPostRender(); observer.disconnect(); } }); }); observer.observe( document.body, { attributes: true, childList: false, subtree: true, attributeFilter: [ 'style', 'class' ], }); } else { triggerPostRender(); } } );} );
Li also pledged to advocate for an "open and efficient" trade system that "facilitates" adoption of clean-energy technologies.
On the more traditional topics of mitigation and finance, Li highlighted the need to "address insufficient emission reduction efforts by developed countries and inadequate financial support" for developing countries.
Carbon Brief asked six leading experts on China what they believe China wants from COP31 and what signals they will be watching for.
Their responses have been edited for length and clarity.
Article Contents Expand menu Kate Logan
Director of the China climate hub and climate diplomacy, Asia Society Policy Institute
In an era where global climate cooperation is severely challenged, China's top priority at COP31 will be upholding multilateralism. With most "big ticket" items under the Paris Agreement now complete and constrained expectations for major new breakthroughs at COP31, China may be satisfied with a conference that produces no major drama and little else.
Nevertheless, expect China's vision for multilateralism to have a distinct flavor to it. Chinese officials may again leverage the COP stage to oppose unilateralism and promote an open and fair international trade system, reflecting Beijing's persistent frustration with tariffs and other measures that have inhibited the global flow of Chinese clean technologies. One question is whether they will do this through existing spaces or push for a dedicated agenda item on trade, given that COP30's trade outcomes, championed by China, mostly relegated discussions to mid-year technical meetings.
China may also seek clarity on implementation pathways for existing targets, including nationally determined contributions (NDCs) and the $300bn climate finance goal. Amid US withdrawal, officials remain anxious about additional pressure that Beijing may receive. After vice-premier Ding Xuexiang shared at COP29 that China has provided and mobilised over 177bn yuan ($26.5bn) in climate finance for developing countries since 2016, China has refrained from issuing further quantitative updates, while maintaining the imperative for developed countries to take the lead on climate finance. China may be happy to let other developing countries push this agenda while serving as a broker in the end game to ensure its own interests are protected.
Ma Jun
Founder and director, Institute of Public and Environmental Affairs
I think China wants COP31 to reaffirm confidence in multilateral climate cooperation and translate commitments into action. With the risk of overshooting 1.5C almost unavoidable, I expect China to seek clearer delivery of climate finance for developing countries; encourage reductions in potent, short-lived greenhouse gases such as methane; support a just transition; and highlight trade barriers affecting clean technologies.
I will be watching whether negotiations produce credible plans for delivering finance, particularly for adaptation, as well as practical support for implementing national climate pledges. The climate-trade debate will also matter. Can countries address their differences while keeping renewable energy and other clean technologies affordable and accessible? It will be an important test of whether countries can achieve global energy-transition targets by 2030 and turn shared ambitions into measurable emissions reductions.
Yao Zhe
Global policy advisor, Greenpeace East Asia
At COP31, I expect a continued push from China to integrate more trade perspectives into the climate negotiations. Beijing's new five-year plan on climate action envisions a constructive leadership role in global climate governance, specifically calling for the proper handling of climate-trade issues and the free flow of low-carbon products. It will be critical to watch how this grand strategy plays out on the negotiation floor.
I will also be watching how China responds to the COP presidency's electrification initiative. Beijing increasingly views climate diplomacy through the lens of clean-energy diplomacy - an approach that directly leverages its industrial strength on renewables, electric vehicles (EVs), batteries and grid infrastructure. While China should naturally welcome a global electrification initiative that will lead to larger overseas markets, it likely remains reluctant to link these targets to any commitments regarding transitioning away from fossil fuels.
Prof Ryna Cui
Associate research professor and research director, University of Maryland Center for Global Sustainability
There isn't much on the formal negotiation agenda for this year's COP. The core theme will continue to focus on implementation and delivery, which I think China has strong interests in. This is because of both progress made domestically with the clean energy transition and the overseas economic opportunities to support other countries' implementation with low-cost Chinese clean technologies.
One thing exciting for me to watch is that, as China reaches its coal and oil peak, it may open up space for increased interests and leadership in the global "transitioning away from fossil fuels" agenda. This may not happen immediately through formal government negotiations, but more likely through broader bilateral and multilateral engagements.
As the world navigates options and challenges for the 1.5C overshoot future, China can also contribute critically beyond the energy transition, especially on opportunities for rapid abatement of methane, industrial nitrous oxide, hydrofluorocarbons and other non-CO2 gases as part of its 2035 all-sector, all-greenhouse gas NDC.
Dr Joseph Dellatte
Resident fellow and head of energy and climate studies, Institut Montaigne
China will likely seek recognition as a climate leader while defending its position as the world's cleantech manufacturing hub, amid growing trade tensions. I'll watch whether it continues to frame the global transition primarily around access to Chinese technologies and open markets for its exports, or shows greater willingness to discuss cooperation that shares industrial benefits through local manufacturing, joint ventures and technology sharing. Its delegation and pavilion messaging will reveal how Beijing responds to partners seeking their own place in cleantech value chains.
In the negotiations, I'll watch whether China accepts greater responsibility for climate ambition while maintaining its leadership role among developing countries, including through additional voluntary climate finance. Electrification will be another test. Will Beijing support commitments linking electrification to cleaner grids and use its influence to bring reluctant fossil-fuel producers on board?
Prof Jeremy Wallace
A Doak Barnett professor of China studies, Johns Hopkins School of Advanced International Studies
China seems to hold many cards in the notional game of global climate leadership. Its firms have innovated and scaled up production to make solar, batteries and EVs cost-competitive with or cheaper than fossil alternatives. It has led in deployment of these technologies.
Yet, in preparation for COP31, China seems more interested in fighting battles abroad about "unfair" tariffs on these products than about demonstrating their effectiveness by accelerating adoption of the green-tech revolution at home. China's renewables buildout has slowed dramatically in 2026, while new coal power and coal chemical facilities continue to be built. The Chinese government has restricted firms from taking their best manufacturing innovations out of the country when building factories abroad.
Climate leadership is up for grabs. I'm watching to see if Beijing will play its cards and show that they are a winning hand.
Related Analysis: China's clean-tech exports in 2026 to avoid as much CO2 as Brazil emits in a year
29.10.2026
China policy
 Chart: A record two-thirds of car sales in China are now electric vehicles
23.10.2026
China policy
 Interactive: What China's dozens of 'five-year plans' say about climate and energy
24.09.2026
China policy
 Analysis: China's CO2 emissions fall in Q2 2026 due to plummeting oil use
03.09.2026
Emissions
The post Experts: What China wants from the COP31 climate talks appeared first on Carbon Brief.
China's exports in 2026 of clean-energy technologies, such as solar panels, batteries and electric vehicles, are on track to cut emissions beyond its borders by 2%, reveals new analysis.
This guest post is by:Lauri Myllyvirta, lead analyst at the Centre for Research on Energy and Clean Air and senior fellow at Asia Society Policy Institute
The impact of these Chinese exports on carbon dioxide (CO2) emissions around the world grew by 26% year-on-year in the first three quarters of 2026, having already risen by 36% in 2025.
The new analysis for Carbon Brief is based on detailed data for clean-tech product exports, the electricity system in destination countries and emissions during manufacturing in China.
If the latest trends continue for the rest of the year, then Chinese clean-tech exports in 2026 alone will avoid around 450m tonnes of CO2 (MtCO2) - roughly equivalent to Brazil's annual emissions.
Other key findings from the analysis include:
- Electric car and heavy vehicle shipments grew by 61% year-on-year in the first three quarters of 2026, wind-turbines by 45%, batteries 39%, solar 22% and electric two-wheelers by 21%.
- Over the lifetime of the equipment, exports in 2026 are on track to avoid 8,400MtCO2, equivalent to the annual emissions of the US and India combined.
- This lifetime avoided emissions total for exports in 2026 is up by a quarter from 6,800MtCO2 in 2025 and up by two-thirds from 5,000MtCO2 in 2024.
- Wind- and solar-equipment exports from China in 2026 will generate as much electricity each year as roughly 100 coal-fired power plants.
- While the majority of clean-tech exports by value went to the global north in the first three quarters of 2026, some 76% of lifetime avoided emissions were in the global south.
- This includes 52% of lifetime avoided emissions being in south and south-east Asia, reflecting solar shipments from China being installed onto high-carbon power grids.
- Chinese-owned clean-energy projects built in other countries doubled from 2022-25, but the amount of CO2 avoided remains small compared to equipment exports.
The analysis shows that most of China's clean-energy exports have been built on new or expanded markets, enabling other producers to maintain their own sales volumes.
In addition, clean-energy sales within China are larger than exports for most technologies, but a domestic solar slowdown could exacerbate trade tensions, if it continues.
Clean-tech exportsChina has become the pre-eminent producer of clean-energy technologies, from solar panels and wind turbines through to batteries and electric vehicles.
The majority of China's clean-tech production is destined for the domestic market. But it has also become a major exporter - and these exports are avoiding significant amounts of CO2.
Previous analysis for Carbon Brief showed that these clean-energy exports in 2024 would cut emissions in countries outside China by around 1%.
The latest analysis shows that China's clean-tech exports in 2026 are on track to avoid around 450MtCO2, as shown in the figure below, which is nearly 2% of global emissions outside China. It is also roughly equivalent to Brazil's annual CO2 emissions from fossil fuels.
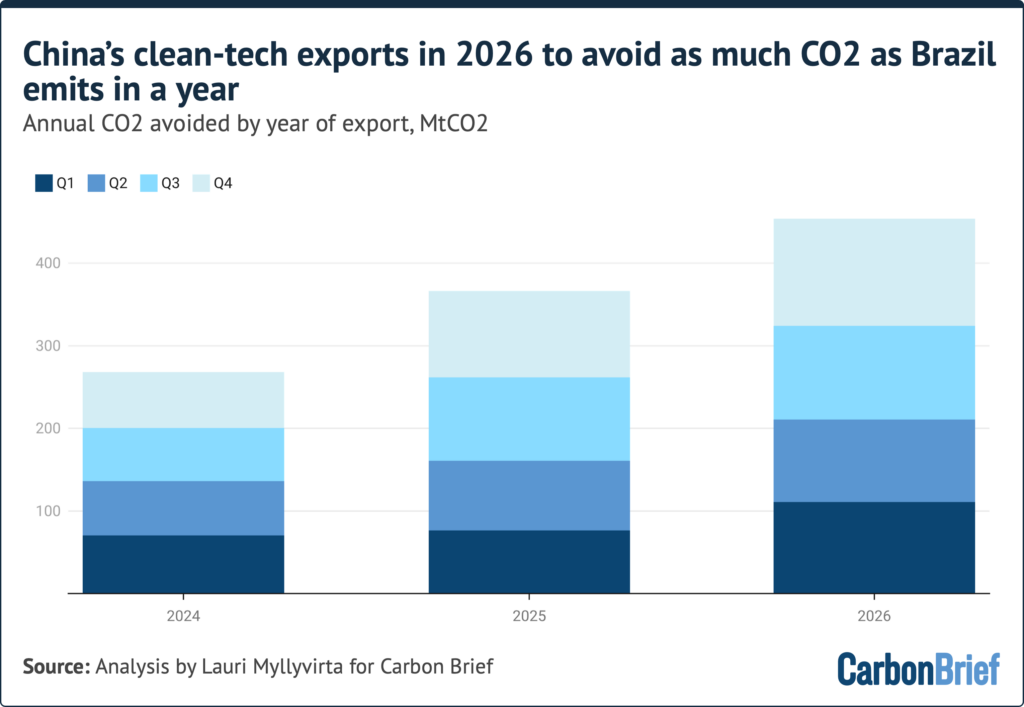 The estimate for the final quarter of 2026 is projected from the year-on-year growth rate in the first three quarters. CO2 emissions outside China from Energy Institute data. For further details see: About the data.
The analysis accounts for the impact of the clean-tech exports in the destination country, as well as the emissions due to manufacturing the products in China.
Looking at the full-year data for 2025, manufacturing clean-energy equipment resulted in emissions of around 170MtCO2 within China, while avoiding 370MtCO2 in other countries. This implies that, in aggregate, it takes six months for the exported goods to pay back the CO2 from manufacturing.
Solar exports are the biggest enablerChina's solar-equipment exports continue to be the biggest enabler of decarbonisation in other countries, according to the analysis.
In the full-year data for 2025, China exported finished solar panels and intermediate products that correspond to a total generating capacity of 436 gigawatts (GW) once assembled and installed.
(Note that this is measured in gigawatts DC, which reflects the capacity of the panels, whereas capacity measured in AC refers to the size of the wire that connects them to the grid.)
In addition, China exported 8GW of wind turbines. Together with the solar equipment, this will generate approximately 720 terawatt-hours (TWh) of electricity per year, based on the average output per unit of capacity for solar and wind in each destination country.
For 2026, China's exports of wind and solar equipment are on track to generate approximately 800TWh of electricity, equivalent to the generation from around 100 coal-fired power plants.
Over their lifetimes, based on the power sources expected to be displaced in each destination country, the solar exports in 2025 will avoid an estimated 6,400MtCO2.
(For more details on the basis for these calculations, see: About the data.)
Solar is therefore the largest source of lifetime avoided CO2 emissions by far, with wind-turbine exports in second place displacing just 180MtCO2, as shown in the figure below.
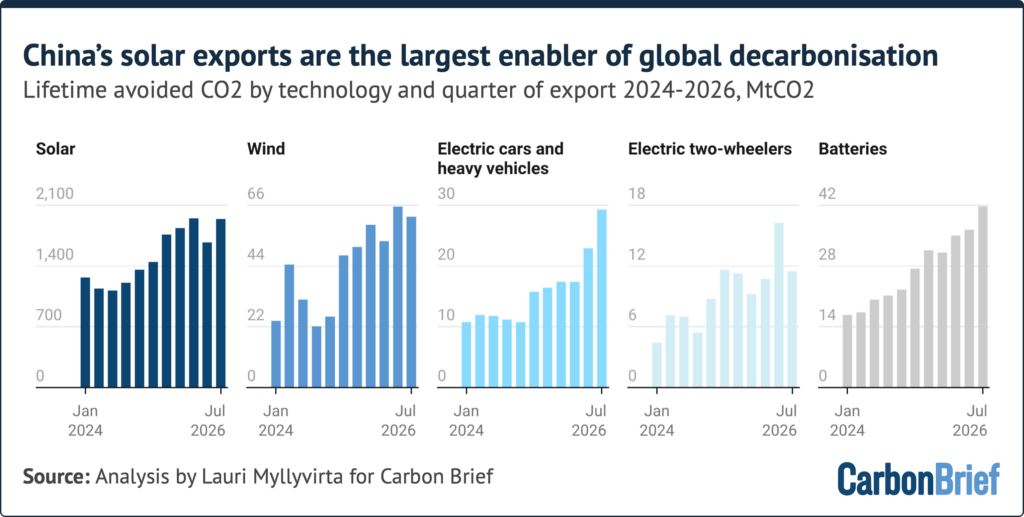 Note the variable y-axes. Avoided emissions are net of manufacturing and assume lifetimes of 20 years for solar and wind, 10 years for cars and batteries or 5 years for two-wheelers. For further details see: About the data.
The 39m electric vehicles exported from China in 2025 included 36m two-wheelers, 2.2m battery electric cars, 160,000 plug-in hybrid cars, 15,000 buses and 30,000 trucks.
In addition, China exported batteries with a capacity of 305 gigawatt-hours (GWh) in 2025, enough to power another 5m battery electric cars once installed, based on typical battery sizes.
Based on typical driving distances and fuel consumption for corresponding fuel-burning vehicles, as well as the CO2 intensity of the electricity grid in destination countries, the EVs and batteries exported in 2025 will avoid an estimated 170MtCO2 over their lifetimes.
Given the sheer number of electric two-wheelers, the amount of oil and resulting CO2 they displace is a key uncertainty. Real-world e-bike studies support an assumption that roughly half of e-bike travel displaces the use of motor vehicles, either cars or motorbikes depending on location.
This suggests that, when taking into account the electricity grid in importing nations, China's electric two-wheeler exports in 2025 will avoid an estimated 40MtCO2 over their lifetimes.
Global South dominates avoided emissionsIn 2025, some 73% of the lifetime emissions avoided by China's clean-tech exports were in global-south countries, which also accounted for 87% of the growth year-on-year.
In the first three quarters of 2026, global-south countries were responsible for almost all of the increase in avoided emissions compared with a year earlier, as shown in the figure below.
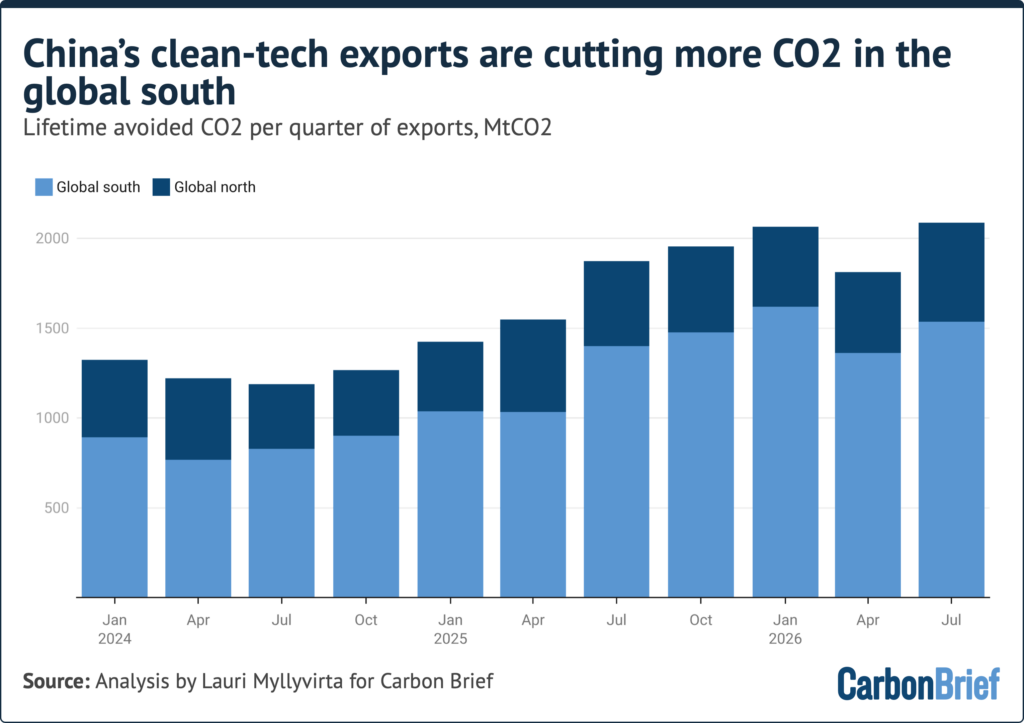 Final destinations for solar exports account for re-export, including post-tariff re-routing to the US via assembly or transit in third countries. For further details see: About the data.
The high share of the global south in avoided emissions reflects large export volumes and power grids that are more carbon-intensive on average, as well as better average solar conditions that result in larger avoided emissions for each gigawatt of solar exported.
Clean-tech exports span the globeOn the regional level, South Asia has the largest avoided emissions due to imports of Chinese clean-tech, with strong year-on-year growth both in 2025 and the first three quarters of 2026.
Other top regional destinations in 2026 to date, in terms of lifetime avoided emissions, include south-east Asia, North America, Europe and the Middle East.
However, the exports span the globe, as shown in the map below, avoiding billions of tonnes of CO2 across every continent and in nearly every country of the world.
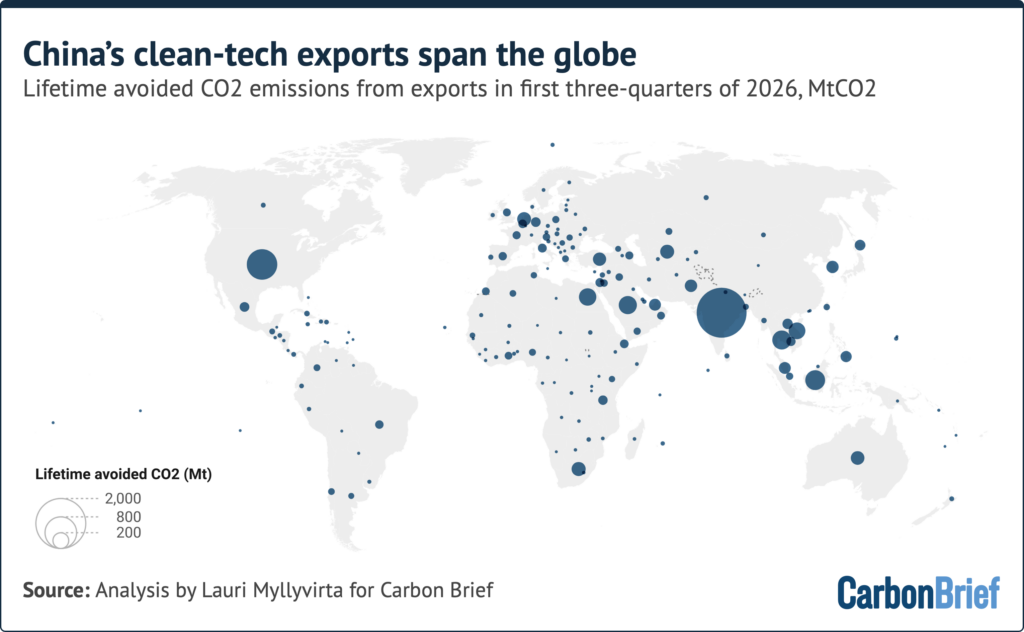
Among countries, the US has the second-largest avoided emissions after India. It registered a further increase of 12% in 2026, despite increased tariffs, and exceeds the EU as a bloc. The US is followed by Thailand, Saudi Arabia, South Africa and Australia.
The EU imports more of every clean energy technology than the US, but the US has higher avoided emissions. This is because average US solar output per unit of capacity is higher - as is the average CO2 intensity of power generation. As a result, every gigawatt of solar installed in the US results in three-times more avoided CO2 emissions than in the EU.
The resilience of Chinese clean-tech exports to the US indicates strong demand for the technology, despite the Trump administration's steps to slow down deployment and discourage imports.
The data suggests that reducing reliance on technology supply from China - a policy aim of recent administrations from both parties - is likely to require scaling up of domestic and third-country manufacturing of the key technologies, in order to meet that resilient demand.
The largest change in the national rankings for avoided emissions from clean-tech exports in 2026, compared with the previous year, has been a fall in exports to the Gulf countries affected by the war in the region.
For electric cars and heavy vehicles, western Europe was the largest destination in the first three quarters of 2026, followed by Latin America and south-east Asia, both of which more than doubled, reflecting the impact of the oil crisis. Exports to the EU gained 39%.
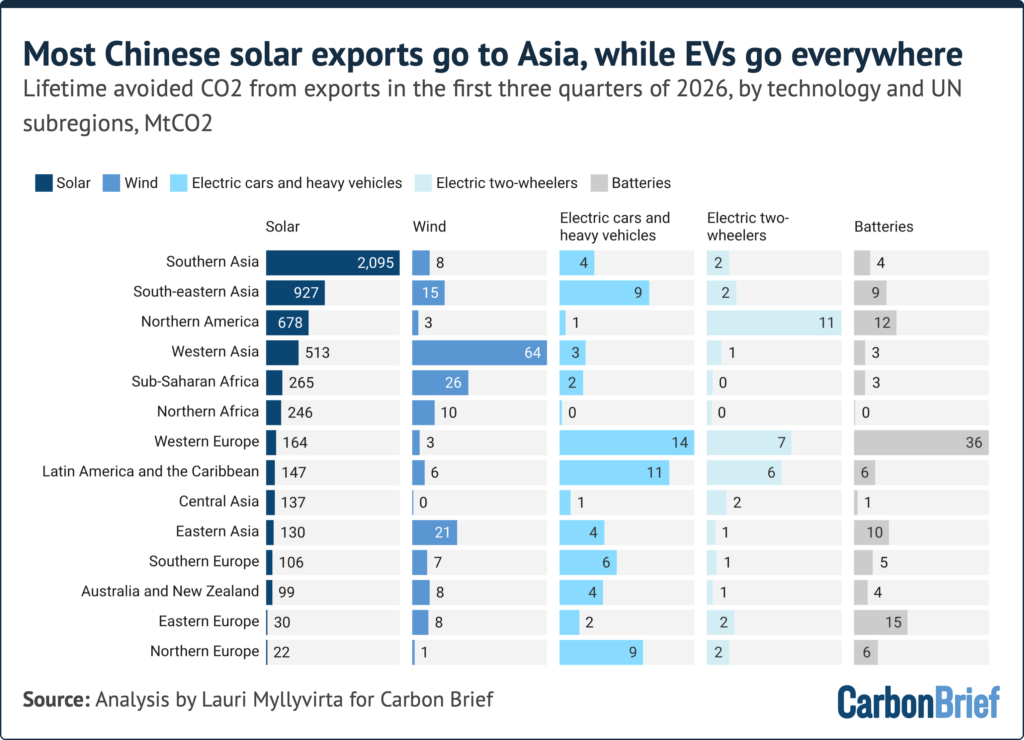 Regional aggregation according to UN subregions, including "western Asia", which encompasses Turkey, the Caucasus and the Middle East Final. Destinations for solar exports account for re-export, including post-tariff re-routing to the US via assembly or transit in third countries. For further details see: About the data.
When including batteries and electric two-wheelers, North America and Europe are the largest destinations for avoided emissions due to EV-related exports, followed by Latin America and south-east Asia.
Exports of Chinese solar equipment to the US rose 13% year-on-year in the first three quarters of 2026, once re-routing through different channels is considered. This is a reversal of the dip early in the year, due to a sharp increase in tariffs in June 2025. Exports of EVs and batteries to the US also increased slightly, by 3% in the first three quarters of 2026.
Overseas clean energy projects double over three yearsIn addition to its clean-tech exports, China is also increasingly becoming directly involved in the development of overseas clean-energy projects.
This can be traced back to the 2021 pledge by Chinese president Xi Jinping, in which he said:
"China will step up support for other developing countries in developing green and low-carbon energy, and will not build new coal-fired power projects abroad."
As of July 2026, some 69GW of China-linked renewable energy projects were in operation overseas. An additional 100GW are being built, with 280GW in planning but not yet under construction. This renewable energy capacity is supported by 3.5GW of China-linked energy storage projects in operation, with a further 21.4GW of storage in the pipeline.
China has also financed and built six operating nuclear reactors overseas, with a total capacity of 3.3GW. These are all located in Pakistan and, in 2023, they had a total generation of 26TWh. China began construction on the 1.2GW Chashma-5 reactor in 2024, also in Pakistan, with the plant expected to be operational around 2030.
The expected electricity output of China's newly operating overseas clean-power projects doubled from 2022 to 2025, with a further 6% year-on-year increase in the first seven months of 2026.
The countries with the largest estimated generation from China-linked clean-power capacity are Indonesia, Vietnam, Bangladesh, Mongolia, Zimbabwe, Laos, Turkey and South Africa.
The list looks slightly different when considering the impact of operating, under construction or planned China-linked capacity on avoided CO2 emissions.
As shown in the figure below, Saudi Arabia, Uzbekistan, Indonesia and Pakistan are expected to see the largest avoided CO2, once under-construction projects are completed.
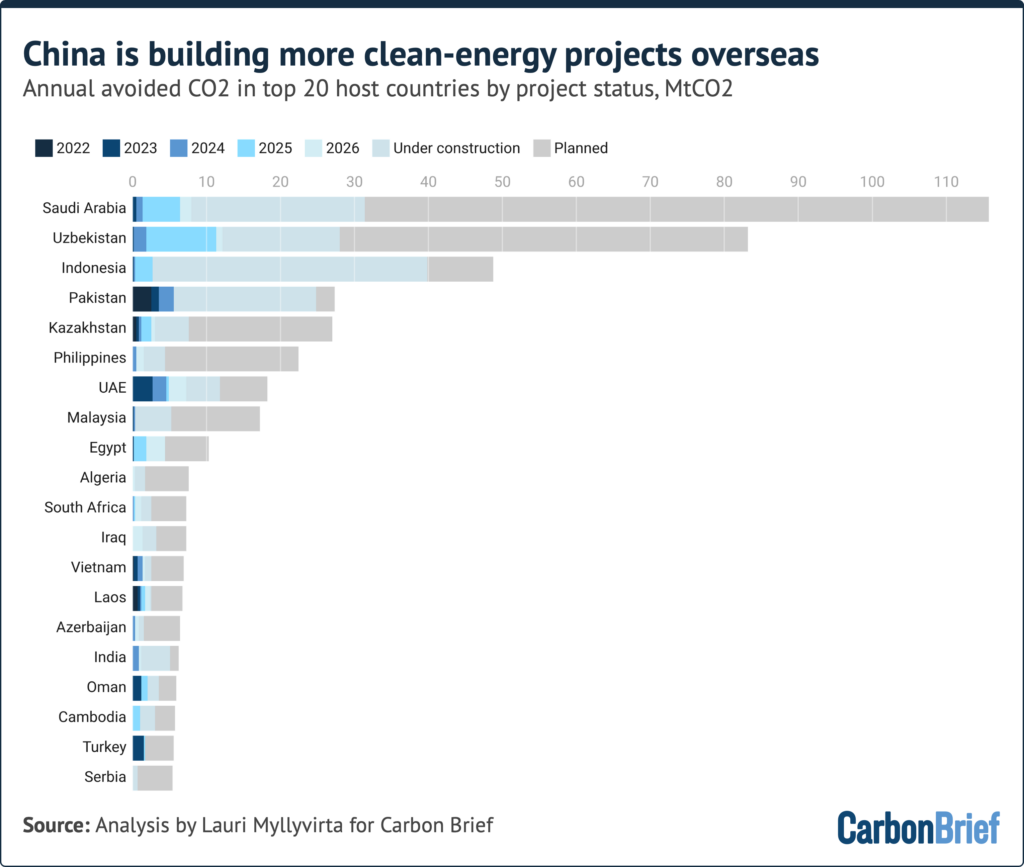 Based on renewable project data from DCore, nuclear data from World Nuclear Association and grid CO2 intensity data from Ember.
The increase in overseas clean-energy projects has changed China's role in the power-sector development of other emerging countries. Having previously been the main financier of coal-power projects, it is now an important force in developing clean-power generation.
Nevertheless, there are gaps in the implementation of Xi's pledge to end overseas coal-power development, which could be seen to affect its effectiveness and credibility. These gaps are particularly with respect to "captive" coal-power plants linked to industrial projects in Indonesia.
China's overseas clean-energy project portfolio is growing, but remains small compared with the country's equipment exports. For example in 2025, some 8.4GW of solar-power projects with Chinese financing or involvement entered operation and 18GW were newly announced. That year, China also exported 436GW of solar panels and intermediates.
This implies that financing, project development and construction using solar panels and other clean-tech from China is overwhelmingly carried out by local and other non-Chinese actors.
China's exports enable market growthA key concern in countries around the world is that Chinese industrial "overcapacity" is crowding out domestic industries, from automotive to steel or chemicals.
However, analysis of China's clean-tech exports suggests that they have generally been additional, meaning they have not displaced exports by other producers. This could be a sign that China's exports have either captured or enabled market growth for these clean-energy technologies.
For example, the value of EV exports from other countries has grown much more than those from China, as shown in the figure below. These EV exports have been led by the EU27 - particularly Germany - as well as Mexico, Japan, the UK and South Korea.
Similarly, there has been growth in the value of exports of heat pumps, solar inverters and electrolysers from both China and from other countries.
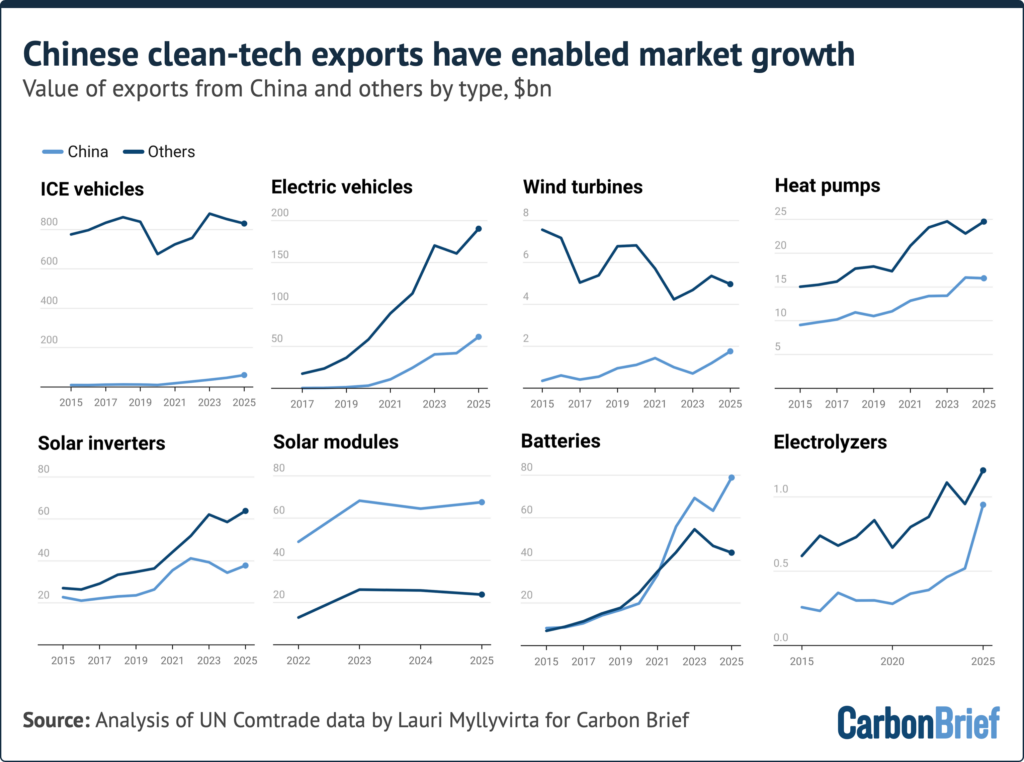
This pattern has not been universal. In the case of wind, China's exports have grown while exports by other producers have declined, representing displacement on the global level.
However, on the level of importing countries, there has not been displacement. China's wind-turbine exports have mostly headed to countries with growing markets, while incumbent producers have seen a decline in sales, in some of their previously important markets.
For some clean-tech, exports from other producers have displaced Chinese supply. For example, tariffs and restrictions on the use of Chinese components have seen other producers expanding into existing markets for solar panels, solar inverters and heat pumps.
At the same time, China's exports of these technologies have been redirected into new markets, which previously imported little solar equipment.
Another indication of additionality is that Chinese clean-tech exports often target different market segments. For example, in the case of EVs, solar inverters and heat pumps, Chinese exports have much lower unit prices than equivalent exports from other producers.
Finally, it is worth noting that there has been much clearer displacement in the case of fuel-burning vehicles, where low-cost products from China have replaced exports from other suppliers.
Electrification export implicationsChina's clean-tech exports have become a key enabler of the global clean-energy transition, driving down the cost, opening up new markets and responding to the rapid increase in demand.
China's role as a major supplier of electrification technologies could give it a reason to support a push by the COP31 presidency for a global electrification target.
The country also has a large and growing role in financing and building clean-energy projects in many emerging countries, although this remains much smaller in scale than its exports.
When analysed on the country level, China's clean-tech exports have, by and large, not displaced exports by other producers in absolute terms. Rather, it has captured market growth and opened up clean-energy development in countries that previously did not import the technologies at all.
However, the sharp drop in clean-tech prices means that exporters that have only held their sales volumes steady have seen the value of their exports dwindle. They have also lost market share to China's exports. To retain market share, other exporters would need to expand production capacity.
Clean-energy technology has also become a cornerstone of China's economy, responsible for 16% of all net growth in total exports in the first half of 2026, although the share fell in the third quarter due to the broad surge in exports, even as cleantech growth accelerated as well.
More broadly, clean energy sectors contributed a third of China's GDP growth in 2025. This means that the country has a clear economic self-interest in the success of the global energy transition.
EV and wind deployment has continued to grow also in China domestically, but for solar and battery energy storage, the domestic market has dived after record volumes in 2025.
China's domestic clean-energy market is larger than the export market for most technologies. Only 43% of solar cells and panels, 13% EVs, 17% of batteries and 7% of wind turbines produced in China were exported in 2025, highlighting the importance of the home market for producers.
For solar, however, exports continue to expand and could outweigh China's domestic deployment after a slowdown in the sector in 2026. This could exacerbate overseas concerns about "unfair" trade practices, unless the domestic market picks up again.
About the dataThis analysis estimates the fossil fuel and CO2 emissions avoided outside China as a result of China's exports of solar, wind, electric-vehicle and battery technology.
Each exported unit of generating capacity is assumed to displace electricity from the grid of its destination country. Similarly, each exported electric vehicle is assumed to displace fuel in an equivalent internal-combustion vehicle.
Export volumes: Solar exports include finished modules as well as intermediates (wafers and cells), each expressed by Ember as finished-panel-equivalent gigawatts, with data taken from Ember's China solar exports tracker. Wind and battery export totals are taken from Chinese industry bodies the China Wind Energy Association (CWEA) and the China Automotive Battery Innovation Alliance (CABIA). They are distributed across destination countries and months using customs-value shares from Ember's China clean-tech exports tracker. Electric-vehicle volumes use vehicle counts from China Customs. Exports to Hong Kong are excluded and replaced with Hong Kong's onward re-exports, treated as Chinese exports.
Avoided emissions: For each technology, the analysis combines the destination country's average capacity factor and grid CO2 intensity, both derived from Ember's yearly electricity data. Missing or implausible values are filled with UN sub-regional and then global medians, while all EU destinations are assigned the EU-average grid to correct for re-export hubs such as the Netherlands. For vehicles and batteries, avoided oil and CO2 is estimated based on per-vehicle assumptions compiled from the literature, net of charging emissions at the destination grid. Electric two-wheelers are credited with displacing conventional two-wheeler use for 48% of their travel. Lifetime figures multiply annual avoided emissions by assumed operating lives of 20 years for solar and wind, 10 for vehicles and batteries, or five for two-wheelers. "Embodied" manufacturing emissions are subtracted from these totals. Manufacturing emissions are calculated using average Chinese emission intensities compiled from the literature. National emissions used for comparison are from the Energy Institute statistical review of world energy.
Attributing solar exports to final markets: Because customs data records only a shipment's first destination, the analysis traces Chinese wafers, modules and cells to their final destination using UN Comtrade bilateral import data. It identifies countries that import large amounts of solar modules and intermediates from China and export them further, classifying these onward exports as exports of Chinese goods, as long as they do not exceed the volume each country imported from China. It converts customs values to capacity using Ember's monthly module and cell prices.
The post Analysis: China's clean-tech exports in 2026 to avoid as much CO2 as Brazil emits in a year appeared first on Carbon Brief.
- 'New course on energy'
- Energy bills
- Warm homes plan
- Fuel duty and EVs
- CCS and hydrogen
- Data centres
- Other announcements
Chancellor John Healey has announced a "new course on energy" for the UK, focused on keeping bills low amid the global crisis triggered by war in the Middle East.
As he laid out his first budget, Healey said the Labour government would still prioritise the expansion of clean power and remain "unshakably committed to net-zero".
The budget sets out what the chancellor calls a "radical reform of energy", including a longer-term effort to "break the grip of gas on bills".
There are also a variety of short-term measures to curb energy bills, including a council-tax rebate and the removal of the gas "standing charge", though these fell far short of pre-budget calls to tackle high prices.
Moreover, in order to fund defence spending, the government is cutting £1bn from its "warm homes plan" and £700m from hydrogen and carbon capture and storage (CCS) projects.
The budget also appears to cut up to another £4.7bn from the warm homes plan - as well as ending zero-rated VAT for solar panels and extending a "temporary" 5p cut in fuel duty.
Finally, the government set out plans to ensure new data centres meet strict environmental regulations, while leaving the door open to on-site fossil-fuel power generation.
Below, Carbon Brief runs through the key climate- and energy-focused announcements from the budget.
- 'New course on energy'
- Energy bills
- Warm homes plan
- Fuel duty and EVs
- CCS and hydrogen
- Data centres
- Other announcements
Conflict in the Middle East has driven up energy bills for people in the UK, as the global trade in oil and gas has been thrown into disarray.
In this context, the new budget sets out a "shift in the government's approach to energy", focusing on "cheaper energy" as the main priority.
At the same time, Healey was clear that fossil fuels were driving the price increases and that clean power would be essential for the government's cost-cutting agenda.
In its accompanying analysis, the Office for Budget Responsibility (OBR) notes that "fossil-fuel prices rose by 83% in the year to September 2026".
In his speech, the chancellor announced a "radical reform of energy to reduce bills", stating:
"Today, I'm setting a new course on energy. To get UK energy costs down in line with Europe, from this point, our Labour government priority is first and foremost cheaper energy, with clean power key to achieving this. This is possible because of the progress we have made towards clean power over the last two years."
Conservative and Reform politicians have argued that the UK should abandon its net-zero targets, including Labour's "clean power by 2030" goal, in order to cut energy prices.
This is despite expensive gas driving most of the recent price increases and renewables saving the UK billions in gas imports since the start of the Hormuz crisis.
#gform_wrapper_7[data-form-index="0"].gform-theme,[data-parent-form="7_0"]{--gf-color-primary: #204ce5;--gf-color-primary-rgb: 32, 76, 229;--gf-color-primary-contrast: #fff;--gf-color-primary-contrast-rgb: 255, 255, 255;--gf-color-primary-darker: #001AB3;--gf-color-primary-lighter: #527EFF;--gf-color-secondary: #fff;--gf-color-secondary-rgb: 255, 255, 255;--gf-color-secondary-contrast: #112337;--gf-color-secondary-contrast-rgb: 17, 35, 55;--gf-color-secondary-darker: #F5F5F5;--gf-color-secondary-lighter: #FFFFFF;--gf-color-out-ctrl-light: rgba(17, 35, 55, 0.1);--gf-color-out-ctrl-light-rgb: 17, 35, 55;--gf-color-out-ctrl-light-darker: rgba(104, 110, 119, 0.35);--gf-color-out-ctrl-light-lighter: #F5F5F5;--gf-color-out-ctrl-dark: #585e6a;--gf-color-out-ctrl-dark-rgb: 88, 94, 106;--gf-color-out-ctrl-dark-darker: #112337;--gf-color-out-ctrl-dark-lighter: rgba(17, 35, 55, 0.65);--gf-color-in-ctrl: #fff;--gf-color-in-ctrl-rgb: 255, 255, 255;--gf-color-in-ctrl-contrast: #112337;--gf-color-in-ctrl-contrast-rgb: 17, 35, 55;--gf-color-in-ctrl-darker: #F5F5F5;--gf-color-in-ctrl-lighter: #FFFFFF;--gf-color-in-ctrl-primary: #204ce5;--gf-color-in-ctrl-primary-rgb: 32, 76, 229;--gf-color-in-ctrl-primary-contrast: #fff;--gf-color-in-ctrl-primary-contrast-rgb: 255, 255, 255;--gf-color-in-ctrl-primary-darker: #001AB3;--gf-color-in-ctrl-primary-lighter: #527EFF;--gf-color-in-ctrl-light: rgba(17, 35, 55, 0.1);--gf-color-in-ctrl-light-rgb: 17, 35, 55;--gf-color-in-ctrl-light-darker: rgba(104, 110, 119, 0.35);--gf-color-in-ctrl-light-lighter: #F5F5F5;--gf-color-in-ctrl-dark: #585e6a;--gf-color-in-ctrl-dark-rgb: 88, 94, 106;--gf-color-in-ctrl-dark-darker: #112337;--gf-color-in-ctrl-dark-lighter: rgba(17, 35, 55, 0.65);--gf-radius: 3px;--gf-font-size-secondary: 14px;--gf-font-size-tertiary: 13px;--gf-icon-ctrl-number: url("data:image/svg+xml,%3Csvg width='8' height='14' viewBox='0 0 8 14' fill='none' xmlns='http://www.w3.org/2000/svg'%3E%3Cpath fill-rule='evenodd' clip-rule='evenodd' d='M4 0C4.26522 5.96046e-08 4.51957 0.105357 4.70711 0.292893L7.70711 3.29289C8.09763 3.68342 8.09763 4.31658 7.70711 4.70711C7.31658 5.09763 6.68342 5.09763 6.29289 4.70711L4 2.41421L1.70711 4.70711C1.31658 5.09763 0.683417 5.09763 0.292893 4.70711C-0.0976311 4.31658 -0.097631 3.68342 0.292893 3.29289L3.29289 0.292893C3.48043 0.105357 3.73478 0 4 0ZM0.292893 9.29289C0.683417 8.90237 1.31658 8.90237 1.70711 9.29289L4 11.5858L6.29289 9.29289C6.68342 8.90237 7.31658 8.90237 7.70711 9.29289C8.09763 9.68342 8.09763 10.3166 7.70711 10.7071L4.70711 13.7071C4.31658 14.0976 3.68342 14.0976 3.29289 13.7071L0.292893 10.7071C-0.0976311 10.3166 -0.0976311 9.68342 0.292893 9.29289Z' fill='rgba(17, 35, 55, 0.65)'/%3E%3C/svg%3E");--gf-icon-ctrl-select: url("data:image/svg+xml,%3Csvg width='10' height='6' viewBox='0 0 10 6' fill='none' xmlns='http://www.w3.org/2000/svg'%3E%3Cpath fill-rule='evenodd' clip-rule='evenodd' d='M0.292893 0.292893C0.683417 -0.097631 1.31658 -0.097631 1.70711 0.292893L5 3.58579L8.29289 0.292893C8.68342 -0.0976311 9.31658 -0.0976311 9.70711 0.292893C10.0976 0.683417 10.0976 1.31658 9.70711 1.70711L5.70711 5.70711C5.31658 6.09763 4.68342 6.09763 4.29289 5.70711L0.292893 1.70711C-0.0976311 1.31658 -0.0976311 0.683418 0.292893 0.292893Z' fill='rgba(17, 35, 55, 0.65)'/%3E%3C/svg%3E");--gf-icon-ctrl-search: url("data:image/svg+xml,%3Csvg width='640' height='640' xmlns='http://www.w3.org/2000/svg'%3E%3Cpath d='M256 128c-70.692 0-128 57.308-128 128 0 70.691 57.308 128 128 128 70.691 0 128-57.309 128-128 0-70.692-57.309-128-128-128zM64 256c0-106.039 85.961-192 192-192s192 85.961 192 192c0 41.466-13.146 79.863-35.498 111.248l154.125 154.125c12.496 12.496 12.496 32.758 0 45.254s-32.758 12.496-45.254 0L367.248 412.502C335.862 434.854 297.467 448 256 448c-106.039 0-192-85.962-192-192z' fill='rgba(17, 35, 55, 0.65)'/%3E%3C/svg%3E");--gf-label-space-y-secondary: var(--gf-label-space-y-md-secondary);--gf-ctrl-border-color: #686e77;--gf-ctrl-size: var(--gf-ctrl-size-md);--gf-ctrl-label-color-primary: #112337;--gf-ctrl-label-color-secondary: #112337;--gf-ctrl-choice-size: var(--gf-ctrl-choice-size-md);--gf-ctrl-checkbox-check-size: var(--gf-ctrl-checkbox-check-size-md);--gf-ctrl-radio-check-size: var(--gf-ctrl-radio-check-size-md);--gf-ctrl-btn-font-size: var(--gf-ctrl-btn-font-size-md);--gf-ctrl-btn-padding-x: var(--gf-ctrl-btn-padding-x-md);--gf-ctrl-btn-size: var(--gf-ctrl-btn-size-md);--gf-ctrl-btn-border-color-secondary: #686e77;--gf-ctrl-file-btn-bg-color-hover: #EBEBEB;--gf-field-img-choice-size: var(--gf-field-img-choice-size-md);--gf-field-img-choice-card-space: var(--gf-field-img-choice-card-space-md);--gf-field-img-choice-check-ind-size: var(--gf-field-img-choice-check-ind-size-md);--gf-field-img-choice-check-ind-icon-size: var(--gf-field-img-choice-check-ind-icon-size-md);--gf-field-pg-steps-number-color: rgba(17, 35, 55, 0.8);} X/TwitterThis field is for validation purposes and should be left unchanged.Free weekly newsletter
.preheader p{ margin-top: 0; font-family: 'PT Sans', sans-serif; font-weight: var(--type--3--font-weight--bold); color: var(--button--color); font-size: var(--button--font-size, inherit); }
.newsletter-inline{
display: flex;
border: solid 1px #333333;
padding: 1em;
background: #ffffff;
}
.inline-email{
display:inline-block;
margin-right:1em;
margin-top:0 !important;
margin-bottom:0.5em;
}
#field_submit{
display:inline-block;
margin-top:0 !important;
}
.gform_wrapper .gfield+.gfield{
margin-top:0
}
Email
gform.initializeOnLoaded( function() {gformInitSpinner( 7, 'https://www.carbonbrief.org/wp-content/plugins/gravityforms/images/spinner.svg', false );jQuery('#gform_ajax_frame_7').on('load',function(){var contents = jQuery(this).contents().find('*').html();var is_postback = contents.indexOf('GF_AJAX_POSTBACK') >= 0;if(!is_postback){return;}var form_content = jQuery(this).contents().find('#gform_wrapper_7');var is_confirmation = jQuery(this).contents().find('#gform_confirmation_wrapper_7').length > 0;var is_redirect = contents.indexOf('gformRedirect(){') >= 0;var is_form = form_content.length > 0 && ! is_redirect && ! is_confirmation;var mt = parseInt(jQuery('html').css('margin-top'), 10) + parseInt(jQuery('body').css('margin-top'), 10) + 100;if(is_form){jQuery('#gform_wrapper_7').html(form_content.html());if(form_content.hasClass('gform_validation_error')){jQuery('#gform_wrapper_7').addClass('gform_validation_error');} else {jQuery('#gform_wrapper_7').removeClass('gform_validation_error');}setTimeout( function() { /* delay the scroll by 50 milliseconds to fix a bug in chrome */ jQuery(document).scrollTop(jQuery('#gform_wrapper_7').offset().top - mt); }, 50 );if(window['gformInitDatepicker']) {gformInitDatepicker();}if(window['gformInitPriceFields']) {gformInitPriceFields();}var current_page = jQuery('#gform_source_page_number_7').val();gformInitSpinner( 7, 'https://www.carbonbrief.org/wp-content/plugins/gravityforms/images/spinner.svg', false );jQuery(document).trigger('gform_page_loaded', [7, current_page]);window['gf_submitting_7'] = false;}else if(!is_redirect){var confirmation_content = jQuery(this).contents().find('.GF_AJAX_POSTBACK').html();if(!confirmation_content){confirmation_content = contents;}jQuery('#gform_wrapper_7').replaceWith(confirmation_content);jQuery(document).scrollTop(jQuery('#gf_7').offset().top - mt);jQuery(document).trigger('gform_confirmation_loaded', [7]);window['gf_submitting_7'] = false;wp.a11y.speak(jQuery('#gform_confirmation_message_7').text());}else{jQuery('#gform_7').append(contents);if(window['gformRedirect']) {gformRedirect();}}jQuery(document).trigger("gform_pre_post_render", [{ formId: "7", currentPage: "current_page", abort: function() { this.preventDefault(); } }]); if (event && event.defaultPrevented) { return; } const gformWrapperDiv = document.getElementById( "gform_wrapper_7" ); if ( gformWrapperDiv ) { const visibilitySpan = document.createElement( "span" ); visibilitySpan.id = "gform_visibility_test_7"; gformWrapperDiv.insertAdjacentElement( "afterend", visibilitySpan ); } const visibilityTestDiv = document.getElementById( "gform_visibility_test_7" ); let postRenderFired = false; function triggerPostRender() { if ( postRenderFired ) { return; } postRenderFired = true; gform.core.triggerPostRenderEvents( 7, current_page ); if ( visibilityTestDiv ) { visibilityTestDiv.parentNode.removeChild( visibilityTestDiv ); } } function debounce( func, wait, immediate ) { var timeout; return function() { var context = this, args = arguments; var later = function() { timeout = null; if ( !immediate ) func.apply( context, args ); }; var callNow = immediate && !timeout; clearTimeout( timeout ); timeout = setTimeout( later, wait ); if ( callNow ) func.apply( context, args ); }; } const debouncedTriggerPostRender = debounce( function() { triggerPostRender(); }, 200 ); if ( visibilityTestDiv && visibilityTestDiv.offsetParent === null ) { const observer = new MutationObserver( ( mutations ) => { mutations.forEach( ( mutation ) => { if ( mutation.type === 'attributes' && visibilityTestDiv.offsetParent !== null ) { debouncedTriggerPostRender(); observer.disconnect(); } }); }); observer.observe( document.body, { attributes: true, childList: false, subtree: true, attributeFilter: [ 'style', 'class' ], }); } else { triggerPostRender(); } } );} );
The government has not explicitly rolled back any climate targets and Healey stressed in his speech that "this government remains unshakably committed to net-zero by 2050".
Nevertheless, the budget document speaks of a "new energy pathway" on which the government's upcoming "10 year plan" will build. It also states:
"Cheaper electricity will boost electrification, increasing the UK's energy security and helping to decarbonise the whole economy."
The budget mentions short- and long-term measures to bring costs down, including expansion of the electricity grid. (See sections below for more details.)
Healey also used his speech to welcome the recent approval of the controversial Jackdaw gasfield, which he framed as a "pragmatic" decision that would boost UK "energy security".
The government is yet to make a decision on the Rosebank oilfield, but OBR forecasts released alongside the budget assume that it will be approved.
Energy billsThe budget offers short-term relief on household and industrial energy bills, as well as promising longer-term sectoral reform.
Nevertheless, it falls far short of proposals for cutting bills that had been set out by industry bodies, thinktanks, charities and energy companies ahead of the budget.
This has stoked expectations that the government may be forced to offer further support on energy bills after the price cap for January 2027 is announced later this year.
Forecasts suggest bills could rise by a quarter - some £470 - to around £2,200 a year.
The only substantive and immediate new bills measure in the budget is a £100 council-tax rebate for English households in bands A-D, which Healey said would cost £2.6bn.
Devolved governments will receive a share of the funding to provide their own support. Meanwhile, local authorities will receive an additional £100m to provide targeted support to households "acutely impacted" by rising energy bills.
In addition, Healey announced that the temporary removal of VAT from household electricity bills - worth around £45 per year - will be extended by three months, from April to July 2027.
Healey also made a commitment that no new policy costs would be added to energy bills until a comprehensive "cost-control framework" is in place. This is expected at the spending review in 2027. The budget says:
"The government will introduce a new comprehensive cost control framework (CCF) at the spending review in 2027 that will set budgets for components of energy costs, including policy costs, to ensure government action drives bills down over the next 10 years."
"As part of this, the budget specifies that going forward, the government will only procure new clean-power projects that lower bills and can easily connect to the grid.
It specifically notes that the upcoming eighth "contracts for difference" (CfD) auction (AR8) "will lower bills, as well as deliver[ing] a good outcome for energy security and climate".
Speaking to Carbon Brief, James Dyson, senior researcher at E3G says that an effective framework should "set out a specific, timebound commitment to remove the hidden costs from energy bills which have accumulated over the last two decades", as well as providing oversight of system costs in the future.
A planned levy on gas bills - a long-term funding mechanism for the low-carbon hydrogen dubbed the "gas shipper obligation" - will be moved into general taxation, so that "government rather than consumers fund the costs of hydrogen projects".
On the morning of the budget, the government announced that the "unfair and outdated" gas standing charge would be removed for around 23m homes in the UK.
A standing charge is a fixed daily fee paid by households as part of their bill, regardless of how much gas they use. This costs around £108 a year for a typical household.
The government says it will ask energy regulator Ofgem to move the cost of the standing charge onto gas unit rates in 2027, or as soon as possible. It says this will save 60% of households an average of around £45 a year on their gas bill
The change will disproportionately benefit the poorest households, according to analysis from thinktank Nesta shown in the figure below.
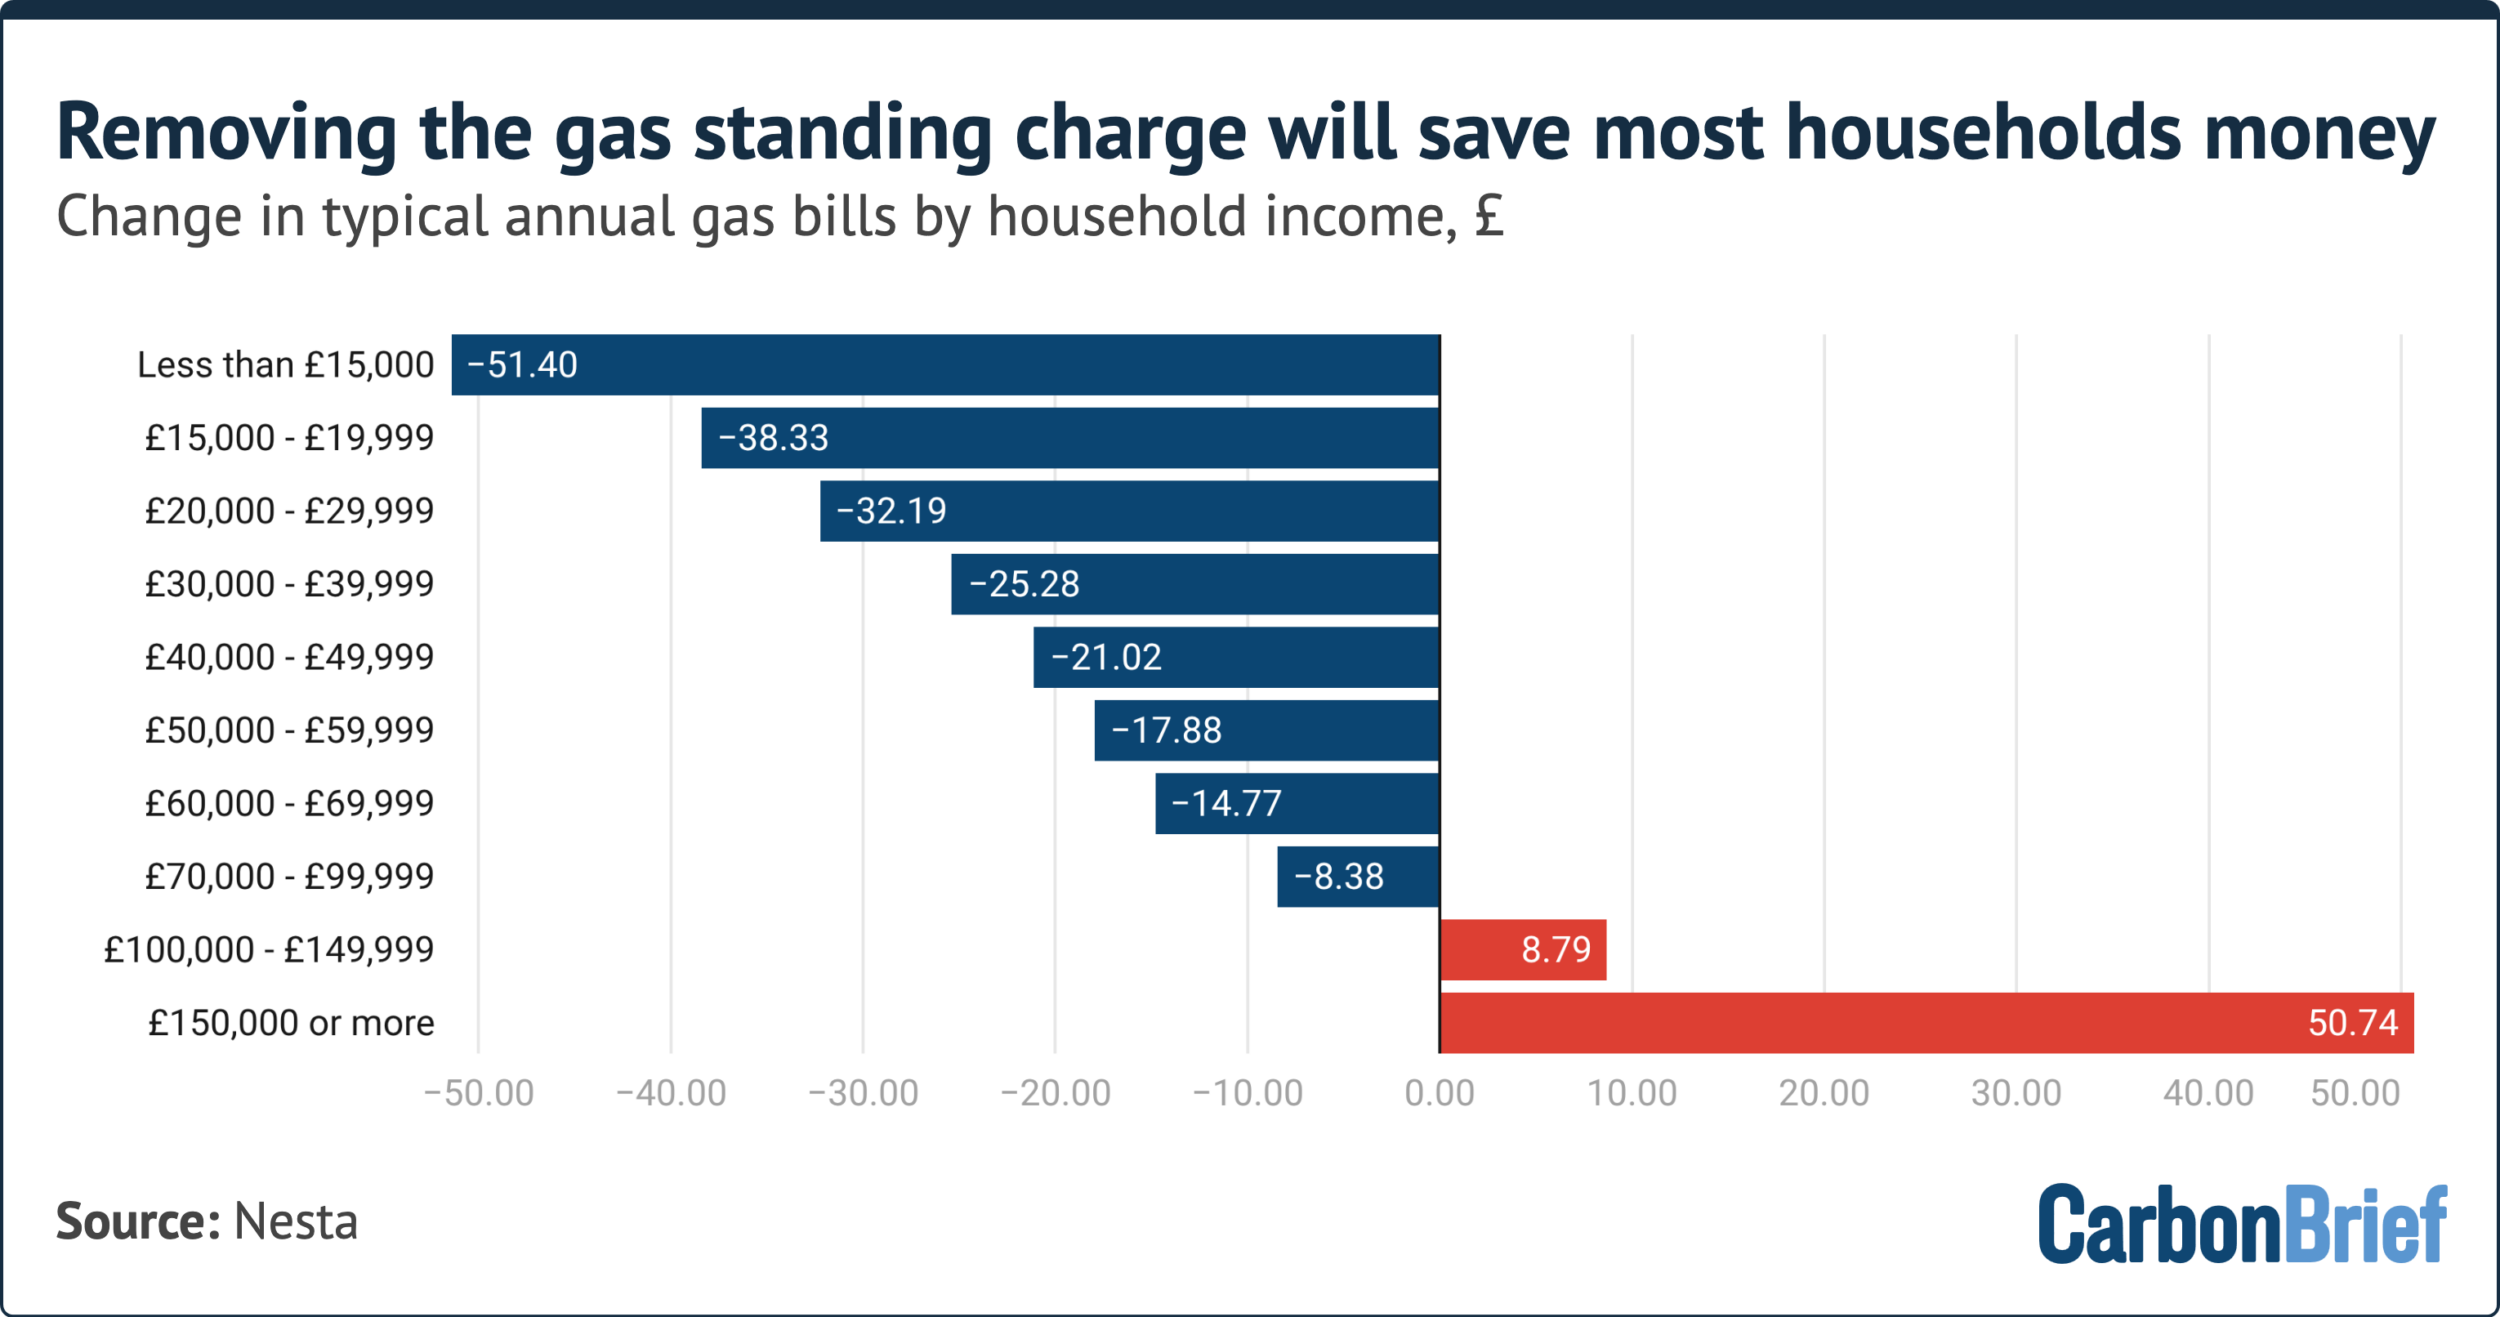
Nesta says the shift will reduce the "spark gap" - the ratio between electricity and gas prices - by around 0.3 points, from 3.3 under the current price cap to 3.0. This could help encourage a shift to electrified technologies, such as heat pumps and electric vehicles (EVs).
The budget also includes a commitment to "reform" standing charges on electricity bills, with further details to be published in 2027.
However, Jess Britton at UKERC tells Carbon Brief that "simply moving [electricity standing] charges on to unit costs risks disincentivising electrification".
From next year, the government will introduce a new "energy debt circuit breaker", which will save billpayers £30 by 2030, according to the budget.
This is designed to "tackle the scourge of energy debt", which currently adds around £60 to typical household energy bills each year, according to Carbon Brief analysis. .
The initiative follows warnings from trade association Energy UK that customer energy debt is on course to hit £7bn by the end of 2026, potentially adding another £10-15 to bills.
The budget also confirmed additional support for business energy bills. It says the "British industrial competitiveness scheme" (BICS) will be expanded to provide a 20-25% electricity discount to 10,000 energy-intensive manufacturing firms from April 2027. This will include back-payments for 2026-27.
In the longer term, the budget includes a commitment to "breaking the grip of gas on bills".
A consultation published alongside the budget fleshes out the options for a proposed "wholesale contracts for difference" (WCfD) scheme, initially outlined in April. This would offer fixed-price contracts to eligible renewable-energy generators.
The expansion of renewables is already helping to decouple gas and power prices, with gas setting wholesale electricity prices around 60% of the time in 2025, down from around 90% in the early 2020s.
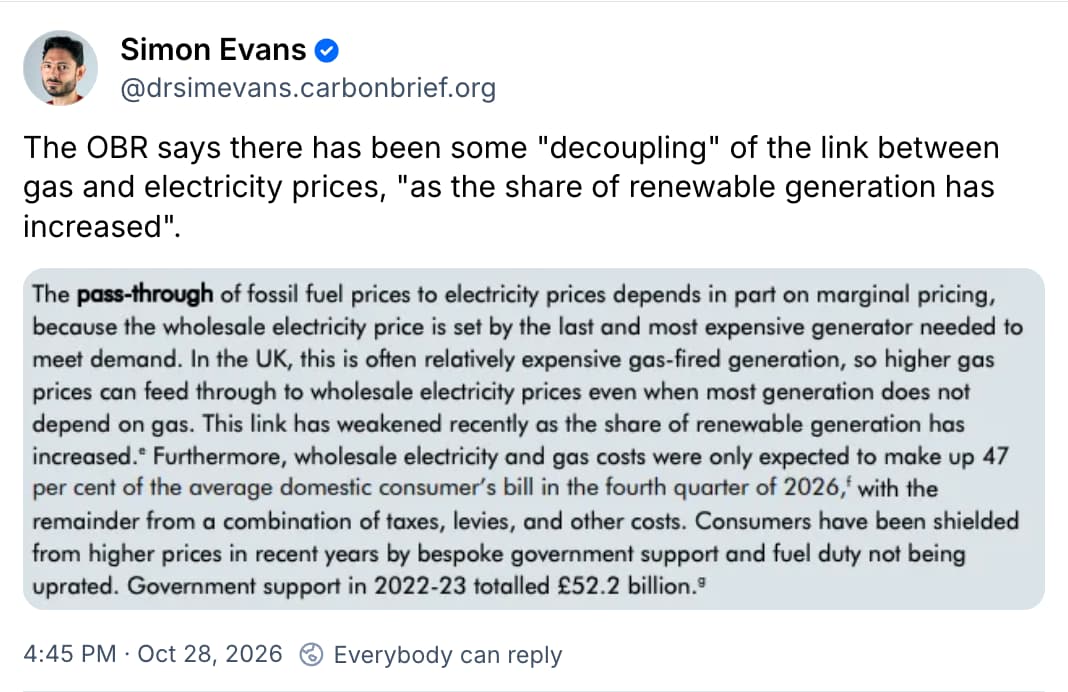 Warm homes plan
Following speculation in the run-up to the budget, chancellor Healey confirmed a cut to the UK's flagship energy efficiency programme.
His budget cuts £1bn from the "warm homes plan" to help cover a shortfall in defence spending.
The warm homes plan is supposed to provide up to 5m households with £15bn of grants and loans to support the installation of heat pumps, rooftop solar panels and insulation.
The budget states that the "government remains committed to heat-pump deployment".
It says it will continue to fund the "boiler upgrade scheme" (BUS) at current funding levels of £400m in 2027‑28, after which it will rise broadly in line with inflation.
However, this represents a significant cut in funding for heat-pump deployment of around £800m, relative to previously announced levels. Analysts tell Carbon Brief that this could lead to around 100,000 heat pumps not being installed over three years.
Andrew Sissons, director in sustainable future at Nesta tells Carbon Brief:
"The chancellor has announced that funding for future heat-pump subsidies will be reduced by nearly £800m over three years. This is a backward step at a time when Britain urgently needs to move away from using gas."
In addition to the £1bn in lost grants for the warm-homes plan, the budget also suggests that significant additional funding for the scheme has been cut.
It says a new £4.7bn "your first home" scheme is being funded by reallocating "financial transactions" previously allocated to the energy and environment departments.
While the details of this shift remain sparse, this suggests funding for the warm homes plan could end up being reduced from the headline £15bn to as little as £9bn, analysts tell Carbon Brief.
E3G's Dyson adds:
"An unknown amount of funding has been cut from the 'financial transactions' pot, which is money that is used to loan to businesses and households. The cut is between £1.5bn and £5bn.
"The government's not even tried to spend this money, it only officially launched its [warm-homes] loan scheme today. Businesses and households need certainty to invest in decarbonising homes and this kind of reaction does not support it."
Ben Westerman, director of policy and advocacy at campaign group Electrify Britain, tells Carbon Brief that "all in all, [the budget is] really disappointing for electrification".
The budget comes the day after the government launched its "warm homes loan" scheme, which offers households no- and low-interest loans of between £7,500 and £35,000 for installing technologies such as solar panels, batteries and heat pumps.
According to the government, households that install a heat pump, a battery and solar panels could save £550 a year on their energy bills. This could rise to £800 a year when combined with a time-of-use tariff.
Fuel duty and EVsThe budget froze fuel duty once again - for the 16th year in a row.
Chancellor Healey also confirmed the extension of the 5p per litre fuel-duty cut announced in 2022 under Conservative then-chancellor Rishi Sunak, in response to the energy crisis triggered by the Russian invasion of Ukraine.
The cumulative cost of these freezes has now reached £139bn since 2010-2011, according to the OBR. If fuel duty continues to be frozen until 2029-30, the OBR says that public-sector net borrowing will rise by £4.3bn.
.cb-tweet img{ border: solid 1.25px #333333; border-radius: 5px; } @media (max-width:650px){ .cb-tweet{ width:100%; } }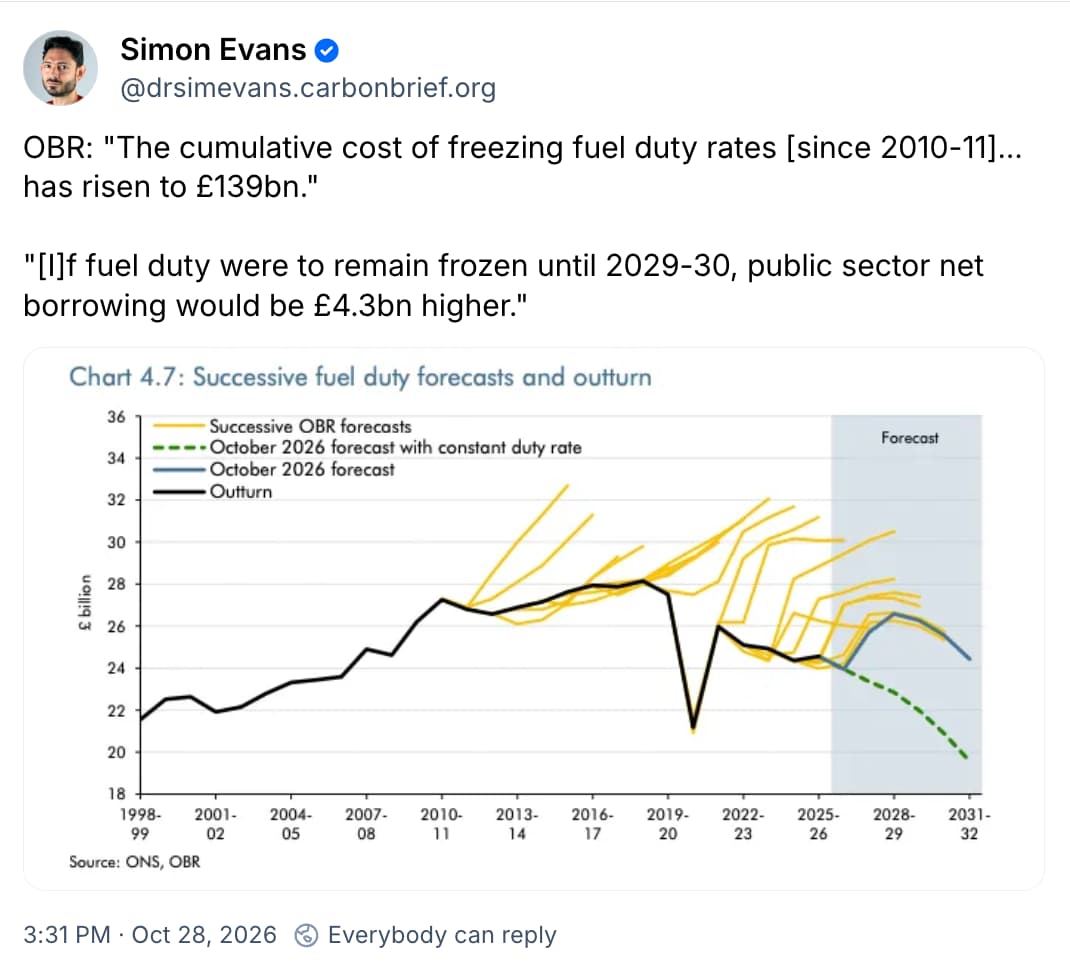
Alongside the budget, the government published an independent review of the cost of public EV charging. This includes plans to cut prices at local, lower-powered public chargers, saving drivers around £150 a year on average, according to the government.
This will be funded through £100m of government money over two years from spring 2027.
Additionally, the government states that it is "laying the groundwork for a better system in the future" by taking forward a recommendation by the review to launch a "tariff porting" taskforce. This will explore ways to allow drivers to use cheaper domestic tariffs at certain public chargers.
However, the budget also specifies that "electricity supplied through publicly accessible and workplace electric-vehicle charging points is subject to 20% VAT and is not considered domestic use". This definition will take effect from 1 November 2026, as part of legislation in the finance bill 2026-27.
Industry bodies criticised this categorisation, with Shane Brennan, CEO of ChargeUK, writing in a statement on LinkedIn that it will "do serious damage to the EV transition". He continues:
"Instead of listening to the call of EV drivers for fairness on VAT, the government has slammed the door shut on ending a rank unfairness between at-home and out-of-home charging…[which] even the courts ruled to be illegal earlier this year."
Within the budget, the government confirmed some changes to the electric-vehicle excise duty (eVED) pay-per-mile tax, announced in last year's budget. This includes introducing a mileage estimate tool, developing an opt-in system for connectivity and other changes.
The government will publish its response to the zero-emissions vehicle mandate review by the end of 2026, with a view to changes taking place in 2027.
CCS and hydrogenThe government has confirmed a £200m cut in capital-grant funding for CCS and £500m for low-carbon hydrogen projects.
This is part of the Department for Energy Security and Net Zero (DESNZ) "reprioritising its budget" to contribute more to the UK's defence spending.
There are four planned CCS "clusters" in the works across the UK - part of a government-backed effort to make the nation an "early leader" in the sector.
The budget says the government will "prioritise" the two "mature" clusters under development on Teesside, and on Merseyside and North Wales. These include "blue-hydrogen" production, gas power with CCS and industrial uses.
It also says the government will "maintain grant funding" for the Viking cluster in the Humber region.
The £200m in removed funding will therefore come from the Acorn cluster, which was planned for north-east Scotland.
At the same time, the government says it is "actively looking at how loan or equity investments can support the continued development of future CCS and hydrogen projects…including for the Acorn cluster".
While the Labour government has stressed the importance of CCS for reaching the UK's net-zero targets, the billions in public spending committed to these projects have drawn criticism from both climate activists and climate sceptics.
Details of the cuts remain limited, but Prof Rob Gross, director of the UK Energy Research Centre, tells Carbon Brief:
"The history of CCS investment in the UK is not a happy one and if the government wishes to retain investor confidence and the regional economic benefits that the clusters could bring then a repeat of the precipitous cuts made in 2015 must be avoided. It appears that the government is aware and treading carefully."
Data centresAs part of efforts to boost the UK's use of artificial intelligence (AI), the budget sets out a "data-centre covenant", with "tests" that data centres must meet to gain approval.
These include a stipulation that developers must pay for "any energy costs they create", while also "support[ing] grid resilience, flexibility and clean power".
The "covenant" will also require data centres to "adhere to the highest environmental standards", including protecting nature, curbing water use, publishing energy-use data and using waste heat to heat nearby buildings "wherever practical".
In return, the government will use new planning powers to accelerate the grid connection of data centres, alongside other "strategically important" projects.
When grid connection is not immediately available, the government says it will set out a framework to allow on-site generation until a grid connection can be secured.
The government stresses that on-site generation will be "tightly controlled" and "only…available for exceptionally strategic projects".
Nevertheless, NGOs raised the likelihood that "on-site power" would come in the form of gas or diesel generation, rather than clean power, potentially threatening the UK's climate goals.
Other announcementsThere were various other climate- and energy-related announcements in the budget, including:
- The government has not extended zero-rated VAT for "energy saving materials" - including solar panels - when installed on homes beyond the end of March 2027.
- The budget confirms the establishment of an "energy wealth fund", which was recently announced as a way to invest revenues from North Sea oil and gas into low-carbon energy infrastructure.
- The government is legislating for the "oil and gas revenue levy" to replace the "energy profits levy" when that ends by April 2030 at the latest.
- It freezes the electricity main rates of the "climate-change levy" from April 2028, in order to "reduce electricity costs in real terms for businesses".
- As part of the government's efforts to promote housebuilding, it has introduced an exemption from "biodiversity net gain" requirements for residential brownfield developments on sites up to 1.5 hectares in England.
Analysis: How the UK spent more than £11.6bn on climate aid since 2021
28.10.2026
UK policy
Revealed: UK relied on £2bn of 'questionable accounting' to hit its climate-aid goal
28.10.2026
UK policy
Q&A: Why are UK energy bills so high - and how could they be lowered?
27.10.2026
Oil and gas
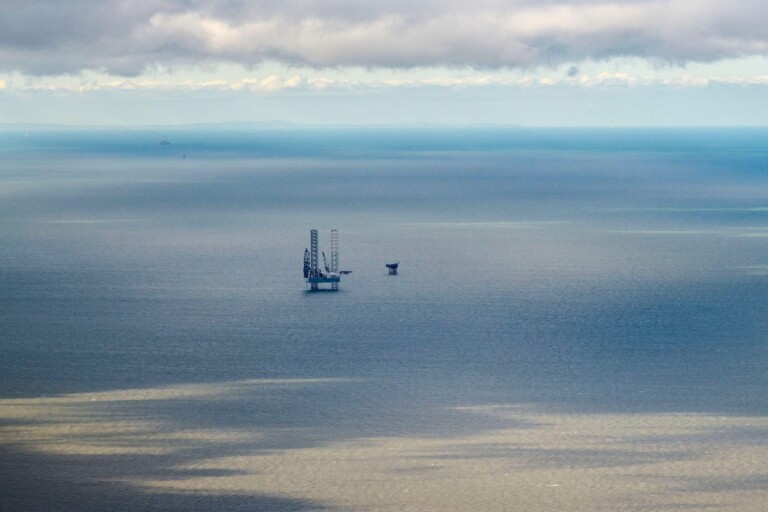 Revealed: Expensive gas behind 'nearly 90%' of rise in UK electricity bills
21.10.2026
Oil and gas
The post UK budget 2026: Key climate and energy announcements appeared first on Carbon Brief.
The UK has beaten its target to provide £11.6bn of climate aid to developing countries by 2026 - but only through "questionable accounting".
As part of its obligations under the Paris Agreement, the UK pledged to give at least £11.6bn in overseas "climate finance" between 2021 and 2026.
Now, Carbon Brief analysis reveals that around £2.1bn of the funds the UK counted towards this goal did not come from new spending.
Instead, the government relabelled existing funding for development banks, private-sector investment and aid for Afghanistan, Sudan and other war-torn nations as "climate finance".
Without these changes, the UK would have fallen nearly £1bn short of its target.
Carbon Brief's analysis is based on numerous FOI requests and reveals the otherwise-unpublished details of the UK's climate-finance spending.
Experts and MPs say the use of "questionable" accounting shows the UK is "cutting corners" to hit its climate goals, while making unprecedented cuts to its foreign aid budget.
'Moving the goalposts'The UK and other developed countries are obliged under UN climate treaties to provide "new and additional" climate finance to help developing countries tackle climate change.
They also have specific targets to "mobilise" $100bn of climate finance per year through to 2025 and "at least" $300bn by 2035.
As the UK's contribution to international climate finance, in 2019 the Conservative government pledged to provide £11.6bn between the financial years 2021-22 and 2025-26. This amounted to "doubling" its previous five-year target.
Since then, successive governments have slashed the amount of money going towards foreign aid, citing economic strain and a need for more defence spending. This has placed great pressure on the £11.6bn target, which comes from the UK aid budget.
In order to retain the target while cutting aid, the Conservative government decided in 2023 to loosen the criteria for what it defined as "climate" spending.
This enabled the UK to remain committed to the £11.6bn goal, without spending more on new climate projects, by simply relabelling existing funds. The current Labour government has opted to maintain this approach, while pledging to cut aid spending even further.
The move has been strongly criticised by campaigners, MPs and even the UK's official aid watchdog, who have described it as "creative accounting" and "moving the goalposts".
'£1bn shortfall'The UK government has announced that it met the £11.6bn target, but has not released the full details of how it did so - or even the total amount provided by 2025-26.
FOI data obtained by Carbon Brief over the course of several months reveals that, in fact, total climate finance over the past five years reached £12.8bn - with a record £4bn in the past year alone.
However, Carbon Brief analysis of government data also shows that around £2.1bn - nearly a fifth of the total - comes from the government's accounting changes.
Without these changes, as the chart below shows, cumulative UK climate finance would only have reached around £10.7bn by 2026, leaving a shortfall of £924m.
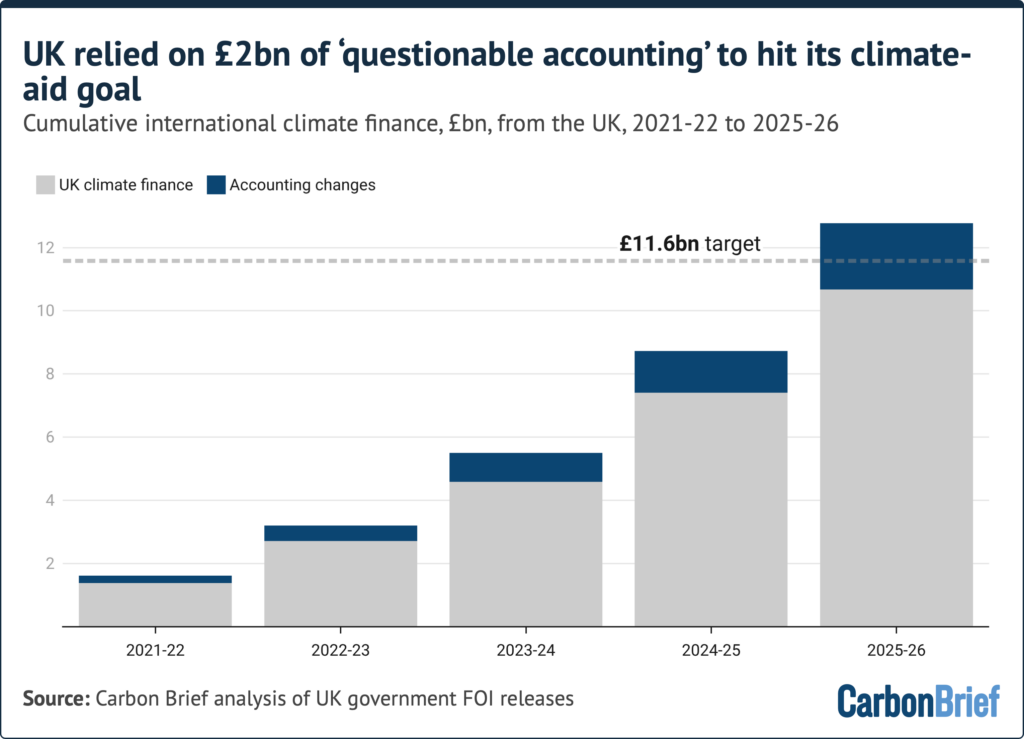
This final figure of £2.1bn is higher than forecast by the UK Independent Commission for Aid Impact (ICAI), which estimated in 2024 that the total amount of "reclassified" climate finance would reach £1.7bn.
The government has stressed that its accounting changes are "consistent" with "internationally agreed ways of calculating ICF", used by other major donors.
(Experts have noted that, traditionally, the UK was viewed as taking a more rigorous approach to climate-finance accounting, which is notoriously unregulated and opaque.)
A recent International Development Committee (IDC) report noted that developed countries have committed to providing "new and additional" climate finance to developing countries, which is generally interpreted as extra funds on top of existing aid.
Evidence gathered by the IDC concluded that, alongside aid cuts, the UK's accounting changes have "eroded" the "additionality and credibility" of its climate finance.
Responding to Carbon Brief's findings, IDC chair Sarah Champion said the data "shines a new light" on the committee's findings:
"The picture is not getting any better. If questionable accounting has been used to get around a £1bn shortfall on ICF spend between 2021-22 and 2025-26, this only underlines my concerns that the government has been cutting corners to maintain headline climate-spending commitments, rather than working to deliver genuine climate and nature outcomes."
These accounting changes remain relevant as the UK begins its next phase of international climate finance, while cutting the aid budget further.
The government has pledged £6bn of foreign aid for climate projects over the next three years. This makes the UK one of the only major donor countries to set out a new climate-finance target for the period after 2025, despite a global pledge to scale up support.
Nevertheless, the new UK goal amounts to a halving from £4bn in the financial year 2025-26 to £2bn a year, on average. Previous Carbon Brief analysis also shows that the continued use of "questionable accounting" is likely to make up around a third of the new target.
Responding to Carbon Brief's analysis, a UK government spokesperson says:
"We are proud to have both hit, and exceeded, our third international climate-finance target - and will continue to work hard on protecting climate and nature.
"Climate change and nature loss pose a real and significant threat to global security and prosperity. That is why the UK is leading action on climate and nature, and prioritising climate finance in its aid budget."
Accounting changesThe UK's accounting changes break down into three major components, which are behind most of its upward revision in climate-finance spending.
The first is counting a share of "core" funding for multilateral development banks (MDBs) as climate finance.
This refers to un-earmarked contributions that governments provide to support these banks in their work, which includes providing loans and grants to developing countries.
Counting this spending as "climate finance" adds £1.1bn to the total of £12.8bn, split mainly between the World Bank and the African Development Bank.
As the chart below shows, this is by far the largest chunk of extra climate finance resulting from the UK's accounting changes.
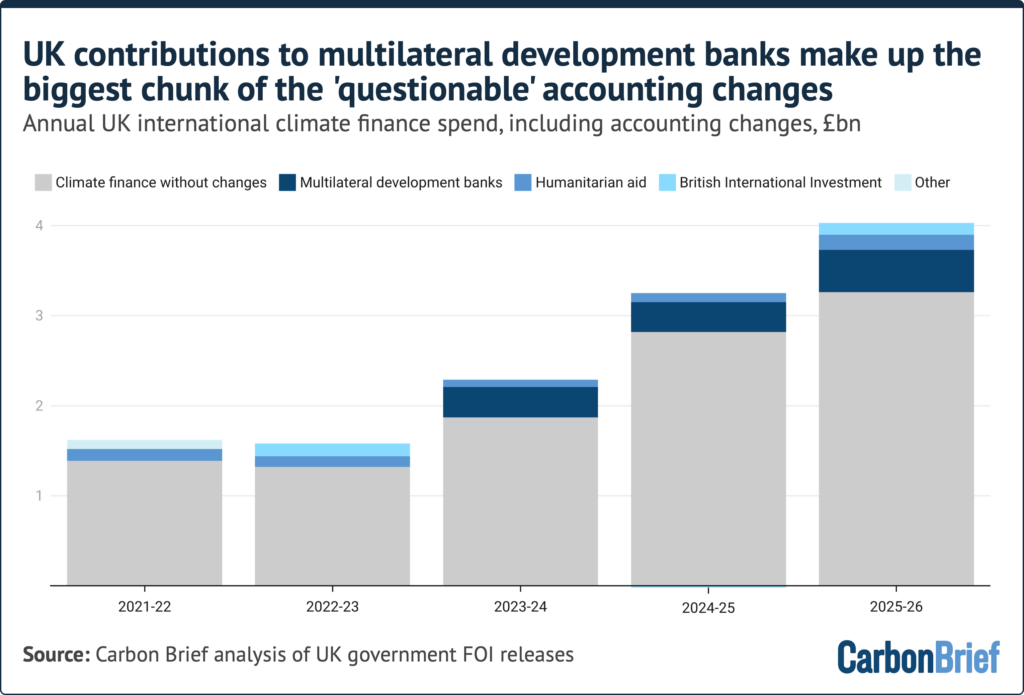 A spreadsheet with details of these accounting changes can be viewed here.
This revision has been justified on the grounds that the World Bank and other banks have clear targets for funding climate-relevant projects, using their core funding.
However, MDBs have also faced criticism for their lack of transparency around climate finance and their reliance on loans, rather than grants. (In contrast, nearly all of the UK's climate finance so far has been grant-based.)
Moreover, the US has been pressuring MDBs to drop their climate plans altogether. Indeed, the Trump administration has already forced the World Bank to abandon its overall target to put 45% of its funds towards climate finance.
Jon Sward, environment project manager at the Bretton Woods Project NGO, tells Carbon Brief:
"One thing removing the overall [World Bank] target definitely does is it adds…a lack of predictability of the flows going forward."
The second-largest UK accounting change - contributing nearly £600m - comes from automatically counting 30% of humanitarian aid as climate finance, if it is going to one of the countries judged most vulnerable to climate change.
This includes some of the most war-torn and low-income nations in the world, such as Afghanistan, Sudan and the Democratic Republic of the Congo.
Crucially, this means projects are counted even if they have no discernible link to climate change, such as helping "conflict-affected" people in Yemen and orphans in Zimbabwe.
The Center for Global Development (CGD) has described this revision as "arbitrary", given every aid project is already screened for any climate-relevant components.
The third significant portion comes from counting more of the government's private-sector investments via British International Investment (BII) as climate finance. BII is a publicly owned, for-profit company that invests in developing-country businesses and is partially funded with injections of UK aid money.
The UK government decided to start calculating the climate share of its BII spending based on real-world BII investments, rather than a default, fixed share of 30%.
Data obtained by Carbon Brief via FOI suggests that £133m of extra BII funding was labelled as climate finance over the first four years of the £11.6bn target.
However, government records of BII climate finance have been inconsistent, making it difficult to estimate the total impact of accounting changes. Therefore, Carbon Brief has used an earlier internal government forecast that estimated this change would add a total of £266m over the five-year target period.
BII has increasingly turned its attention to investing in clean power in recent years, reaching more than £1bn in "climate investments" in 2025.
However, the company has faced criticism for investments that "conflict" with UK priorities - including legacy fossil-fuel investments - as well as channelling aid money to "billionaires".
There was also some extra spending that the government decided to count as climate aid - notably, £99m of "spending on COP26", from when the UK hosted the climate summit.
Shruti Agarwal, senior climate finance adviser at Save the Children UK, tells Carbon Brief the reduction in overall "financial effort" by the UK is a "concerning pattern that must cease". She adds:
"[The UK should] strengthen transparency by publishing timely, detailed data on international climate spending and stop classifying expenditure as climate finance retrospectively, as seen with COP26 expenses."
MethodologyCarbon Brief obtained the full datasets of international climate-finance spending via FOI, covering the five-year period 2021-22 to 2025-26. For more details and to access the full dataset, see Carbon Brief's analysis of the £12.8bn in spending over this period.
In addition, Carbon Brief requested details from the Foreign, Commonwealth and Development Office (FCDO) of what climate-finance spending would have been prior to the 2023 accounting changes, for the period 2021-22 to 2024-25.
Carbon Brief then used this information to calculate the impact of accounting changes in 2025-26, combining the figures to work out the full impact.
A spreadsheet with the full details of the accounting changes can be viewed here.
UK climate-finance figures have been subject to regular revisions. While this analysis is based on final figures provided via FOI requests in recent months, it is possible that departments will still change the figures in future releases.
Related
Analysis: How the UK spent more than £11.6bn on climate aid since 2021
28.10.2026
UK policy
Q&A: Why are UK energy bills so high - and how could they be lowered?
27.10.2026
Oil and gas
Revealed: Expensive gas behind 'nearly 90%' of rise in UK electricity bills
21.10.2026
Oil and gas
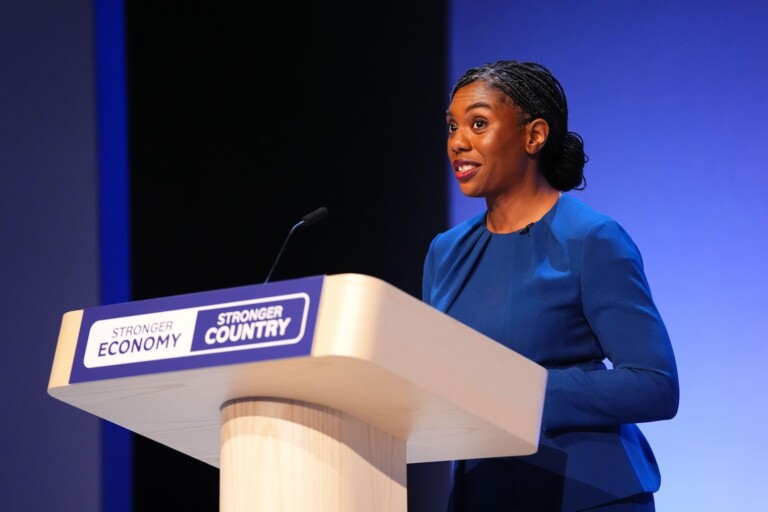 Factcheck: UK Conservatives double the 'cost of net-zero' after spreadsheet blunder
09.10.2026
UK policy
The post Revealed: UK relied on £2bn of 'questionable accounting' to hit its climate-aid goal appeared first on Carbon Brief.
- The UK has supported around 500 climate projects since 2021
- UK climate aid has reached record levels - but is set to drop
- Afghanistan received more bilateral climate aid than any other country
- Development banks and private-sector funders are among the biggest beneficiaries
- Methodology
The UK has spent £12.8bn on climate aid for developing countries since 2021, according to official figures obtained by Carbon Brief.
Freedom-of-information (FOI) requests reveal how the UK has used its "climate finance" to support everything from solar projects in Mozambique to carbon offsets in the Amazon.
UK climate funding, which reached a record £4bn this year, has supported roughly 500 aid projects, climate funds and private-investment initiatives over the past five years.
With this spending, the UK has surpassed its £11.6bn climate-finance target for this period, although Carbon Brief analysis shows that it has partly relied on "questionable accounting".
This target is part of the UK's ongoing responsibility under UN climate treaties to financially support developing countries in their efforts to tackle climate change.
Despite being central to its international climate policy, the UK government does not routinely release data on progress towards its climate-finance goals.
Here, Carbon Brief has published the data in full for the first time and pulled out key trends since 2021.
The UK has supported around 500 climate projects since 2021According to the FOI data obtained by Carbon Brief, at least 493 projects, funds and institutions received UK climate finance between 2021-22 and 2025-26.
These included £45m to help Ukraine curb its reliance on fossil fuels, £40m in cash transfers for Kenyans affected by drought and £30m to provide flood resilience in Nepal.
Larger sums were provided to projects spread across multiple countries, often with the stated goal of "mobilising" additional finance from the private sector.
For example, the UK channelled £198m into a World Bank-backed project to help Colombia, Cambodia and others create and sell "high-integrity" carbon offsets.
The UK also provided £229m to a group that uses foreign aid to attract private capital for projects in predominantly low-income nations, such as a solar farm in Uganda and a "sustainable aviation fuel" project in Pakistan.
All of the funded projects can be viewed in the interactive table below.
The UK has been criticised by campaigners and MPs for its lack of transparency around climate finance data.
In line with its international obligations, the government routinely releases its climate-finance figures to the UN - albeit with a two-year delay.
However, it does not publish this data broken down by financial year, making it impossible to accurately gauge progress towards the £11.6bn goal.
The data gathered by Carbon Brief is therefore the most comprehensive attempt to track this information to date. Carbon Brief has been periodically tracking this data since 2017.
UK climate aid has reached record levels - but is set to dropThe UK government committed in 2019 to spending £11.6bn of the nation's aid budget on "climate finance", between 2021-22 and 2025-26.
This is the nation's contribution to an international goal to mobilise $100bn of climate finance a year between 2020 and 2025.
Developed countries are obliged under UN climate treaties to financially support developing countries, assisting their efforts to cut emissions and adapt to climate change.
However, alongside other major donors, such as the US, the UK has dramatically cut its aid budget, placing significant strain on the nation's climate finance.
Despite this, FOI data shows that UK climate finance reached a record £4bn in 2025-26, as shown in the chart below.
Not accounting for inflation, this amounts to a tenfold increase from 2011-12, when the UK started providing climate finance.
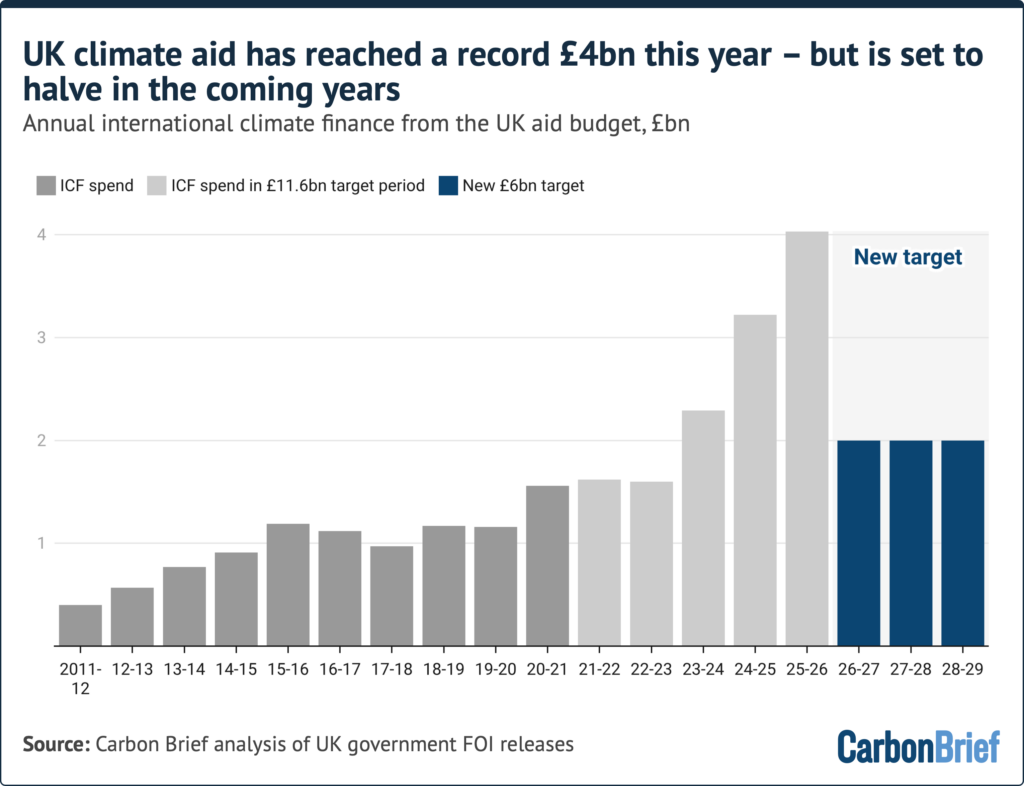
The £11.6bn target was met comfortably, with £12.8bn provided over the five-year period.
However, as separate Carbon Brief analysis shows, the target was only met due to the government reclassifying £2.2bn of existing foreign aid as climate finance, without spending any more.
Rather than setting a new five-year goal, in March 2026 the Labour government committed to spending "around £6bn" of UK aid as climate finance over the next three years. On average, this would mean £2bn in climate aid annually - roughly half the level achieved in the financial year 2025-26.
#gform_wrapper_7[data-form-index="0"].gform-theme,[data-parent-form="7_0"]{--gf-color-primary: #204ce5;--gf-color-primary-rgb: 32, 76, 229;--gf-color-primary-contrast: #fff;--gf-color-primary-contrast-rgb: 255, 255, 255;--gf-color-primary-darker: #001AB3;--gf-color-primary-lighter: #527EFF;--gf-color-secondary: #fff;--gf-color-secondary-rgb: 255, 255, 255;--gf-color-secondary-contrast: #112337;--gf-color-secondary-contrast-rgb: 17, 35, 55;--gf-color-secondary-darker: #F5F5F5;--gf-color-secondary-lighter: #FFFFFF;--gf-color-out-ctrl-light: rgba(17, 35, 55, 0.1);--gf-color-out-ctrl-light-rgb: 17, 35, 55;--gf-color-out-ctrl-light-darker: rgba(104, 110, 119, 0.35);--gf-color-out-ctrl-light-lighter: #F5F5F5;--gf-color-out-ctrl-dark: #585e6a;--gf-color-out-ctrl-dark-rgb: 88, 94, 106;--gf-color-out-ctrl-dark-darker: #112337;--gf-color-out-ctrl-dark-lighter: rgba(17, 35, 55, 0.65);--gf-color-in-ctrl: #fff;--gf-color-in-ctrl-rgb: 255, 255, 255;--gf-color-in-ctrl-contrast: #112337;--gf-color-in-ctrl-contrast-rgb: 17, 35, 55;--gf-color-in-ctrl-darker: #F5F5F5;--gf-color-in-ctrl-lighter: #FFFFFF;--gf-color-in-ctrl-primary: #204ce5;--gf-color-in-ctrl-primary-rgb: 32, 76, 229;--gf-color-in-ctrl-primary-contrast: #fff;--gf-color-in-ctrl-primary-contrast-rgb: 255, 255, 255;--gf-color-in-ctrl-primary-darker: #001AB3;--gf-color-in-ctrl-primary-lighter: #527EFF;--gf-color-in-ctrl-light: rgba(17, 35, 55, 0.1);--gf-color-in-ctrl-light-rgb: 17, 35, 55;--gf-color-in-ctrl-light-darker: rgba(104, 110, 119, 0.35);--gf-color-in-ctrl-light-lighter: #F5F5F5;--gf-color-in-ctrl-dark: #585e6a;--gf-color-in-ctrl-dark-rgb: 88, 94, 106;--gf-color-in-ctrl-dark-darker: #112337;--gf-color-in-ctrl-dark-lighter: rgba(17, 35, 55, 0.65);--gf-radius: 3px;--gf-font-size-secondary: 14px;--gf-font-size-tertiary: 13px;--gf-icon-ctrl-number: url("data:image/svg+xml,%3Csvg width='8' height='14' viewBox='0 0 8 14' fill='none' xmlns='http://www.w3.org/2000/svg'%3E%3Cpath fill-rule='evenodd' clip-rule='evenodd' d='M4 0C4.26522 5.96046e-08 4.51957 0.105357 4.70711 0.292893L7.70711 3.29289C8.09763 3.68342 8.09763 4.31658 7.70711 4.70711C7.31658 5.09763 6.68342 5.09763 6.29289 4.70711L4 2.41421L1.70711 4.70711C1.31658 5.09763 0.683417 5.09763 0.292893 4.70711C-0.0976311 4.31658 -0.097631 3.68342 0.292893 3.29289L3.29289 0.292893C3.48043 0.105357 3.73478 0 4 0ZM0.292893 9.29289C0.683417 8.90237 1.31658 8.90237 1.70711 9.29289L4 11.5858L6.29289 9.29289C6.68342 8.90237 7.31658 8.90237 7.70711 9.29289C8.09763 9.68342 8.09763 10.3166 7.70711 10.7071L4.70711 13.7071C4.31658 14.0976 3.68342 14.0976 3.29289 13.7071L0.292893 10.7071C-0.0976311 10.3166 -0.0976311 9.68342 0.292893 9.29289Z' fill='rgba(17, 35, 55, 0.65)'/%3E%3C/svg%3E");--gf-icon-ctrl-select: url("data:image/svg+xml,%3Csvg width='10' height='6' viewBox='0 0 10 6' fill='none' xmlns='http://www.w3.org/2000/svg'%3E%3Cpath fill-rule='evenodd' clip-rule='evenodd' d='M0.292893 0.292893C0.683417 -0.097631 1.31658 -0.097631 1.70711 0.292893L5 3.58579L8.29289 0.292893C8.68342 -0.0976311 9.31658 -0.0976311 9.70711 0.292893C10.0976 0.683417 10.0976 1.31658 9.70711 1.70711L5.70711 5.70711C5.31658 6.09763 4.68342 6.09763 4.29289 5.70711L0.292893 1.70711C-0.0976311 1.31658 -0.0976311 0.683418 0.292893 0.292893Z' fill='rgba(17, 35, 55, 0.65)'/%3E%3C/svg%3E");--gf-icon-ctrl-search: url("data:image/svg+xml,%3Csvg width='640' height='640' xmlns='http://www.w3.org/2000/svg'%3E%3Cpath d='M256 128c-70.692 0-128 57.308-128 128 0 70.691 57.308 128 128 128 70.691 0 128-57.309 128-128 0-70.692-57.309-128-128-128zM64 256c0-106.039 85.961-192 192-192s192 85.961 192 192c0 41.466-13.146 79.863-35.498 111.248l154.125 154.125c12.496 12.496 12.496 32.758 0 45.254s-32.758 12.496-45.254 0L367.248 412.502C335.862 434.854 297.467 448 256 448c-106.039 0-192-85.962-192-192z' fill='rgba(17, 35, 55, 0.65)'/%3E%3C/svg%3E");--gf-label-space-y-secondary: var(--gf-label-space-y-md-secondary);--gf-ctrl-border-color: #686e77;--gf-ctrl-size: var(--gf-ctrl-size-md);--gf-ctrl-label-color-primary: #112337;--gf-ctrl-label-color-secondary: #112337;--gf-ctrl-choice-size: var(--gf-ctrl-choice-size-md);--gf-ctrl-checkbox-check-size: var(--gf-ctrl-checkbox-check-size-md);--gf-ctrl-radio-check-size: var(--gf-ctrl-radio-check-size-md);--gf-ctrl-btn-font-size: var(--gf-ctrl-btn-font-size-md);--gf-ctrl-btn-padding-x: var(--gf-ctrl-btn-padding-x-md);--gf-ctrl-btn-size: var(--gf-ctrl-btn-size-md);--gf-ctrl-btn-border-color-secondary: #686e77;--gf-ctrl-file-btn-bg-color-hover: #EBEBEB;--gf-field-img-choice-size: var(--gf-field-img-choice-size-md);--gf-field-img-choice-card-space: var(--gf-field-img-choice-card-space-md);--gf-field-img-choice-check-ind-size: var(--gf-field-img-choice-check-ind-size-md);--gf-field-img-choice-check-ind-icon-size: var(--gf-field-img-choice-check-ind-icon-size-md);--gf-field-pg-steps-number-color: rgba(17, 35, 55, 0.8);} EmailThis field is for validation purposes and should be left unchanged.Free weekly newsletter
.preheader p{ margin-top: 0; font-family: 'PT Sans', sans-serif; font-weight: var(--type--3--font-weight--bold); color: var(--button--color); font-size: var(--button--font-size, inherit); }
.newsletter-inline{
display: flex;
border: solid 1px #333333;
padding: 1em;
background: #ffffff;
}
.inline-email{
display:inline-block;
margin-right:1em;
margin-top:0 !important;
margin-bottom:0.5em;
}
#field_submit{
display:inline-block;
margin-top:0 !important;
}
.gform_wrapper .gfield+.gfield{
margin-top:0
}
Email
gform.initializeOnLoaded( function() {gformInitSpinner( 7, 'https://www.carbonbrief.org/wp-content/plugins/gravityforms/images/spinner.svg', false );jQuery('#gform_ajax_frame_7').on('load',function(){var contents = jQuery(this).contents().find('*').html();var is_postback = contents.indexOf('GF_AJAX_POSTBACK') >= 0;if(!is_postback){return;}var form_content = jQuery(this).contents().find('#gform_wrapper_7');var is_confirmation = jQuery(this).contents().find('#gform_confirmation_wrapper_7').length > 0;var is_redirect = contents.indexOf('gformRedirect(){') >= 0;var is_form = form_content.length > 0 && ! is_redirect && ! is_confirmation;var mt = parseInt(jQuery('html').css('margin-top'), 10) + parseInt(jQuery('body').css('margin-top'), 10) + 100;if(is_form){jQuery('#gform_wrapper_7').html(form_content.html());if(form_content.hasClass('gform_validation_error')){jQuery('#gform_wrapper_7').addClass('gform_validation_error');} else {jQuery('#gform_wrapper_7').removeClass('gform_validation_error');}setTimeout( function() { /* delay the scroll by 50 milliseconds to fix a bug in chrome */ jQuery(document).scrollTop(jQuery('#gform_wrapper_7').offset().top - mt); }, 50 );if(window['gformInitDatepicker']) {gformInitDatepicker();}if(window['gformInitPriceFields']) {gformInitPriceFields();}var current_page = jQuery('#gform_source_page_number_7').val();gformInitSpinner( 7, 'https://www.carbonbrief.org/wp-content/plugins/gravityforms/images/spinner.svg', false );jQuery(document).trigger('gform_page_loaded', [7, current_page]);window['gf_submitting_7'] = false;}else if(!is_redirect){var confirmation_content = jQuery(this).contents().find('.GF_AJAX_POSTBACK').html();if(!confirmation_content){confirmation_content = contents;}jQuery('#gform_wrapper_7').replaceWith(confirmation_content);jQuery(document).scrollTop(jQuery('#gf_7').offset().top - mt);jQuery(document).trigger('gform_confirmation_loaded', [7]);window['gf_submitting_7'] = false;wp.a11y.speak(jQuery('#gform_confirmation_message_7').text());}else{jQuery('#gform_7').append(contents);if(window['gformRedirect']) {gformRedirect();}}jQuery(document).trigger("gform_pre_post_render", [{ formId: "7", currentPage: "current_page", abort: function() { this.preventDefault(); } }]); if (event && event.defaultPrevented) { return; } const gformWrapperDiv = document.getElementById( "gform_wrapper_7" ); if ( gformWrapperDiv ) { const visibilitySpan = document.createElement( "span" ); visibilitySpan.id = "gform_visibility_test_7"; gformWrapperDiv.insertAdjacentElement( "afterend", visibilitySpan ); } const visibilityTestDiv = document.getElementById( "gform_visibility_test_7" ); let postRenderFired = false; function triggerPostRender() { if ( postRenderFired ) { return; } postRenderFired = true; gform.core.triggerPostRenderEvents( 7, current_page ); if ( visibilityTestDiv ) { visibilityTestDiv.parentNode.removeChild( visibilityTestDiv ); } } function debounce( func, wait, immediate ) { var timeout; return function() { var context = this, args = arguments; var later = function() { timeout = null; if ( !immediate ) func.apply( context, args ); }; var callNow = immediate && !timeout; clearTimeout( timeout ); timeout = setTimeout( later, wait ); if ( callNow ) func.apply( context, args ); }; } const debouncedTriggerPostRender = debounce( function() { triggerPostRender(); }, 200 ); if ( visibilityTestDiv && visibilityTestDiv.offsetParent === null ) { const observer = new MutationObserver( ( mutations ) => { mutations.forEach( ( mutation ) => { if ( mutation.type === 'attributes' && visibilityTestDiv.offsetParent !== null ) { debouncedTriggerPostRender(); observer.disconnect(); } }); }); observer.observe( document.body, { attributes: true, childList: false, subtree: true, attributeFilter: [ 'style', 'class' ], }); } else { triggerPostRender(); } } );} );
This amounts to a significant reduction from the £11.6bn pledge, especially once accounting changes and inflation are factored in, as Carbon Brief analysis shows.
Alongside the £6bn in climate aid, the government has also pledged to invest £6.7bn from outside the aid budget to "drive climate and nature outcomes".
Rather than grant funding, this support will include private investments, export credit and guarantees to development banks. The UK already provides such finance, but has not previously counted it towards its climate-finance targets.
Afghanistan received more bilateral climate aid than any other countryThe vast majority of UK climate finance was delivered "multilaterally", meaning it supports large funds or institutions working in multiple countries.
More than 80% of the funding since 2021 is therefore listed as helping "developing countries" in general, or whole regions such as "Africa".
Of the £2.1bn (17%) that was delivered "bilaterally", with the UK directly supporting climate projects in specific countries, the biggest beneficiaries are nations in east Africa and south Asia. Around two-thirds of this funding goes to nations classified as "least developed".
For many years, Ethiopia has been the top recipient of bilateral UK climate finance, largely due to long-running projects supporting ecosystem restoration and drought resilience.
However, Afghanistan overtook Ethiopia over the £11.6bn period, with £256m of its aid labelled as climate-related, compared to Ethiopia's £226m. (The UK does not provide aid via the Taliban, instead channelling it through partners, such as UN agencies.)
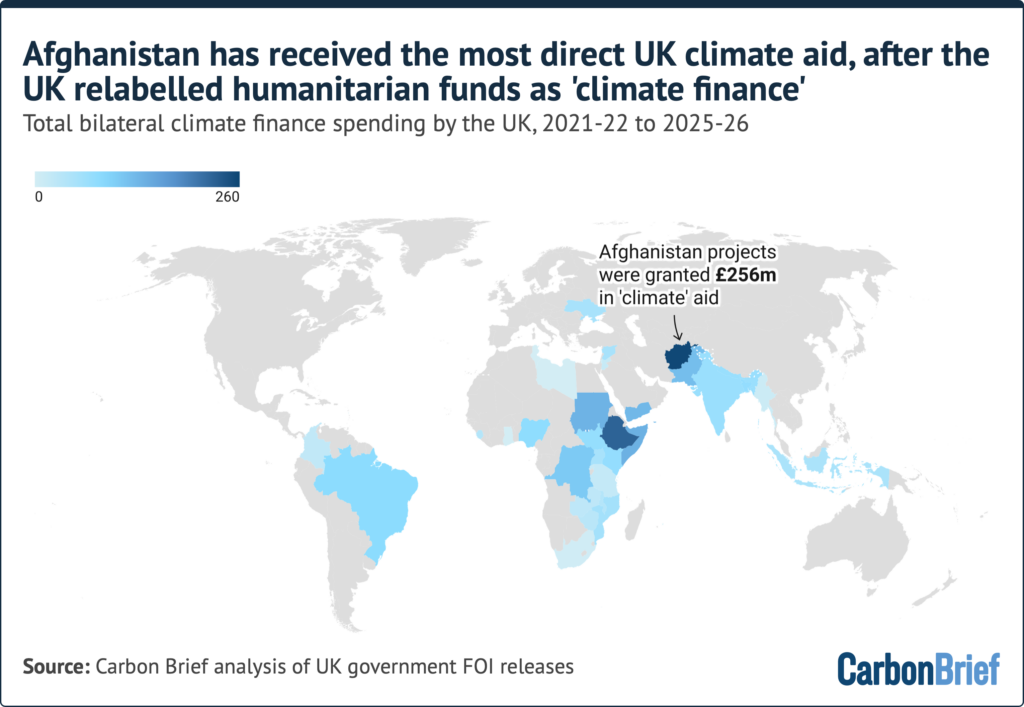
Afghanistan is struggling with floods and low electricity access. However, the UK's apparent surge in support for the nation is not, in fact, due to new climate-related initiatives.
Instead, it is the result of the UK automatically labelling 30% of aid for all humanitarian projects in this country as "climate finance", following a controversial accounting change.
This shift affected other climate-vulnerable and war-torn nations, meaning Somalia (£139m), Sudan (£136m) and Yemen (£130m) were also among the top recipients of "climate aid".
Where the UK has provided large sums of climate finance to projects in middle-income nations, they are typically aimed at "mobilising" private-sector investment, rather than achieving humanitarian goals.
Examples include £83m to support Brazil's Amazon Fund - a carbon offsetting initiative - and £43m to boost UK investment in India's low-carbon infrastructure.
Development banks and private-sector funders are among the biggest beneficiariesThe largest chunks of UK climate finance are channelled via international climate funds and other bodies, which in turn use that funding to support climate projects in developing countries.
Despite recently cutting its 2024-27 support for the Green Climate Fund, the UK still provided £1.5bn to this flagship UN fund - more than any other initiative.
British International Investment (BII), a publicly owned, for-profit company that invests in developing-country businesses and is partially supported with UK aid money, received almost £1.4bn.
The UK has increasingly been relying on BII to meet its climate-finance goals, partly reflecting the body's decision to prioritise clean-energy investments, rather than fossil fuels.
Other major recipients of UK climate finance are multilateral development banks, particularly the various arms of the World Bank and the African Development Bank. This reflects the UK's decision to start counting "core" funding for these banks as climate finance.
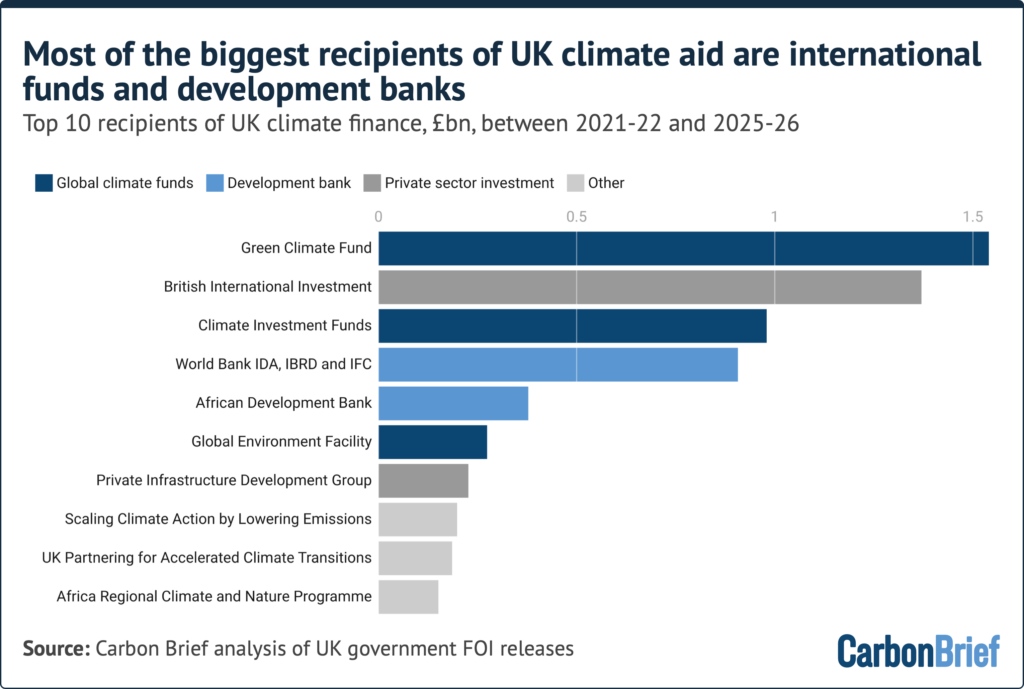
The government's accounting changes - which have boosted the significance of BII and MDBs in UK climate finance - have faced criticism from experts, MPs and the UK's aid watchdog. For more, see Carbon Brief's full analysis of these changes.
MethodologyAll of the international climate-finance data used in this piece was obtained via FOI requests. Carbon Brief has compiled the data into a spreadsheet, which can be accessed here.
UK climate finance comes from the aid budgets of four departments, with the Foreign, Commonwealth and Development Office (FCDO) providing three-quarters of the total.
The remainder comes predominantly from the Department for Energy Security and Net Zero (DESNZ), with much smaller sums from the Department for Environment, Food and Rural Affairs (Defra) and the Department for Business, Innovation, Science and Trade (BIST).
BIST has also released a dataset detailing the hundreds of climate-science projects in developing countries - or benefiting those countries - that have been supported with UK climate funds.
UK climate-finance figures have been subject to regular revisions. While this analysis is based on final figures provided via FOI requests in recent months, it is possible that departments will still change the figures in future releases.
Related
Revealed: UK relied on £2bn of 'questionable accounting' to hit its climate-aid goal
28.10.2026
UK policy
Q&A: Why are UK energy bills so high - and how could they be lowered?
27.10.2026
Oil and gas
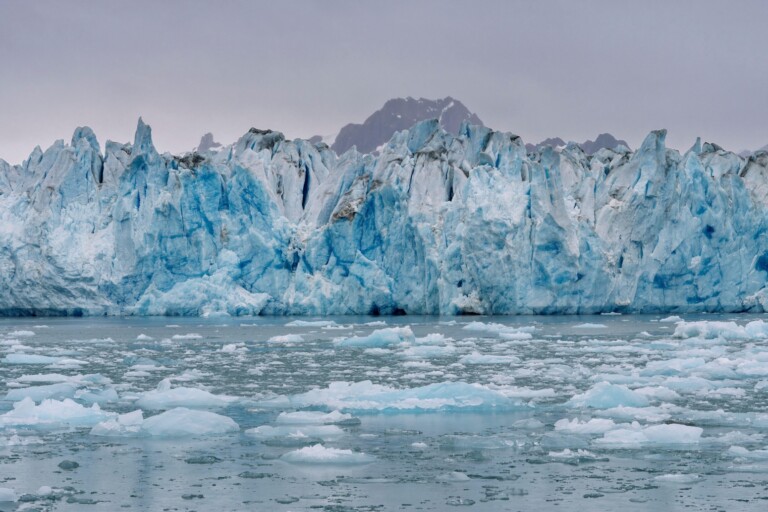 Guest post: Greenland ice sheet shrinks for 30th year in a row
27.10.2026
Greenland
Chart: A record two-thirds of car sales in China are now electric vehicles
23.10.2026
China policy
The post Analysis: How the UK spent more than £11.6bn on climate aid since 2021 appeared first on Carbon Brief.
- What is driving high energy bills?
- What has been done to limit bills so far?
- What options are there for bringing down bills?
- Is there a 'cheap power' alternative if the UK slows down?
- Can electrification of homes and businesses help cut bills?
Energy bills in the UK have continued to soar in 2026, with intense debate raging about how to bring them down.
In October 2026, the cap on household energy bills reached its highest level in three years, rising by £60 amid high gas prices driven by the Iran war.
The cap is forecast to jump by as much as another quarter in January 2027, pushing annual energy bills towards £2,200.
Energy bills have not been that high since 2022 when, in the fallout of the Russian invasion of Ukraine, the UK government spent more than £60bn on supporting consumers through the crisis.
While expensive gas is behind the lion's share of the rise in bills since 2020, policy costs and investment in the gas and electricity grids are also putting some pressure on prices.
This has sparked conflicting calls to continue the clean-energy transition to get off the "fossil-fuel rollercoaster", to move more slowly - or to abandon climate goals in favour of more gas.
Below, Carbon Brief looks at the real drivers of high energy bills in the UK, what has been done to address them to date and what options are available to cut them going forward.
These include taking more policy costs off electricity bills, boosting flexibility or shifting to more efficient technologies with lower running costs, such as heat pumps and electric vehicles (EVs).
- What is driving high energy bills?
- What has been done to limit bills so far?
- What options are there for bringing down bills?
- Is there a 'cheap power' alternative if the UK slows down?
- Can electrification of homes and businesses help cut bills?
In October 2026, UK household energy bills reached their highest levels since 2022, with the price cap for typical homes hitting £1,723 per year, up 47% in real terms since October 2020.
Industrial energy users also face high costs, particularly for their electricity.
For households, another sharp increase is now all but guaranteed under the price cap for January 2027, which is forecast to rise by around 25% from current levels.
Wholesale costs for electricity and gas make up 44% of the current cap of £1,723 per year, according to Carbon Brief analysis of figures from thinktank Nesta, shown in the figure below.
The wholesale cost of both electricity and gas is tied to gas prices, due to the marginal pricing system used in power markets in the UK and most other countries.
Network charges make up a further 24% of bills and operating costs are another 17%, whereas policy costs only account for 7% of the total.
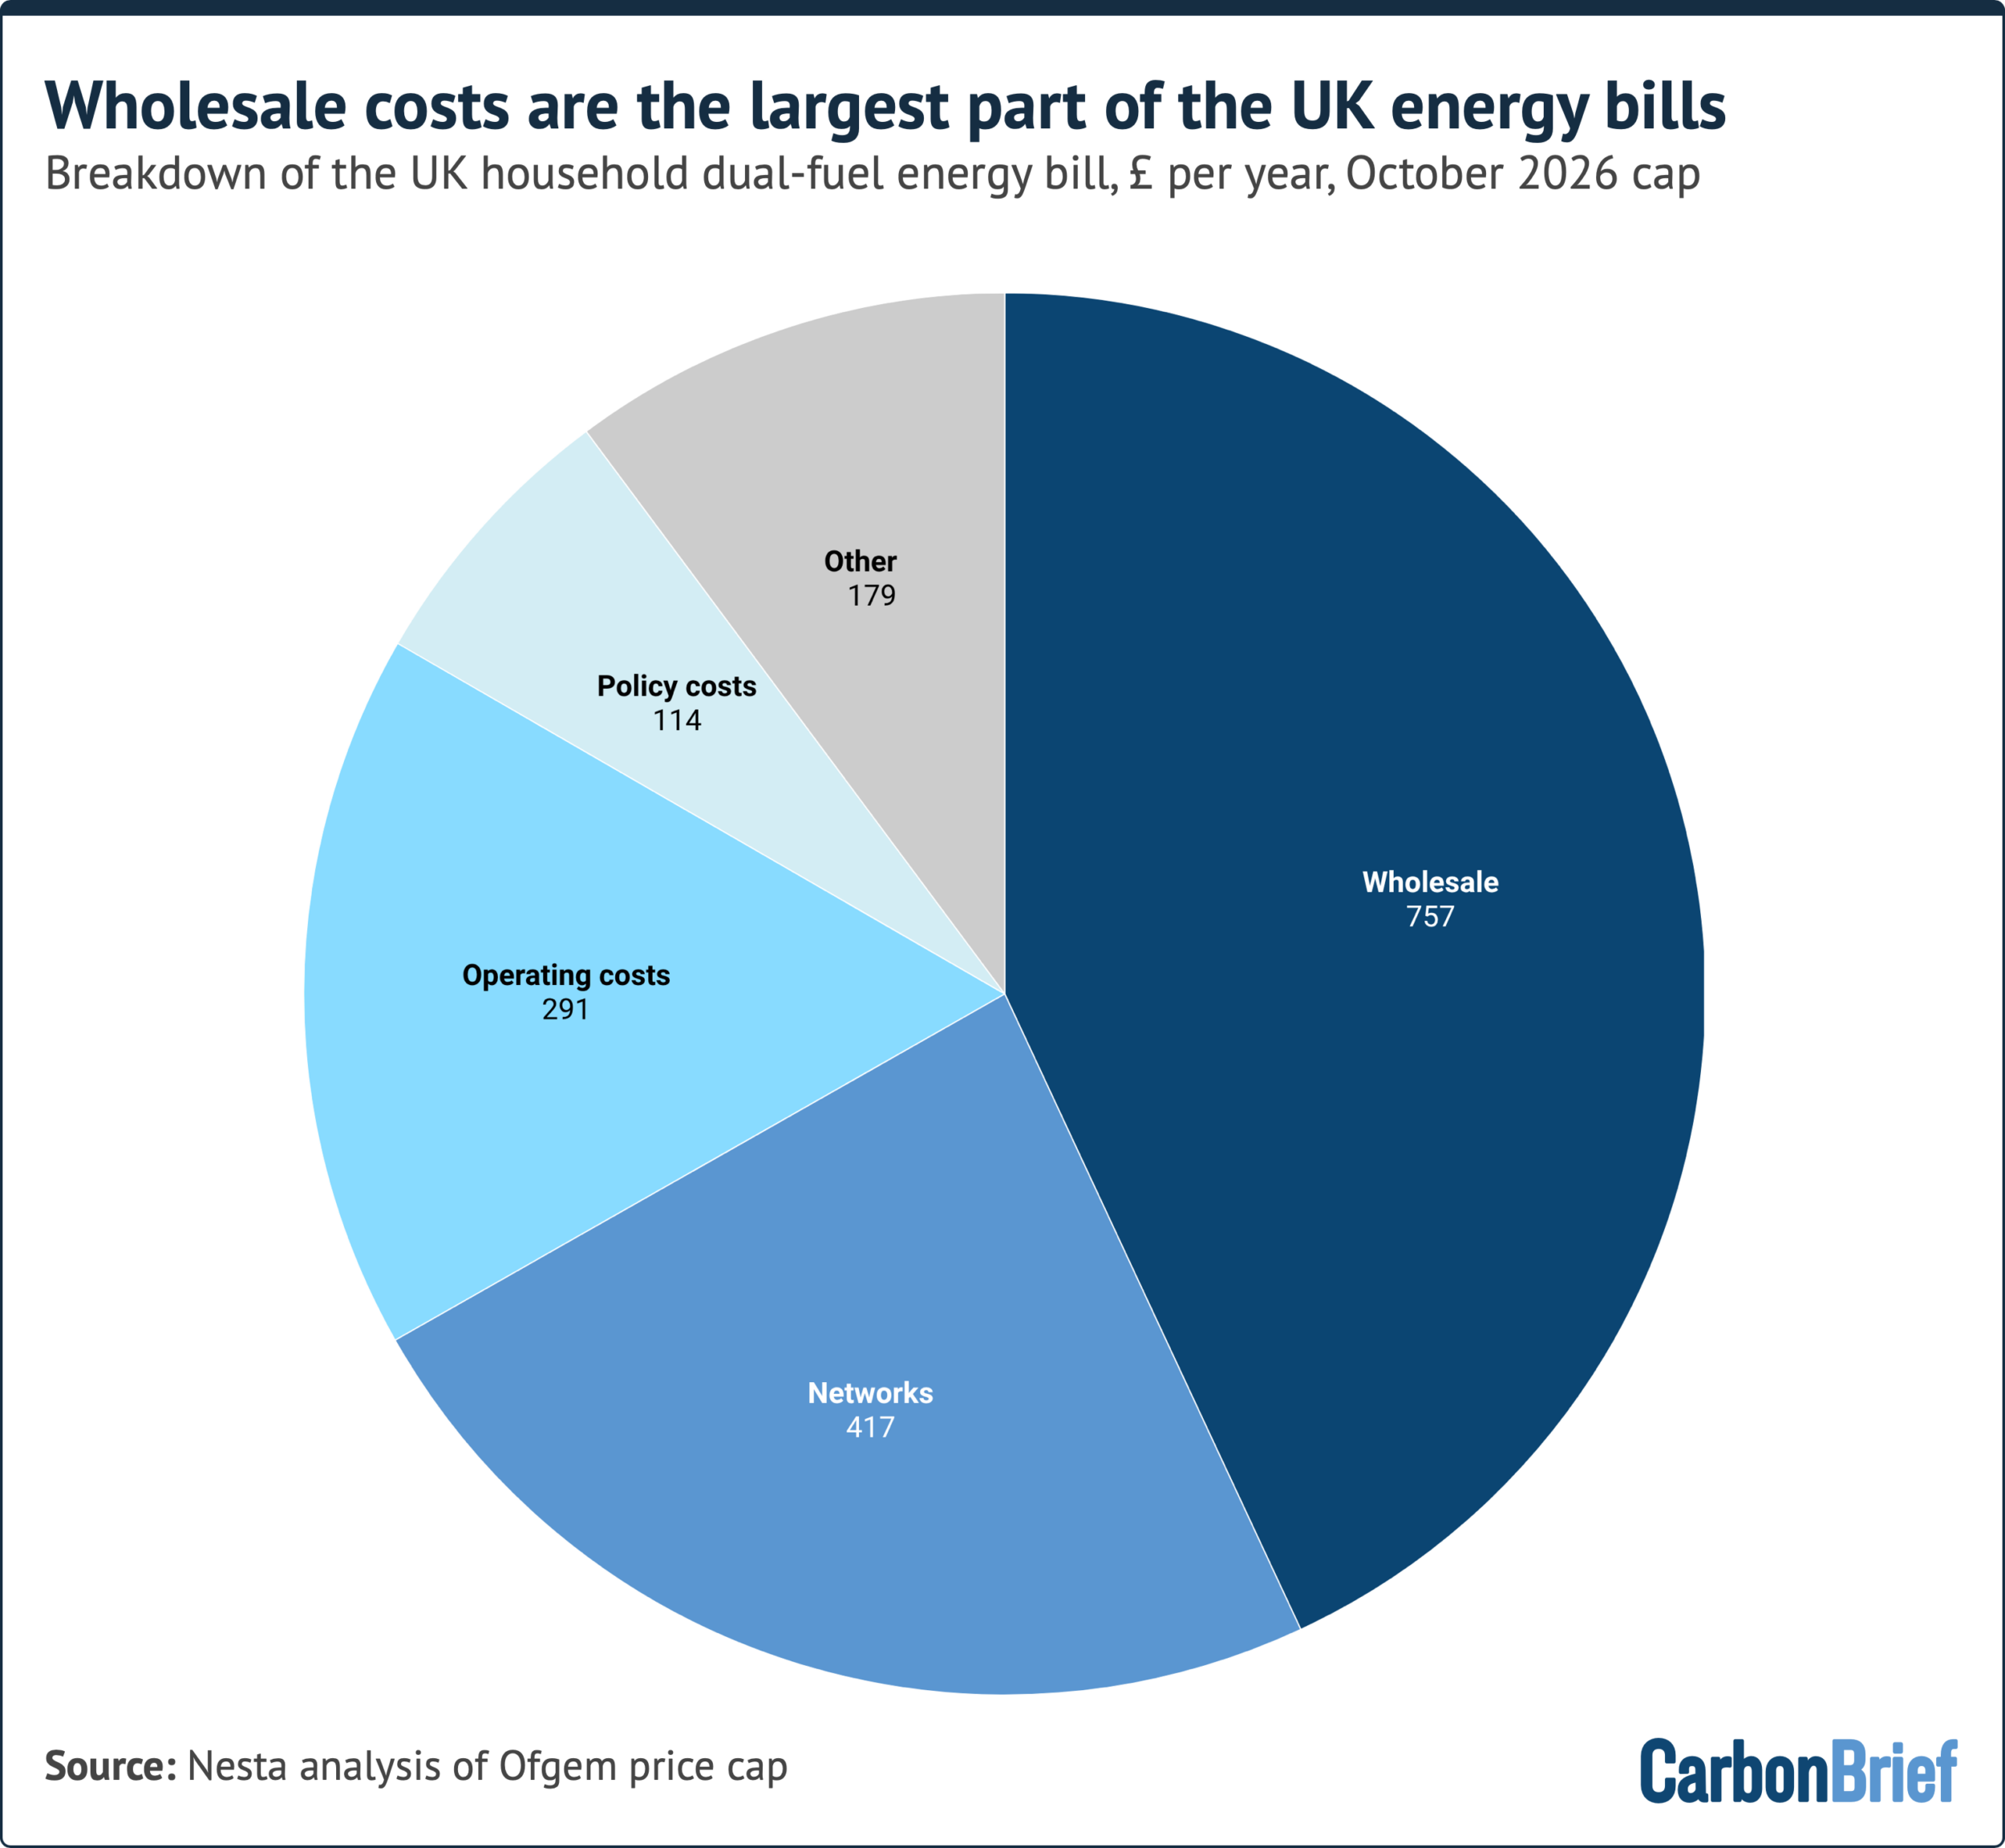
There has been increasing interest in the so-called "non-commodity costs" - those not related to wholesale energy - that now make up a significant portion of bills, as shown in the figure above.
Yet while these costs have been increasing - particularly those related to investing in energy networks - they are not the reason why energy bills have soared once again in recent months.
Indeed, Nesta analysis recently published by Carbon Brief shows that, contrary to widespread UK media and political narratives, a surge in wholesale costs driven by expensive gas is responsible for more than 80% of the rise in dual-fuel household energy bills since 2020, as shown below.
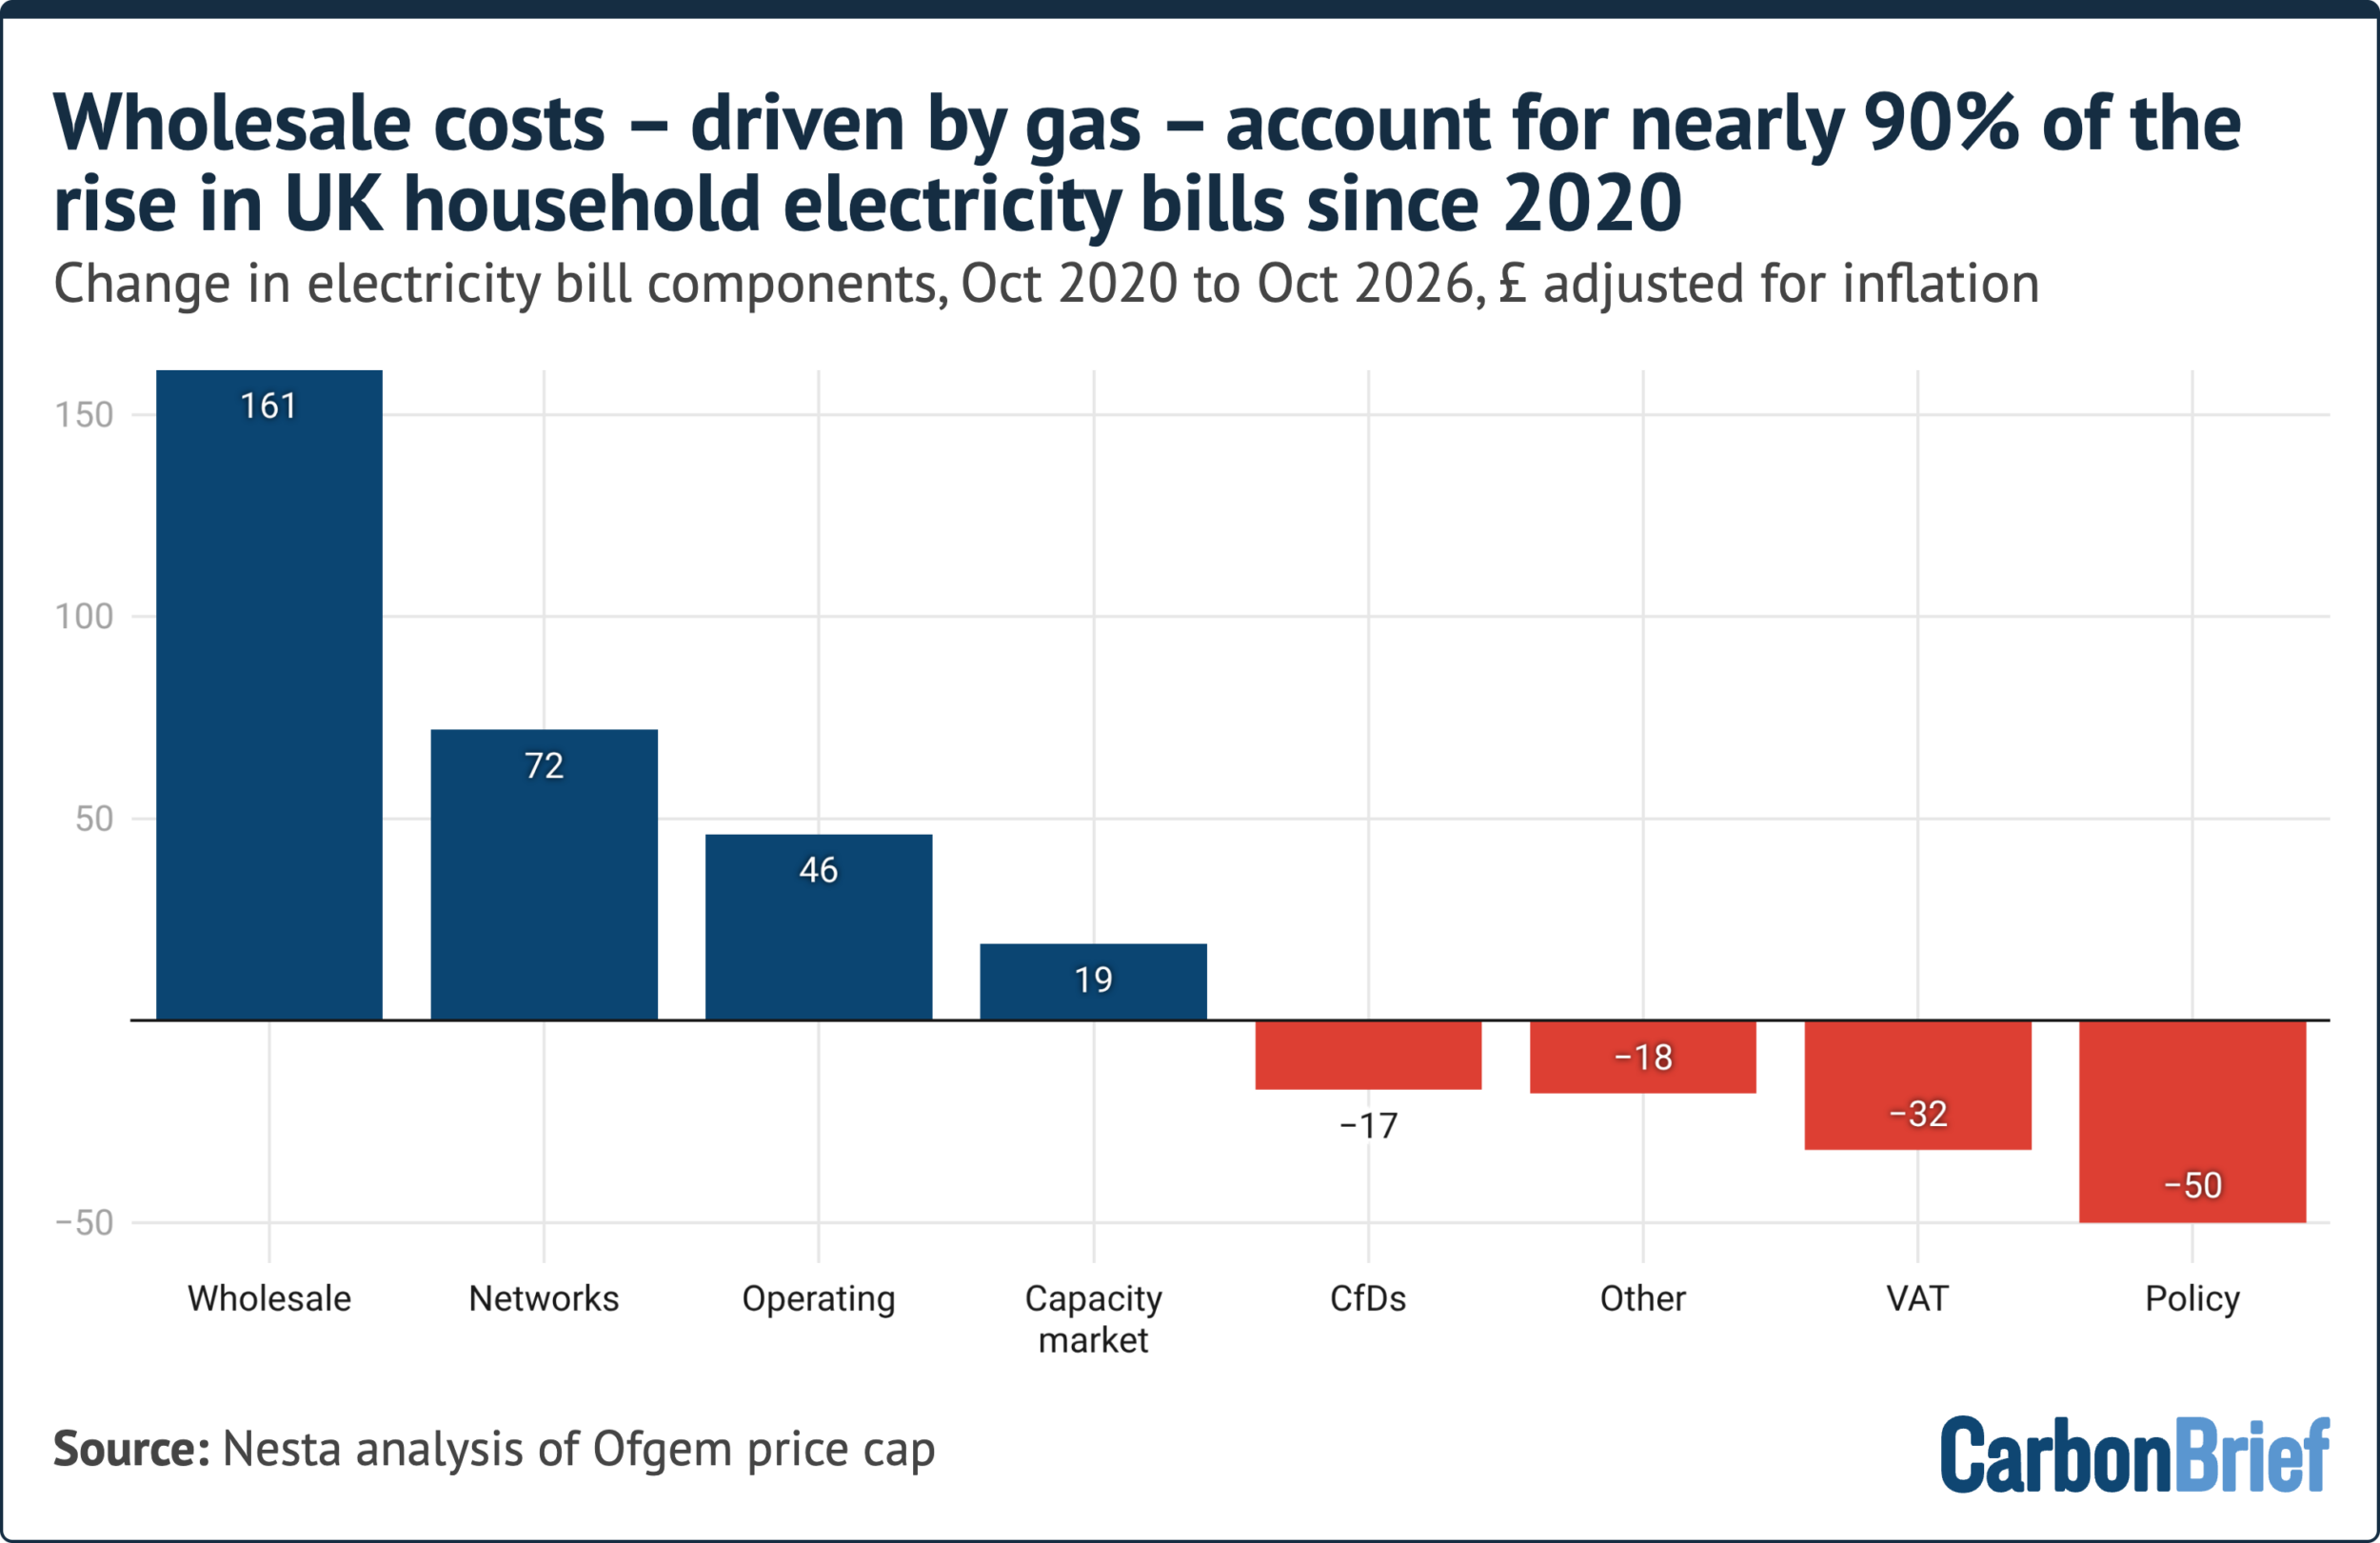
The second-largest driver of the rise in costs since 2020 is due to the cost of operating, maintaining and expanding gas and electricity networks, as shown in the figure above.
At the end of 2025, energy regulator Ofgem approved £29bn of upfront investment into the national gas and electricity grids, as well as the gas distribution network that connects to homes and businesses. This is part of a wider package of up to around £90bn of investment out to 2031.
As a result of these investment plans, network charges are expected to increase by around 50% between 2025 and 2030, from £222 a year to £330 for a typical dual-fuel household.
(This figure covers gas and electricity transmission and gas distribution, but not electricity distribution. A further package of increased investment in the electricity distribution network, for the period from 2028-2033, is due to be approved by Ofgem by the end of 2027.)
#gform_wrapper_7[data-form-index="0"].gform-theme,[data-parent-form="7_0"]{--gf-color-primary: #204ce5;--gf-color-primary-rgb: 32, 76, 229;--gf-color-primary-contrast: #fff;--gf-color-primary-contrast-rgb: 255, 255, 255;--gf-color-primary-darker: #001AB3;--gf-color-primary-lighter: #527EFF;--gf-color-secondary: #fff;--gf-color-secondary-rgb: 255, 255, 255;--gf-color-secondary-contrast: #112337;--gf-color-secondary-contrast-rgb: 17, 35, 55;--gf-color-secondary-darker: #F5F5F5;--gf-color-secondary-lighter: #FFFFFF;--gf-color-out-ctrl-light: rgba(17, 35, 55, 0.1);--gf-color-out-ctrl-light-rgb: 17, 35, 55;--gf-color-out-ctrl-light-darker: rgba(104, 110, 119, 0.35);--gf-color-out-ctrl-light-lighter: #F5F5F5;--gf-color-out-ctrl-dark: #585e6a;--gf-color-out-ctrl-dark-rgb: 88, 94, 106;--gf-color-out-ctrl-dark-darker: #112337;--gf-color-out-ctrl-dark-lighter: rgba(17, 35, 55, 0.65);--gf-color-in-ctrl: #fff;--gf-color-in-ctrl-rgb: 255, 255, 255;--gf-color-in-ctrl-contrast: #112337;--gf-color-in-ctrl-contrast-rgb: 17, 35, 55;--gf-color-in-ctrl-darker: #F5F5F5;--gf-color-in-ctrl-lighter: #FFFFFF;--gf-color-in-ctrl-primary: #204ce5;--gf-color-in-ctrl-primary-rgb: 32, 76, 229;--gf-color-in-ctrl-primary-contrast: #fff;--gf-color-in-ctrl-primary-contrast-rgb: 255, 255, 255;--gf-color-in-ctrl-primary-darker: #001AB3;--gf-color-in-ctrl-primary-lighter: #527EFF;--gf-color-in-ctrl-light: rgba(17, 35, 55, 0.1);--gf-color-in-ctrl-light-rgb: 17, 35, 55;--gf-color-in-ctrl-light-darker: rgba(104, 110, 119, 0.35);--gf-color-in-ctrl-light-lighter: #F5F5F5;--gf-color-in-ctrl-dark: #585e6a;--gf-color-in-ctrl-dark-rgb: 88, 94, 106;--gf-color-in-ctrl-dark-darker: #112337;--gf-color-in-ctrl-dark-lighter: rgba(17, 35, 55, 0.65);--gf-radius: 3px;--gf-font-size-secondary: 14px;--gf-font-size-tertiary: 13px;--gf-icon-ctrl-number: url("data:image/svg+xml,%3Csvg width='8' height='14' viewBox='0 0 8 14' fill='none' xmlns='http://www.w3.org/2000/svg'%3E%3Cpath fill-rule='evenodd' clip-rule='evenodd' d='M4 0C4.26522 5.96046e-08 4.51957 0.105357 4.70711 0.292893L7.70711 3.29289C8.09763 3.68342 8.09763 4.31658 7.70711 4.70711C7.31658 5.09763 6.68342 5.09763 6.29289 4.70711L4 2.41421L1.70711 4.70711C1.31658 5.09763 0.683417 5.09763 0.292893 4.70711C-0.0976311 4.31658 -0.097631 3.68342 0.292893 3.29289L3.29289 0.292893C3.48043 0.105357 3.73478 0 4 0ZM0.292893 9.29289C0.683417 8.90237 1.31658 8.90237 1.70711 9.29289L4 11.5858L6.29289 9.29289C6.68342 8.90237 7.31658 8.90237 7.70711 9.29289C8.09763 9.68342 8.09763 10.3166 7.70711 10.7071L4.70711 13.7071C4.31658 14.0976 3.68342 14.0976 3.29289 13.7071L0.292893 10.7071C-0.0976311 10.3166 -0.0976311 9.68342 0.292893 9.29289Z' fill='rgba(17, 35, 55, 0.65)'/%3E%3C/svg%3E");--gf-icon-ctrl-select: url("data:image/svg+xml,%3Csvg width='10' height='6' viewBox='0 0 10 6' fill='none' xmlns='http://www.w3.org/2000/svg'%3E%3Cpath fill-rule='evenodd' clip-rule='evenodd' d='M0.292893 0.292893C0.683417 -0.097631 1.31658 -0.097631 1.70711 0.292893L5 3.58579L8.29289 0.292893C8.68342 -0.0976311 9.31658 -0.0976311 9.70711 0.292893C10.0976 0.683417 10.0976 1.31658 9.70711 1.70711L5.70711 5.70711C5.31658 6.09763 4.68342 6.09763 4.29289 5.70711L0.292893 1.70711C-0.0976311 1.31658 -0.0976311 0.683418 0.292893 0.292893Z' fill='rgba(17, 35, 55, 0.65)'/%3E%3C/svg%3E");--gf-icon-ctrl-search: url("data:image/svg+xml,%3Csvg width='640' height='640' xmlns='http://www.w3.org/2000/svg'%3E%3Cpath d='M256 128c-70.692 0-128 57.308-128 128 0 70.691 57.308 128 128 128 70.691 0 128-57.309 128-128 0-70.692-57.309-128-128-128zM64 256c0-106.039 85.961-192 192-192s192 85.961 192 192c0 41.466-13.146 79.863-35.498 111.248l154.125 154.125c12.496 12.496 12.496 32.758 0 45.254s-32.758 12.496-45.254 0L367.248 412.502C335.862 434.854 297.467 448 256 448c-106.039 0-192-85.962-192-192z' fill='rgba(17, 35, 55, 0.65)'/%3E%3C/svg%3E");--gf-label-space-y-secondary: var(--gf-label-space-y-md-secondary);--gf-ctrl-border-color: #686e77;--gf-ctrl-size: var(--gf-ctrl-size-md);--gf-ctrl-label-color-primary: #112337;--gf-ctrl-label-color-secondary: #112337;--gf-ctrl-choice-size: var(--gf-ctrl-choice-size-md);--gf-ctrl-checkbox-check-size: var(--gf-ctrl-checkbox-check-size-md);--gf-ctrl-radio-check-size: var(--gf-ctrl-radio-check-size-md);--gf-ctrl-btn-font-size: var(--gf-ctrl-btn-font-size-md);--gf-ctrl-btn-padding-x: var(--gf-ctrl-btn-padding-x-md);--gf-ctrl-btn-size: var(--gf-ctrl-btn-size-md);--gf-ctrl-btn-border-color-secondary: #686e77;--gf-ctrl-file-btn-bg-color-hover: #EBEBEB;--gf-field-img-choice-size: var(--gf-field-img-choice-size-md);--gf-field-img-choice-card-space: var(--gf-field-img-choice-card-space-md);--gf-field-img-choice-check-ind-size: var(--gf-field-img-choice-check-ind-size-md);--gf-field-img-choice-check-ind-icon-size: var(--gf-field-img-choice-check-ind-icon-size-md);--gf-field-pg-steps-number-color: rgba(17, 35, 55, 0.8);} NameThis field is for validation purposes and should be left unchanged.Free weekly newsletter
.preheader p{ margin-top: 0; font-family: 'PT Sans', sans-serif; font-weight: var(--type--3--font-weight--bold); color: var(--button--color); font-size: var(--button--font-size, inherit); }
.newsletter-inline{
display: flex;
border: solid 1px #333333;
padding: 1em;
background: #ffffff;
}
.inline-email{
display:inline-block;
margin-right:1em;
margin-top:0 !important;
margin-bottom:0.5em;
}
#field_submit{
display:inline-block;
margin-top:0 !important;
}
.gform_wrapper .gfield+.gfield{
margin-top:0
}
Email
gform.initializeOnLoaded( function() {gformInitSpinner( 7, 'https://www.carbonbrief.org/wp-content/plugins/gravityforms/images/spinner.svg', false );jQuery('#gform_ajax_frame_7').on('load',function(){var contents = jQuery(this).contents().find('*').html();var is_postback = contents.indexOf('GF_AJAX_POSTBACK') >= 0;if(!is_postback){return;}var form_content = jQuery(this).contents().find('#gform_wrapper_7');var is_confirmation = jQuery(this).contents().find('#gform_confirmation_wrapper_7').length > 0;var is_redirect = contents.indexOf('gformRedirect(){') >= 0;var is_form = form_content.length > 0 && ! is_redirect && ! is_confirmation;var mt = parseInt(jQuery('html').css('margin-top'), 10) + parseInt(jQuery('body').css('margin-top'), 10) + 100;if(is_form){jQuery('#gform_wrapper_7').html(form_content.html());if(form_content.hasClass('gform_validation_error')){jQuery('#gform_wrapper_7').addClass('gform_validation_error');} else {jQuery('#gform_wrapper_7').removeClass('gform_validation_error');}setTimeout( function() { /* delay the scroll by 50 milliseconds to fix a bug in chrome */ jQuery(document).scrollTop(jQuery('#gform_wrapper_7').offset().top - mt); }, 50 );if(window['gformInitDatepicker']) {gformInitDatepicker();}if(window['gformInitPriceFields']) {gformInitPriceFields();}var current_page = jQuery('#gform_source_page_number_7').val();gformInitSpinner( 7, 'https://www.carbonbrief.org/wp-content/plugins/gravityforms/images/spinner.svg', false );jQuery(document).trigger('gform_page_loaded', [7, current_page]);window['gf_submitting_7'] = false;}else if(!is_redirect){var confirmation_content = jQuery(this).contents().find('.GF_AJAX_POSTBACK').html();if(!confirmation_content){confirmation_content = contents;}jQuery('#gform_wrapper_7').replaceWith(confirmation_content);jQuery(document).scrollTop(jQuery('#gf_7').offset().top - mt);jQuery(document).trigger('gform_confirmation_loaded', [7]);window['gf_submitting_7'] = false;wp.a11y.speak(jQuery('#gform_confirmation_message_7').text());}else{jQuery('#gform_7').append(contents);if(window['gformRedirect']) {gformRedirect();}}jQuery(document).trigger("gform_pre_post_render", [{ formId: "7", currentPage: "current_page", abort: function() { this.preventDefault(); } }]); if (event && event.defaultPrevented) { return; } const gformWrapperDiv = document.getElementById( "gform_wrapper_7" ); if ( gformWrapperDiv ) { const visibilitySpan = document.createElement( "span" ); visibilitySpan.id = "gform_visibility_test_7"; gformWrapperDiv.insertAdjacentElement( "afterend", visibilitySpan ); } const visibilityTestDiv = document.getElementById( "gform_visibility_test_7" ); let postRenderFired = false; function triggerPostRender() { if ( postRenderFired ) { return; } postRenderFired = true; gform.core.triggerPostRenderEvents( 7, current_page ); if ( visibilityTestDiv ) { visibilityTestDiv.parentNode.removeChild( visibilityTestDiv ); } } function debounce( func, wait, immediate ) { var timeout; return function() { var context = this, args = arguments; var later = function() { timeout = null; if ( !immediate ) func.apply( context, args ); }; var callNow = immediate && !timeout; clearTimeout( timeout ); timeout = setTimeout( later, wait ); if ( callNow ) func.apply( context, args ); }; } const debouncedTriggerPostRender = debounce( function() { triggerPostRender(); }, 200 ); if ( visibilityTestDiv && visibilityTestDiv.offsetParent === null ) { const observer = new MutationObserver( ( mutations ) => { mutations.forEach( ( mutation ) => { if ( mutation.type === 'attributes' && visibilityTestDiv.offsetParent !== null ) { debouncedTriggerPostRender(); observer.disconnect(); } }); }); observer.observe( document.body, { attributes: true, childList: false, subtree: true, attributeFilter: [ 'style', 'class' ], }); } else { triggerPostRender(); } } );} );
The increase in network costs is often attributed to the need to connect increasing levels of geographically dispersed renewable energy sources, particularly wind power.
However, a significant proportion of these increases relate to the need to update ageing infrastructure after decades of under-investment.
This package of investment represents a "once-in-a-generation renewal of our energy infrastructure", Ofgem head Tim Jarvis told a recent conference attended by Carbon Brief.
Ofgem says some three-fifths of the £108 per household per year rise in network charges to 2030 is due to "business-as-usual" costs such as ongoing maintenance of the gas and electricity networks. It says only £30 is due to investing in expanding the electricity transmission grid.
Similarly, according to the Energy Networks Association, up to 80% of the investment in electricity grids is required to maintain existing assets, with the remainder going towards expansion.
Another point of contention is "constraint costs", where windfarms are switched off if the network lacks the capacity to transmit their power - and gas plants are switched on to meet demand.
These costs sit within network balancing charges and - despite rising steeply in recent years, partly due to high gas prices - these still make up just £35, or 4% of typical annual electricity bills.
Today, rising constraint costs are partly a reflection of the decision in the 2010s to postpone network investments under a policy known as "connect and manage". Ofgem says the investments it has now approved in the electricity grid would help limit constraints in the future.
Trade association RenewableUK's head of policy Steven Agnew points to a recent review by the National Audit Office and says investment in the grid is "critical to avoid large rises in consumers' bills as more of the country's electricity is generated from clean sources". He adds:
"The current crunch is the result of inaction by successive previous governments to tackle this issue. Consumers are losing out on some of the benefits because low-cost wind has to be turned down and expensive gas turned up elsewhere."
Projections from the National Energy System Operator (Neso) illustrate how constraint costs depend on the relative pace of expansion in new generating capacity and the electricity network.
It says balancing costs could rise from £2bn to £8bn by 2030, if the grid faces delays. However, its central projection is £3-4bn, with a range of options available to limit this increase.
Finally, following years of elevated energy bills, the cost of "bad debt" has increased. This is where unpaid bills are recovered by energy companies through a charge on all households.
These charges add around £60 to typical bills, according to Carbon Brief analysis of Ofgem data. This is an increase of around £40 since 2020 - more than half of the rise in "operating costs". Trade association Energy UK says rising debt could add another £10-15 to bills by next year.
What has been done to limit bills so far?The Labour government was elected in 2024 on a manifesto that pledged to cut bills by £300 per year by 2030, relative to levels in late 2023.
The government has taken a number of steps in this direction.
At the 2025 budget, it closed the "energy company obligation" (ECO) efficiency scheme and moved 75% of the "renewables obligation" support scheme for legacy renewables into general taxation.
Collectively, these two changes were expected to save a typical household £134 per year, or £154 when including households that use electric heating. (These savings only apply to households.)
Many groups, from industry to politicians, had long called for policy costs to be taken off electricity bills in an effort to bring down prices, but this had previously been resisted by the Treasury.
In addition, new prime minister Andy Burnham announced in July that his government would remove VAT from electricity bills for six months from 1 October, cutting bills by around £45.
Yet despite these efforts, bills have continued to increase.
Speaking to Carbon Brief, Dr Richard Carmichael, a researcher at the UK Energy Research Centre (UKERC) and research fellow at Imperial College London, says the impact of reducing policy costs and VAT has been "masked" by rising wholesale energy prices.
As a result, there are calls for the government to go even further in its efforts to reduce policy costs - or to take more radical steps to cut bills. (See: What are the options to bring down bills?)
One factor that is less well-appreciated is the impact that clean-power sources have already had on energy bills. Commentators tend to focus narrowly on the cost of support schemes for these projects, without considering the impact they have on the total cost of running the energy system.
Nesta research suggests that electricity bills are rising "much more slowly" than gas this year, despite the impact of the Hormuz crisis, due to the expansion of clean power. It says this is an early sign of electricity prices starting to "decouple" from gas prices.
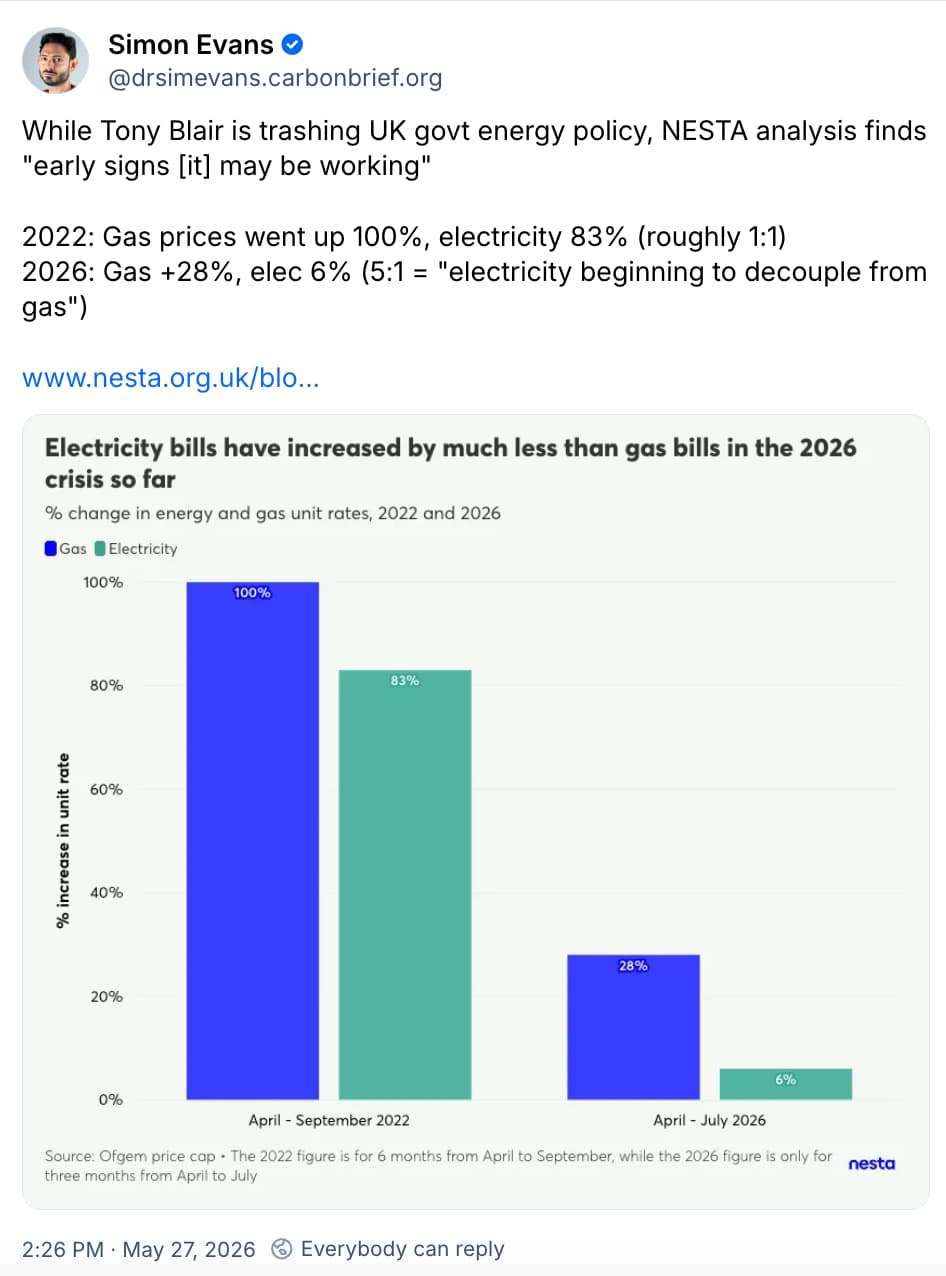
In April, the government announced reforms that it hopes will help "break [the] link between gas and electricity prices, but analysts told Carbon Brief the impact was likely to be "modest".
Nevertheless, the link between the two will continue to weaken as more wind and solar gets built, including projects supported by a record "contracts for difference" (CfD) auction earlier this year.
Since the start of the Iran war, the UK has avoided the need to import gas worth around £5.9bn as a result of record wind and solar output, according to previous Carbon Brief analysis.
RenewableUK's Agnew tells Carbon Brief: "Put simply, every wind turbine we build is gas we don't need to buy."
In addition to directly displacing gas, the windfarms on the system cut wholesale power prices by around a third in 2025, according to the Energy and Climate Intelligence Unit (ECIU).
This is due to the "merit-order effect", whereby windfarms push the most expensive gas plants off the system, reducing the average wholesale power price.
According to separate research published by University College London, UK wind energy cut consumer costs by a total of £104bn over 2010-2023, net of subsidy costs, through a combination of the merit-order effect and reduced gas demand, which lowered gas prices.
What options are there for bringing down bills?With household and industrial prices remaining elevated for more than five years, countless ideas have been presented for bringing down the cost of energy.
These span from immediate but more modest tweaks that could have a rapid impact, through to longer-term changes in the energy system, the design of energy markets or retail tariffs.
Moreover, amid a collapse in the UK consensus, some politicians want climate goals to be abandoned in the name of cheaper energy. (See: Is there a 'cheap power' alternative if the UK slows down?)
Ahead of the budget on 28 October, the most widely shared request is for the chancellor to take more policy costs off electricity bills, either for households only, or for all energy users.
A September letter to the government from more than 120 trade bodies, businesses and charities calls for "hidden taxes" to be taken off energy bills for both businesses and households.
.cb-tweet img{ border: solid 1.25px #333333; border-radius: 5px; } @media (max-width:650px){ .cb-tweet{ width:100%; } }
It argues that a series of levies should be paid out of general taxation, in addition to the existing decision to take 75% of renewables obligation costs off household electricity bills.
This would include a levy supporting the Sizewell C new nuclear plant, the cost of the warm home discount scheme for fuel-poor households and feed-in tariffs for small-scale legacy renewables.
The group says that removing these additional policy costs from bills would "bring the total average domestic energy bill reduction achieved by this government to as much as £250 a year".
It adds that this would bring down inflation, boost manufacturing and incentivise investment in the electrification of the economy, helping to "fully realise [the UK's] economic potential".
Speaking to Carbon Brief, energy consultant Kate Mulvany says bringing policy costs and bad debt into general taxation is "in all likelihood the fastest route" to reducing bills.
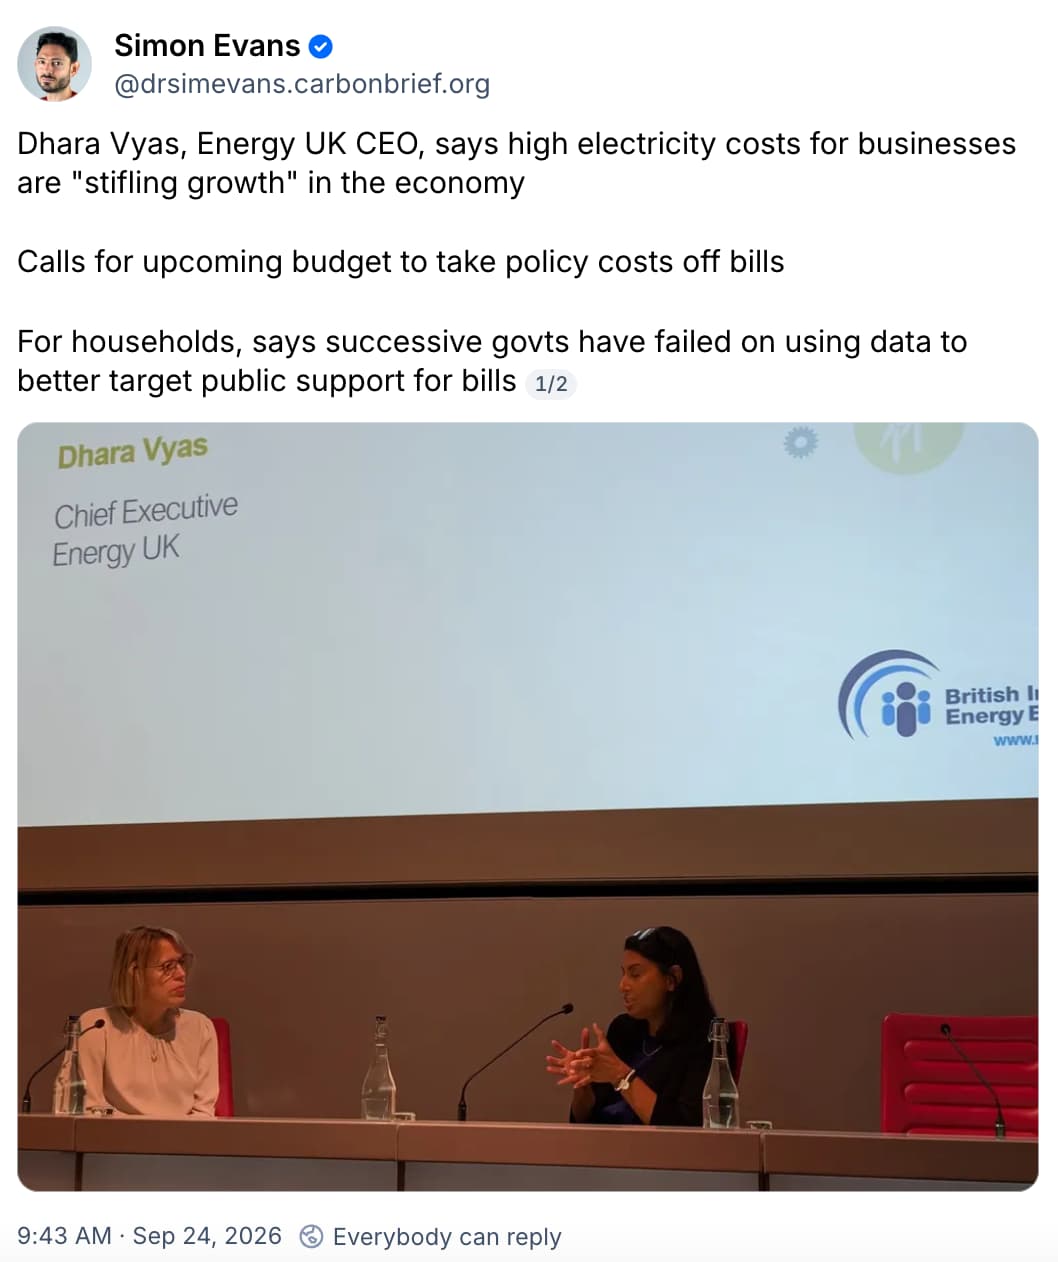
The main barrier to removing further policy and debt costs from bills is that the money would have to come from somewhere else - most likely the Treasury, which has resisted this in the past.
The decision to take 75% of the renewables obligation off household bills is seen as a breakthrough, with Energy UK head Dhara Vyas saying the Treasury should go a "step further".
Alternatively, a report from parliament's Energy Security and Net Zero Committee calls for policy costs to be moved from electricity onto gas bills.
This would help "rebalance" the cost of electricity relative to gas, encouraging consumers to switch to more efficient electric technologies, such as heat pumps and electric cars.
This is because it would reduce the "spark gap", the ratio between electricity and gas prices. This ratio stood at 4.3 in the UK as of April 2026, although it has dropped to 3.3 under the latest price cap and could fall again to 3.0 in January 2027, according to Carbon Brief analysis.
Further options to bring down costs for consumers have been suggested by groups including Nesta, the "electricity bills taskforce" and many others.
Ideas include the government paying off household energy debt, instead of recovering it through bills, a permanent removal of VAT on electricity prices and boosting electricity system "flexibility" so as to maximise the use of existing network assets.
Carmichael tells Carbon Brief:
"Flexibility is a fairly obvious one that…would deliver bill reductions for people who can participate in flexibility, but it would also reduce system costs for everyone."
Ashutosh Padelkar, research lead at Aurora, agrees that there is "more work to be done on improving network efficiency". In addition to boosting flexibility, he points to innovations such as "dynamic line ratings", where cables can be "overloaded a bit for a small amount of time".
With bills set to leap by around a quarter at the start of 2027, there have also been calls for specific measures to offer households relief at the budget.
Many argue that this support should be targeted to limit costs, for example through extending the "warm homes discount". However, Mulvany warns that this could increase costs for other households if it is paid for via energy bills, as is currently the case for the warm homes discount.
Another option is to introduce a "social tariff" for fuel-poor households. Dr Carmichael notes that while this has some positives, it also has "potential for a sort of a cliff edge where people are just missing out on it". This can make them challenging to put together in an equitable way.
Meanwhile, the New Economics Foundation thinktank - where energy secretary Miatta Fahnbulleh used to work - suggests a "rising block tariff", where consumers pay lower rates for a set amount of "essential" energy use. However, there are fears this could discourage electrification.
Ahead of the budget, Burnham has asked ministers to look at developing a plan to remove standing charges from gas bills. The idea was put forward by Nesta, which says it would save typical households £27 per year, while helping encourage the shift to heat pumps and EVs.
Finally, separate proposals from thinktank Common Wealth and consultancy Stonehaven with Greenpeace, call for more radical changes that would see gas-fired power stations taken into a strategic reserve, in order to more completely break the link between gas and power prices.
Is there a 'cheap power' alternative if the UK slows down?Some groups argue that the UK needs a fundamental shift in its energy strategy in order to tackle high bills. Such calls are often based on the idea that the government is "rushing" to meet its target for clean power by 2030 - and that slowing down would cut costs.
For example, a September 2026 report from the Institute for Fiscal Studies (IFS) states that "continuing to push for rapid decarbonisation does risk increasing costs".
Its argument rests on NESO modelling, published in 2024, which suggests it could be slightly cheaper to rely on more gas in 2030 than planned under the clean-power 2030 target.
Peter Levell, IFS deputy research director, tells Carbon Brief that gas prices have "risen significantly" since the NESO modelling was published, which "other things equal" would make it relatively cheaper to push for more renewables instead of relying on more gas power.
However, he adds that capital costs have also risen, arguing that this makes renewables relatively more expensive. (The cost of gas-fired power plants has risen even more steeply.) Levell adds that it is unclear how long the current disruption causing high gas prices will last.
Another prominent - and repeated - voice for slowing down the government's push for clean power has come from the Tony Blair Institute (TBI).
In a February 2026 report, for example, the TBI argues that the government should set an objective of "cheaper power by 2030" instead of "clean power 2030". It says this could be done "while maintaining a clear decarbonisation trajectory".
In earlier versions of this argument, the TBI called for a slower expansion of renewables, in favour of greater reliance on nuclear power and carbon-capture and storage.
However, perhaps implicitly acknowledging that these are not cheap technologies, its latest report focuses more on calls for flexibility, optimised grid expansion and a push for electrification.
Perhaps the strongest push to abandon the government's current approach has come from the opposition Conservative party, which now lobbies hard against clean power 2030, in addition to calling for the UK to scrap all of its climate targets and the legislation that underpins them.
The party backed a report by thinktank Onward, which claimed that the UK could save "over £320bn" with a push for "cheap power" instead of "clean power". However, a Carbon Brief factcheck found it relied on a series of questionable assumptions.
Ultimately, the report built its conclusions in from the start by assuming that gas and nuclear power would be cheap. As Tom Glover, head of energy firm RWE UK, put it at the time:
"There's a difference between a useful scenario and a plan you'd build a system around. This report is the former presented as the latter. If you accept its assumptions, the results follow logically. The problem is the assumptions…built on a stack of optimistic inputs."
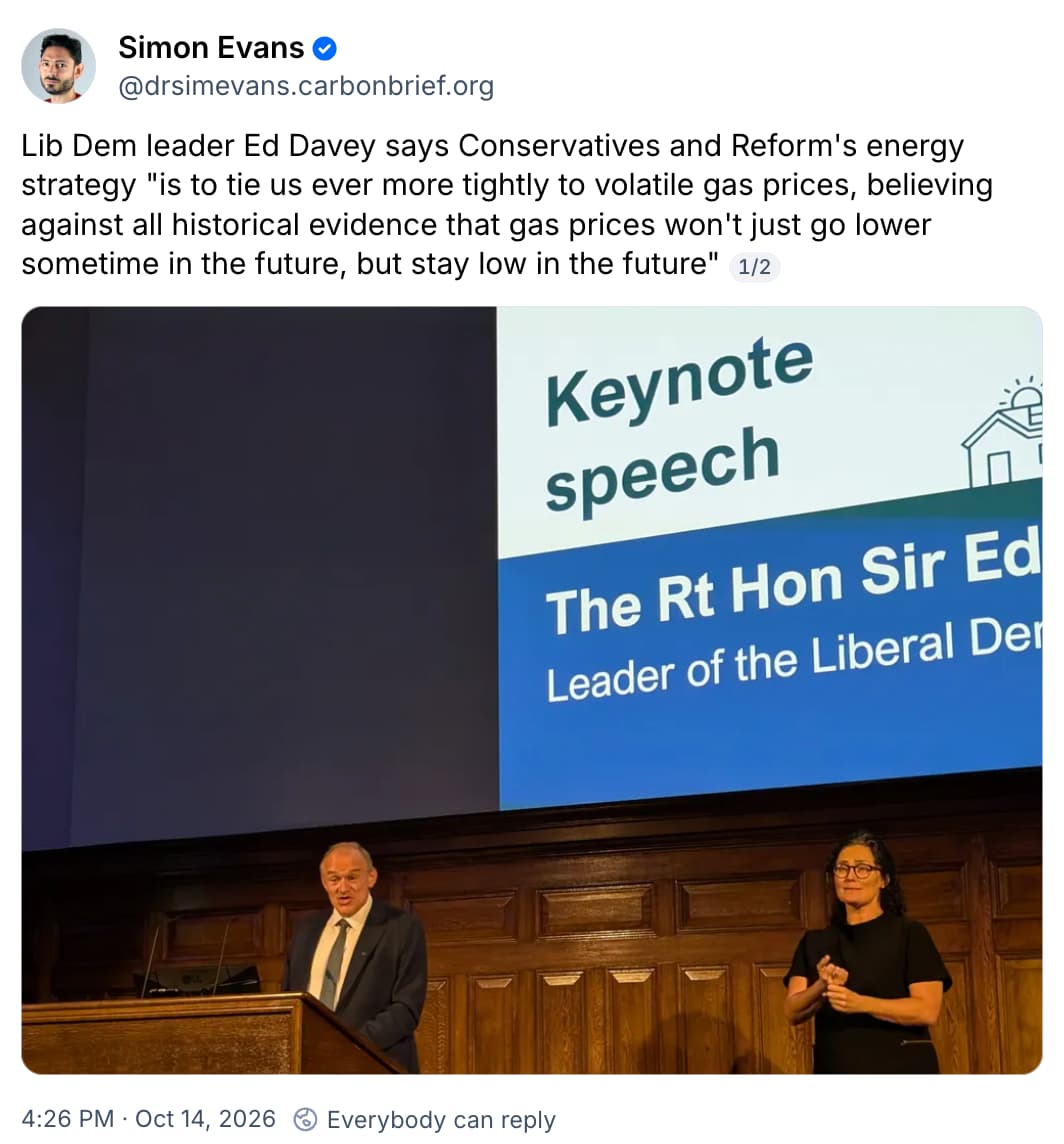
Similarly, Johnny Gowdy, a director at thinktank Regen, argues in a paper responding to the Onward report that its gas-price assumptions are "very optimistic - and potentially reckless".
Following the start of the Iran war, UK wholesale gas prices - which were already roughly three-times higher than before the Ukraine crisis - have more than doubled again.
According to RenewableUK, the UK is currently experiencing its ninth gas-price "spike" of the past decade. Mulvany tells Carbon Brief that such spikes are "normal". She adds:
"Wars are fought over energy and resources - and this is the way things have always been…[T]his isn't a blip. If you look historically, this is normal."
(The total cost to the UK economy of higher energy prices in the wake of Russia's invasion of Ukraine amounts to £183bn over four years, according to the ECIU.)
NESO notes that under pathways with a larger role for gas plants, the nation's energy system would remain "more exposed to volatile international gas prices".
As such, the UK's transition is about finding the right balance between the up-front cost of investment in clean-energy alternatives and the ongoing risk of exposure to volatile gas prices.
The IFS also notes that there are additional positives from moving away from fossil fuels, including improved local air quality, less price volatility and potentially greater security of energy supply.
Citing Carbon Brief analysis published in 2024, RenewableUK's Agnew argues that the government should learn from past "mistakes".
He points to the then-Conservative government decision from 2015 to "cut the green crap", which ultimately added £22bn to bills by leaving the UK "more exposed to volatile fossil-fuel prices".
UKERC's Carmichael echoes these points, telling Carbon Brief:
"If we're not transitioning to clean power, which for the UK would mean more independence and more energy sovereignty, I don't think there is an alternative…[and] if we don't do it, then we're still going to be vulnerable to volatility and fossil-fuel prices."
Finally, many of the arguments against the clean power 2030 target are based on the idea that it will be extremely difficult to meet and that closing the gap would be costly.
Indeed, recent analysis by consultancy LCP Delta suggests that by 2030, the UK will only reach 83% clean power, with the 95% target unlikely to be hit until 2035.
Yet this reality is implicitly acknowledged by the government, which has said that it will not contract for more clean power towards the 2030 target unless it delivers lower bills.
Speaking at the Energy UK conference in October, Fahnbulleh said:
"We all know that one of the reasons we are seeing rising prices is because we are uniquely exposed to global fossil-fuel markets…There will be people that will say you should slow down…But I believe that we must seize the opportunity of this moment."
Can electrification of homes and businesses help cut bills?While there is political disagreement over the best mix of power supplies, there is far greater agreement on the need to expand the use electric technologies such as EVs and heat pumps.
For example, while the Conservative party opposes the government's clean power plan, it argues that the UK needs to electrify its economy to ensure both "prosperity and a better environment".
At the Energy UK conference in October, delegates listed "electrification" and "affordability" as the top-two energy related priorities for the government.
There is significant overlap between these two goals.
At present, most households pay separate bills for heating, power and transport. This means they are paying to run three separate energy systems for gas, electricity and petrol.
If the UK largely electrifies its economy, households will instead rely on a single system that heats and powers their homes, as well as fuelling their cars. By boosting consumption, electrification also spreads the fixed costs of upgrading the network across a larger base of demand.
Padelkar tells Carbon Brief that there "isn't enough electrification in the system" at the moment:
"A significant amount of heating demand is gas-fired…[I]f that demand were to sit on the electricity side instead, it would allow for costs to be shared more fairly across a greater base of consumers."
According to energy firm SSE, the shift from three "parallel" energy systems to a single one based on electricity would reduce consumer costs over time, as shown in the figure below.
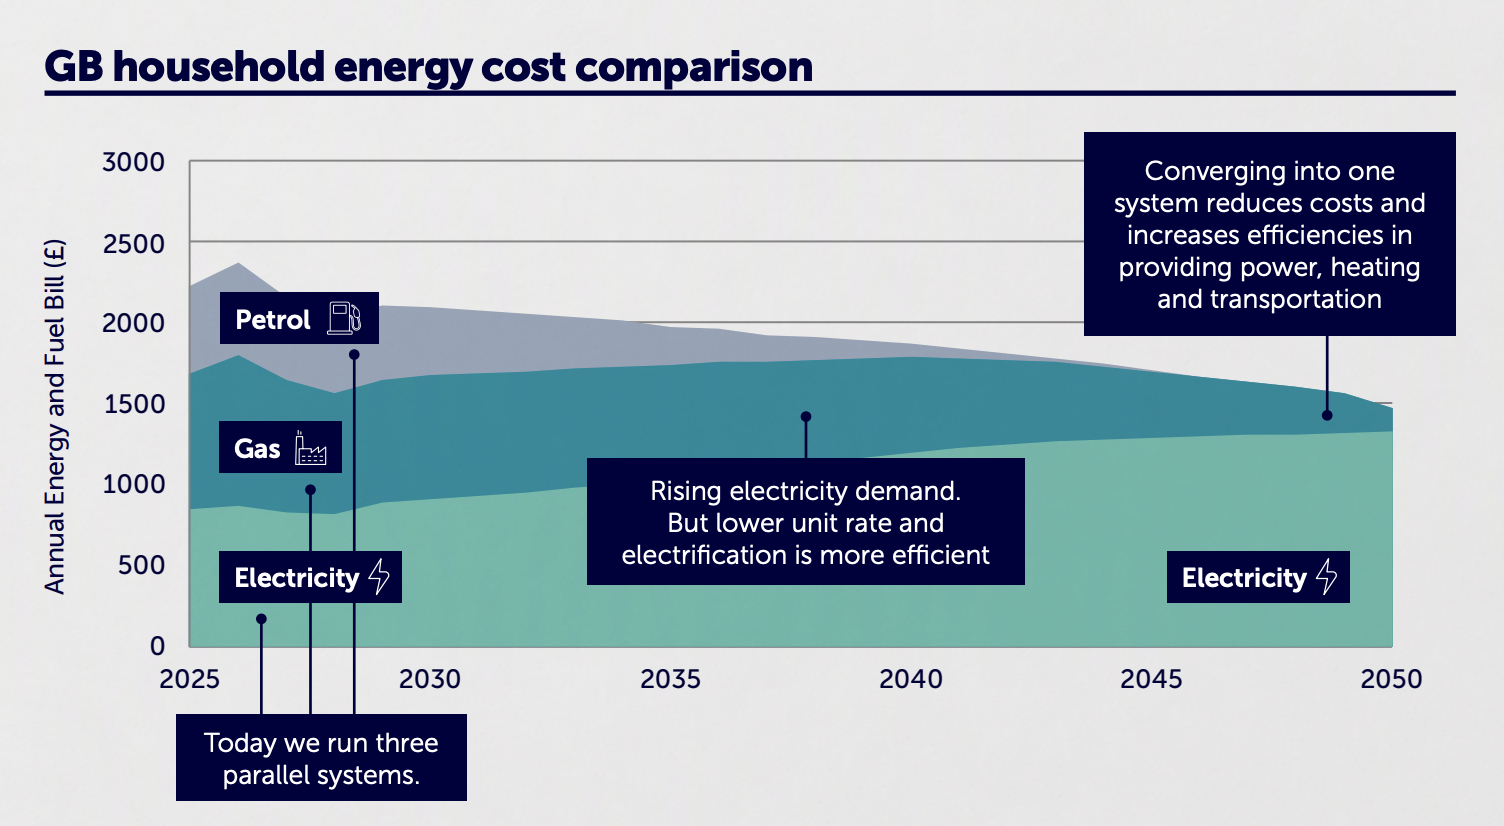 Credit: SSE
In this context, the usual focus on "dual-fuel" household gas and electricity bills, in isolation, misses the potential for savings due to consolidating not only heat and power, but also car use.
Indeed, electric cars are currently up to nine times cheaper to run than petrol cars in the UK, according to Carbon Brief analysis.
The savings from electrification are partly a result of the far greater efficiency of EVs and heat pumps, relative to combustion cars and gas boilers. Reduced fossil-fuel imports also play a role.
Very similar arguments have been put forward by the UK government's advisory Climate Change Committee (CCC), the International Energy Agency and others.
A recent CCC report, for example, said that faster electrification "would cut UK household bills".
It outlined how electrification would not only reduce the cost of the UK energy system in the future, but is already able to cut household costs today, as shown in the figure below. Crucially, its analysis included the higher upfront costs of investing in electric technologies, such as heat pumps.
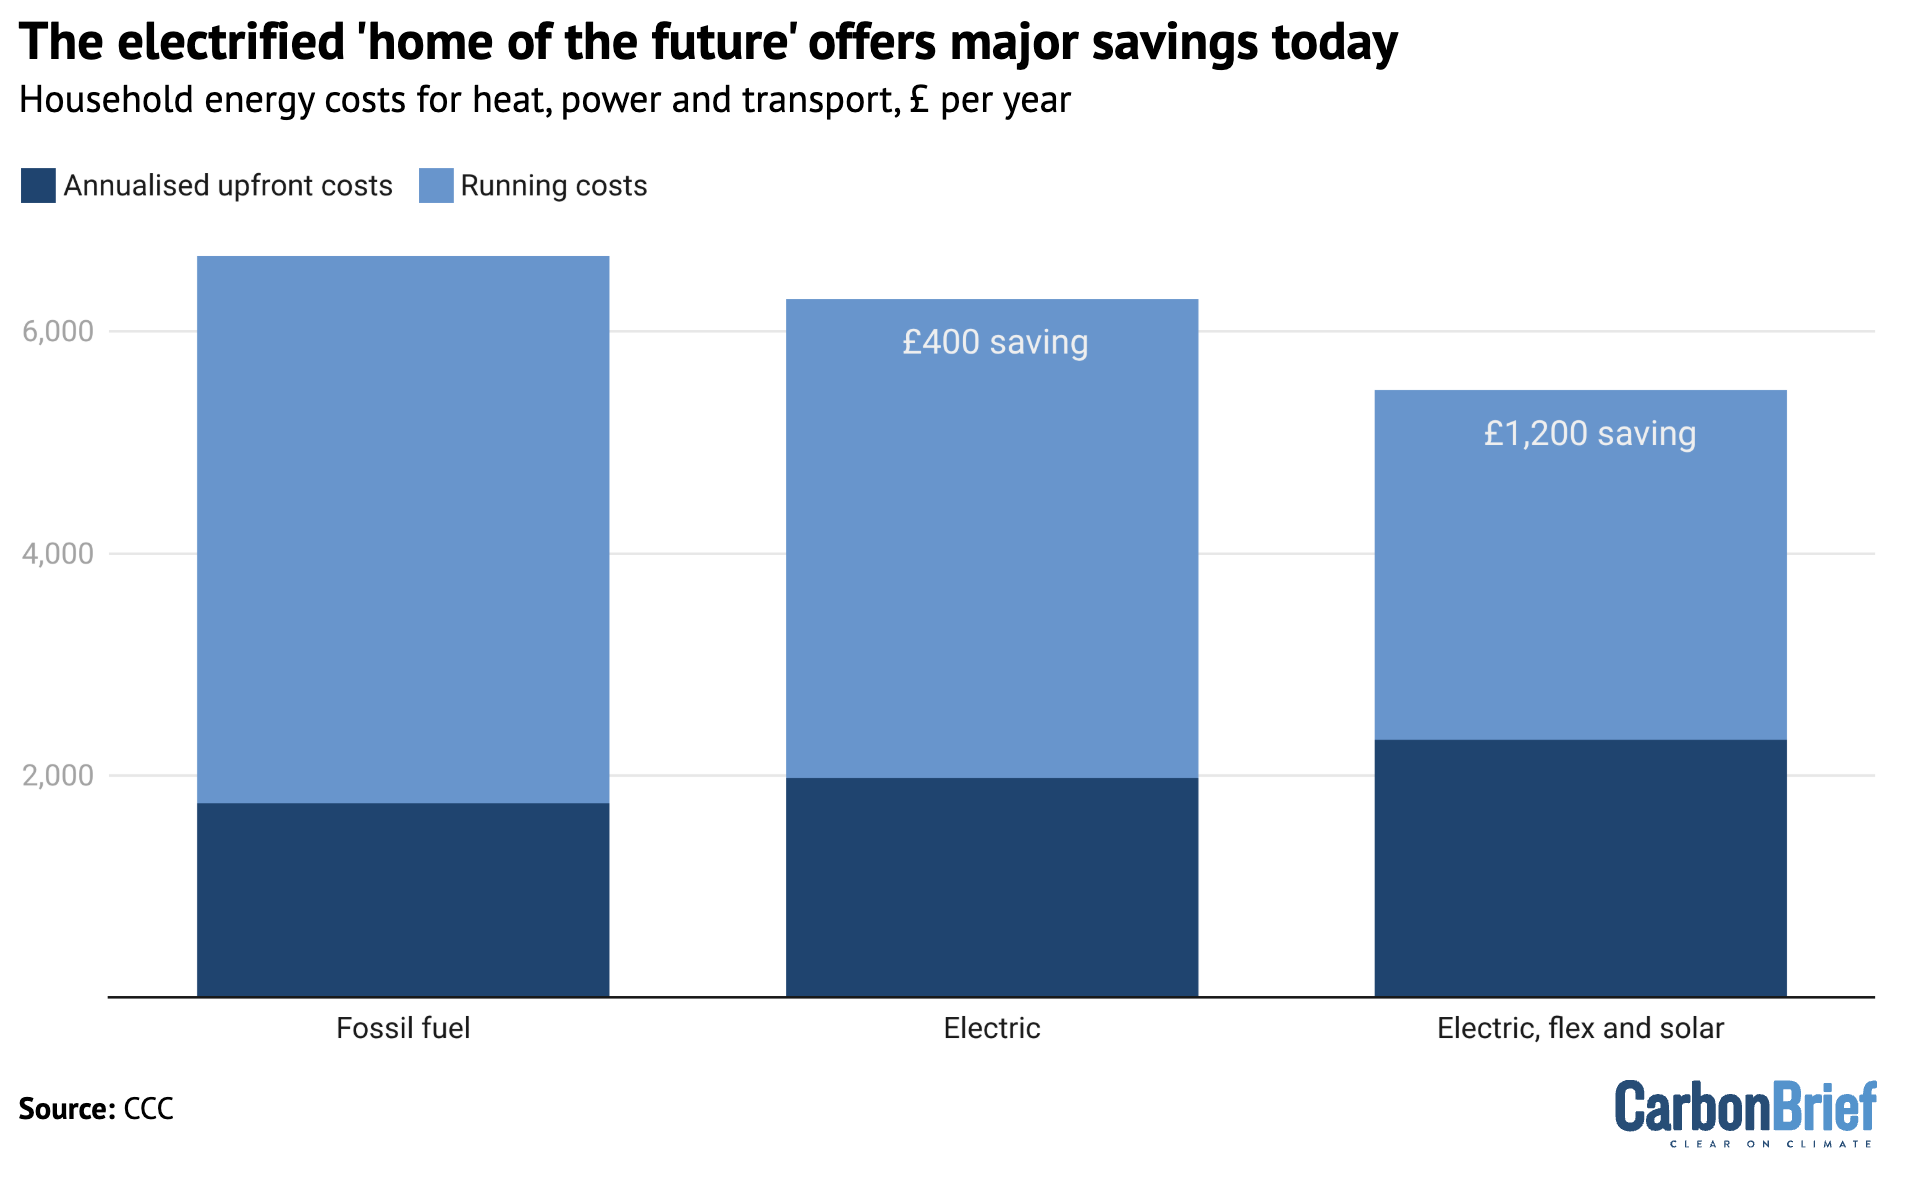 Household energy costs for heat, power and transport, £ per year. The upfront costs of purchasing cars, heating systems, chargers and solar panels are annualised. Source: CCC progress report 2026.
The government also supports this argument, having set out a £13bn "wa
- Surface mass balance
- Total mass balance
- Surface melt
- Snowfall
- Iceberg calving
- The impact of global weather
- Three decades of decline
- Greenland in the global sea level picture
Greenland has now marked the 30th consecutive year where it lost more ice than it gained.
This guest post is by:
Dr Martin Stendel, climate scientist at the Danish Meteorological Institute (DMI), part of the Polar Portal
Prof Ruth Mottram, climate scientist at DMI and honorary professor at Aarhus University
Over the 12-month period to August 2026, the world's second-largest ice sheet lost around 135bn tonnes of ice.
This major ice loss came as the region experienced a relatively cool start to summer and less surface melt than in previous years.
In other words, it was not an "extreme" year for weather in Greenland - and, yet, the ice sheet ended firmly in the red.
Three decades of continuous ice loss in Greenland is significant, given that scientists typically need 30 years of data to separate the "fingerprint" of human-caused climate change from natural variations in the climate.
In Greenland, the direction of travel has been the same - downward - every single year for 30 years.
These latest figures come as a new report highlights that ice melting processes seen for decades in Greenland are increasingly being replicated in Antarctica.
Greenland, therefore, is not only the largest present-day source of ice-driven sea level rise - but offers a preview of what is in store for the world's largest ice sheet.
(For our previous analyses of Greenland's ice cover, see coverage in 2025, 2024, 2023, 2022, 2021, 2020, 2019, 2018, 2017, 2016 and 2015.)
Surface mass balanceOne way that scientists track the health of the Greenland ice sheet is by tracking changes to its "surface mass balance".
This is the difference between ice gains from snowfall and losses from melt at the surface of Greenland's ice sheet.
Greenland's annual ice cycle runs from 1 September through to the end of August. The surface mass balance at the end of this period has, to date, always been positive, because the surface accumulates more snow than it loses from melting ice.
The ice sheet typically gains mass during the colder months of autumn, winter and spring. Then, as temperatures increase from around mid-June, the ice sheet begins to lose more ice through surface melt than it gains from snow.
(Greenland also loses ice when icebergs break off - or "calve" - into the sea, as well when the front of glaciers melt when they meet warm sea water. These losses are included in the "total mass balance" - see below.)
Greenland ended 2025-26 with an overall surface mass balance of 519bn tonnes.
This is the sixth highest in a dataset stretching back 46 years and about 178bn tonnes above the 1981-2010 average of roughly 350bn tonnes.
The map below shows the difference between the surface mass balance in 2025-26 and the 1981-2010 average, where blue shows ice gain and red shows ice loss.
 Map showing the difference between the annual SMB in 2025-26 and the 1981-2010 period in mm of ice melt. Blue shows ice gain compared to average and red shows ice loss. Credit: Polar Portal.
The blue lines in the charts below show the surface mass balance throughout 2025-26 for individual days (top) and cumulatively throughout the year (bottom). They highlight how Greenland gained ice between September 2025 and May 2026, before starting to lose ice from June onwards.
 Daily (upper) and cumulative (lower) surface mass balance (SMB) of the Greenland ice sheet, in billions of tonnes. Blue lines show the 2025-26 surface mass balance year; grey lines and shading show the 1981-2010 average and variability. Red line shows the record-low year of 2011-12. Credit: Polar Portal.
Total mass balance
Another way scientists measure the health of the Greenland ice sheet is by looking at its "total mass balance".
This calculation accounts for ice loss at the surface, as well as the calving of icebergs and the melting of glacier fronts where they meet warm seawater. The latter two components are known as the "marine mass balance".
It also accounts for a small amount of ice melt at the underside of the ice sheet. This is known as the "basal mass balance".
In recent decades, Greenland's total mass balance at the end of the ice cycle year has been negative.
The 12 months to August 2026 were no different. Once all these factors are considered, Greenland lost around 135bn tonnes of ice.
We reached this figure using the same method featured in previous Carbon Brief analyses of Greenland ice cover. This approach is based on an average of three climate models.
#gform_wrapper_5[data-form-index="0"].gform-theme,[data-parent-form="5_0"]{--gf-color-primary: #204ce5;--gf-color-primary-rgb: 32, 76, 229;--gf-color-primary-contrast: #fff;--gf-color-primary-contrast-rgb: 255, 255, 255;--gf-color-primary-darker: #001AB3;--gf-color-primary-lighter: #527EFF;--gf-color-secondary: #fff;--gf-color-secondary-rgb: 255, 255, 255;--gf-color-secondary-contrast: #112337;--gf-color-secondary-contrast-rgb: 17, 35, 55;--gf-color-secondary-darker: #F5F5F5;--gf-color-secondary-lighter: #FFFFFF;--gf-color-out-ctrl-light: rgba(17, 35, 55, 0.1);--gf-color-out-ctrl-light-rgb: 17, 35, 55;--gf-color-out-ctrl-light-darker: rgba(104, 110, 119, 0.35);--gf-color-out-ctrl-light-lighter: #F5F5F5;--gf-color-out-ctrl-dark: #585e6a;--gf-color-out-ctrl-dark-rgb: 88, 94, 106;--gf-color-out-ctrl-dark-darker: #112337;--gf-color-out-ctrl-dark-lighter: rgba(17, 35, 55, 0.65);--gf-color-in-ctrl: #fff;--gf-color-in-ctrl-rgb: 255, 255, 255;--gf-color-in-ctrl-contrast: #112337;--gf-color-in-ctrl-contrast-rgb: 17, 35, 55;--gf-color-in-ctrl-darker: #F5F5F5;--gf-color-in-ctrl-lighter: #FFFFFF;--gf-color-in-ctrl-primary: #204ce5;--gf-color-in-ctrl-primary-rgb: 32, 76, 229;--gf-color-in-ctrl-primary-contrast: #fff;--gf-color-in-ctrl-primary-contrast-rgb: 255, 255, 255;--gf-color-in-ctrl-primary-darker: #001AB3;--gf-color-in-ctrl-primary-lighter: #527EFF;--gf-color-in-ctrl-light: rgba(17, 35, 55, 0.1);--gf-color-in-ctrl-light-rgb: 17, 35, 55;--gf-color-in-ctrl-light-darker: rgba(104, 110, 119, 0.35);--gf-color-in-ctrl-light-lighter: #F5F5F5;--gf-color-in-ctrl-dark: #585e6a;--gf-color-in-ctrl-dark-rgb: 88, 94, 106;--gf-color-in-ctrl-dark-darker: #112337;--gf-color-in-ctrl-dark-lighter: rgba(17, 35, 55, 0.65);--gf-radius: 3px;--gf-font-size-secondary: 14px;--gf-font-size-tertiary: 13px;--gf-icon-ctrl-number: url("data:image/svg+xml,%3Csvg width='8' height='14' viewBox='0 0 8 14' fill='none' xmlns='http://www.w3.org/2000/svg'%3E%3Cpath fill-rule='evenodd' clip-rule='evenodd' d='M4 0C4.26522 5.96046e-08 4.51957 0.105357 4.70711 0.292893L7.70711 3.29289C8.09763 3.68342 8.09763 4.31658 7.70711 4.70711C7.31658 5.09763 6.68342 5.09763 6.29289 4.70711L4 2.41421L1.70711 4.70711C1.31658 5.09763 0.683417 5.09763 0.292893 4.70711C-0.0976311 4.31658 -0.097631 3.68342 0.292893 3.29289L3.29289 0.292893C3.48043 0.105357 3.73478 0 4 0ZM0.292893 9.29289C0.683417 8.90237 1.31658 8.90237 1.70711 9.29289L4 11.5858L6.29289 9.29289C6.68342 8.90237 7.31658 8.90237 7.70711 9.29289C8.09763 9.68342 8.09763 10.3166 7.70711 10.7071L4.70711 13.7071C4.31658 14.0976 3.68342 14.0976 3.29289 13.7071L0.292893 10.7071C-0.0976311 10.3166 -0.0976311 9.68342 0.292893 9.29289Z' fill='rgba(17, 35, 55, 0.65)'/%3E%3C/svg%3E");--gf-icon-ctrl-select: url("data:image/svg+xml,%3Csvg width='10' height='6' viewBox='0 0 10 6' fill='none' xmlns='http://www.w3.org/2000/svg'%3E%3Cpath fill-rule='evenodd' clip-rule='evenodd' d='M0.292893 0.292893C0.683417 -0.097631 1.31658 -0.097631 1.70711 0.292893L5 3.58579L8.29289 0.292893C8.68342 -0.0976311 9.31658 -0.0976311 9.70711 0.292893C10.0976 0.683417 10.0976 1.31658 9.70711 1.70711L5.70711 5.70711C5.31658 6.09763 4.68342 6.09763 4.29289 5.70711L0.292893 1.70711C-0.0976311 1.31658 -0.0976311 0.683418 0.292893 0.292893Z' fill='rgba(17, 35, 55, 0.65)'/%3E%3C/svg%3E");--gf-icon-ctrl-search: url("data:image/svg+xml,%3Csvg width='640' height='640' xmlns='http://www.w3.org/2000/svg'%3E%3Cpath d='M256 128c-70.692 0-128 57.308-128 128 0 70.691 57.308 128 128 128 70.691 0 128-57.309 128-128 0-70.692-57.309-128-128-128zM64 256c0-106.039 85.961-192 192-192s192 85.961 192 192c0 41.466-13.146 79.863-35.498 111.248l154.125 154.125c12.496 12.496 12.496 32.758 0 45.254s-32.758 12.496-45.254 0L367.248 412.502C335.862 434.854 297.467 448 256 448c-106.039 0-192-85.962-192-192z' fill='rgba(17, 35, 55, 0.65)'/%3E%3C/svg%3E");--gf-label-space-y-secondary: var(--gf-label-space-y-md-secondary);--gf-ctrl-border-color: #686e77;--gf-ctrl-size: var(--gf-ctrl-size-md);--gf-ctrl-label-color-primary: #112337;--gf-ctrl-label-color-secondary: #112337;--gf-ctrl-choice-size: var(--gf-ctrl-choice-size-md);--gf-ctrl-checkbox-check-size: var(--gf-ctrl-checkbox-check-size-md);--gf-ctrl-radio-check-size: var(--gf-ctrl-radio-check-size-md);--gf-ctrl-btn-font-size: var(--gf-ctrl-btn-font-size-md);--gf-ctrl-btn-padding-x: var(--gf-ctrl-btn-padding-x-md);--gf-ctrl-btn-size: var(--gf-ctrl-btn-size-md);--gf-ctrl-btn-border-color-secondary: #686e77;--gf-ctrl-file-btn-bg-color-hover: #EBEBEB;--gf-field-img-choice-size: var(--gf-field-img-choice-size-md);--gf-field-img-choice-card-space: var(--gf-field-img-choice-card-space-md);--gf-field-img-choice-check-ind-size: var(--gf-field-img-choice-check-ind-size-md);--gf-field-img-choice-check-ind-icon-size: var(--gf-field-img-choice-check-ind-icon-size-md);--gf-field-pg-steps-number-color: rgba(17, 35, 55, 0.8);} CompanyThis field is for validation purposes and should be left unchanged.Free fortnightly newsletter
.preheader p{ margin-top: 0; font-family: 'PT Sans', sans-serif; font-weight: var(--type--3--font-weight--bold); color: var(--button--color); font-size: var(--button--font-size, inherit); } .newsletter-inline{
display: flex;
border: solid 1px #333333;
padding: 1em;
background: #ffffff;
}
.inline-email{
display:inline-block;
margin-right:1em;
margin-top:0 !important;
margin-bottom:0.5em;
}
#field_submit{
display:inline-block;
margin-top:0 !important;
}
.gform_wrapper .gfield+.gfield{
margin-top:0
}
Email
gform.initializeOnLoaded( function() {gformInitSpinner( 5, 'https://www.carbonbrief.org/wp-content/plugins/gravityforms/images/spinner.svg', false );jQuery('#gform_ajax_frame_5').on('load',function(){var contents = jQuery(this).contents().find('*').html();var is_postback = contents.indexOf('GF_AJAX_POSTBACK') >= 0;if(!is_postback){return;}var form_content = jQuery(this).contents().find('#gform_wrapper_5');var is_confirmation = jQuery(this).contents().find('#gform_confirmation_wrapper_5').length > 0;var is_redirect = contents.indexOf('gformRedirect(){') >= 0;var is_form = form_content.length > 0 && ! is_redirect && ! is_confirmation;var mt = parseInt(jQuery('html').css('margin-top'), 10) + parseInt(jQuery('body').css('margin-top'), 10) + 100;if(is_form){jQuery('#gform_wrapper_5').html(form_content.html());if(form_content.hasClass('gform_validation_error')){jQuery('#gform_wrapper_5').addClass('gform_validation_error');} else {jQuery('#gform_wrapper_5').removeClass('gform_validation_error');}setTimeout( function() { /* delay the scroll by 50 milliseconds to fix a bug in chrome */ jQuery(document).scrollTop(jQuery('#gform_wrapper_5').offset().top - mt); }, 50 );if(window['gformInitDatepicker']) {gformInitDatepicker();}if(window['gformInitPriceFields']) {gformInitPriceFields();}var current_page = jQuery('#gform_source_page_number_5').val();gformInitSpinner( 5, 'https://www.carbonbrief.org/wp-content/plugins/gravityforms/images/spinner.svg', false );jQuery(document).trigger('gform_page_loaded', [5, current_page]);window['gf_submitting_5'] = false;}else if(!is_redirect){var confirmation_content = jQuery(this).contents().find('.GF_AJAX_POSTBACK').html();if(!confirmation_content){confirmation_content = contents;}jQuery('#gform_wrapper_5').replaceWith(confirmation_content);jQuery(document).scrollTop(jQuery('#gf_5').offset().top - mt);jQuery(document).trigger('gform_confirmation_loaded', [5]);window['gf_submitting_5'] = false;wp.a11y.speak(jQuery('#gform_confirmation_message_5').text());}else{jQuery('#gform_5').append(contents);if(window['gformRedirect']) {gformRedirect();}}jQuery(document).trigger("gform_pre_post_render", [{ formId: "5", currentPage: "current_page", abort: function() { this.preventDefault(); } }]); if (event && event.defaultPrevented) { return; } const gformWrapperDiv = document.getElementById( "gform_wrapper_5" ); if ( gformWrapperDiv ) { const visibilitySpan = document.createElement( "span" ); visibilitySpan.id = "gform_visibility_test_5"; gformWrapperDiv.insertAdjacentElement( "afterend", visibilitySpan ); } const visibilityTestDiv = document.getElementById( "gform_visibility_test_5" ); let postRenderFired = false; function triggerPostRender() { if ( postRenderFired ) { return; } postRenderFired = true; gform.core.triggerPostRenderEvents( 5, current_page ); if ( visibilityTestDiv ) { visibilityTestDiv.parentNode.removeChild( visibilityTestDiv ); } } function debounce( func, wait, immediate ) { var timeout; return function() { var context = this, args = arguments; var later = function() { timeout = null; if ( !immediate ) func.apply( context, args ); }; var callNow = immediate && !timeout; clearTimeout( timeout ); timeout = setTimeout( later, wait ); if ( callNow ) func.apply( context, args ); }; } const debouncedTriggerPostRender = debounce( function() { triggerPostRender(); }, 200 ); if ( visibilityTestDiv && visibilityTestDiv.offsetParent === null ) { const observer = new MutationObserver( ( mutations ) => { mutations.forEach( ( mutation ) => { if ( mutation.type === 'attributes' && visibilityTestDiv.offsetParent !== null ) { debouncedTriggerPostRender(); observer.disconnect(); } }); }); observer.observe( document.body, { attributes: true, childList: false, subtree: true, attributeFilter: [ 'style', 'class' ], }); } else { triggerPostRender(); } } );} );
However, for the first time, this year's update includes a separate estimate for Greenland ice loss, based on data from one climate model and automatic weather stations, satellites, GPS data and observations from planes.
This approach estimates that the ice sheet lost an even greater 173bn tonnes of ice over 2025-26.
(Scientific estimates for ice loss in Greenland vary because there is incomplete information about how thick the ice sheet is, how fast it is moving as well as the rate at which it is melting at the surface. Scientists use different approaches for accounting for these uncertainties.)
The chart below shows how Greenland's total mass balance has changed since 1985, featuring the higher 173bn estimate for the last ice cycle year.
It shows how 2025-26 was the 30th consecutive year of ice loss in Greenland, with 1996 the last year that saw an annual net gain of ice.
 Labels on the x-axis denote the period 1 September to 31 August, where 1987 covers 1 September 1986 to 31 August 1987.
The chart below shows how Greenland's surface mass balance, marine mass balance and basal mass balance have changed since 1985. All of these components are combined to calculate the ice sheet's total mass balance (red).
 Labels on the x-axis denote the period 1 September to 31 August, where 1987 covers 1 September 1986 to 31 August 1987.
Surface melt
Winter and early spring in 2025-26 were unusually dry in the southern half of Greenland, leaving around 40bn tonnes less snow on the ice sheet than normal.
Dry winters typically mean high ice melt rates later on, given that heavier winter snowfall often acts as a protective shield that prevents ice loss in the early part of summer.
However, the relatively dry winter was followed by a relatively cool start of summer. Frequent snowfall and extensive cloud cover limited the sun's ability to warm the surface at the time of year when solar radiation is typically strongest.
The onset of the melt season - the first of at least three consecutive days with melting over more than 5% of the ice sheet - occurred on 5 June, nine days later than the 1981-2010 average.
From the end of June, the weather in Greenland changed markedly, as warm, sunny conditions took hold.
During the first 20 days of July, melting was well above the 1981-2020 average. At its peak on 22 July, melting covered 74.9% of the ice sheet.
(For comparison, July 2025 holds the record for melt area in Greenland, when 81.2% of the continent was melting simultaneously.)
However, the early season fresh snow in June helped to form a cold and bright buffer, reducing the subsequent summer ice melt and runoff.
The map below shows how roughly three-quarters of Greenland's ice sheet - shaded in red - was experiencing surface melt on 22 July. The chart shows how surface melt on that date (blue line) outpaced the 1981-2010 average (grey line and shading).
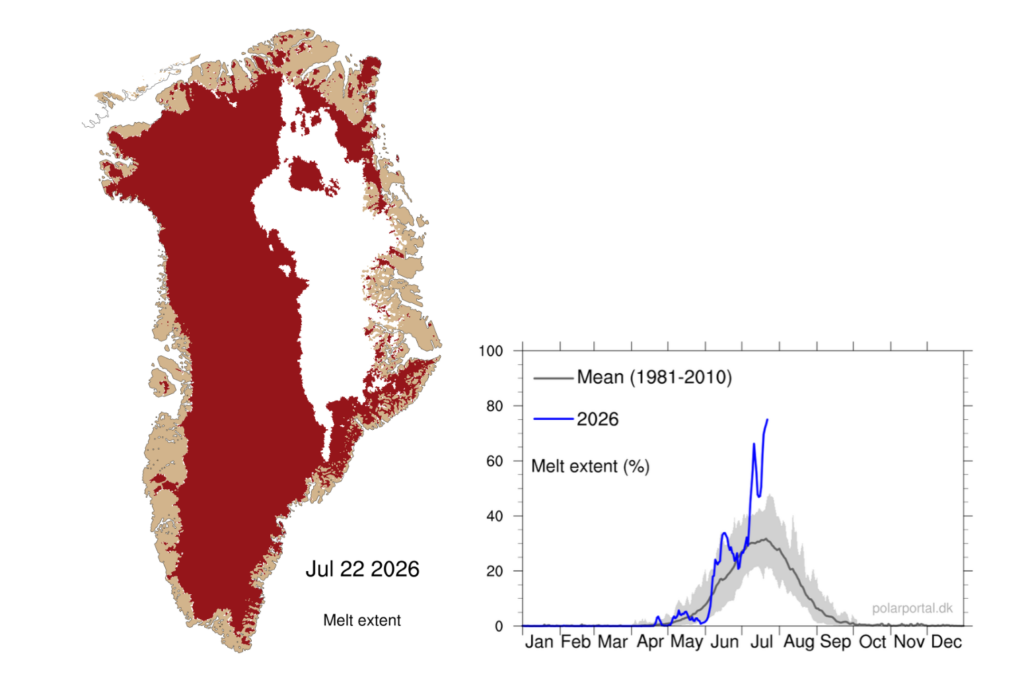 Map showing areas of Greenland undergoing surface melt (shaded red) on 22 July 2026. Chart shows percentage of ice sheet area which saw surface melt on 22 July 2026 (blue) compared to the 1981-2010 average (grey). Credit: Polar Portal.
Snowfall
As mentioned above, snowfall is the only way for the ice sheet to gain mass.
Because the dry 2025-26 winter did not provide the usual thick layer of snow to act as a protective buffer, the ice sheet started the summer already "behind" on ice levels.
However, even though there was above-average melting during summer, the surface mass balance remained almost constant from mid-June to mid-July. It was only slightly smaller by the end of August.
This was because much of the melt trickled into the snow below and refroze.
South-east Greenland is typically the wettest part of the ice sheet and this year was no exception. Unlike other years though, there was also significant snowfall on the west coast north of Nuussuaq.
Summer snowfall helps to preserve the ice sheet, as fresh snow is brighter than old glacier ice and reflects more of the sun's energy back to space.
Increases in both snowfall and melt are in line with what scientists expect in a warming climate. Warmer air holds more water vapour, bringing more snow and rain, while higher temperatures drive more ice melt.
Iceberg calvingThe most dramatic ice loss of 2025-26 happened at Greenland's edges.
On 4 August, a vast tabular iceberg - an "ice island" with nearly vertical sides and a flat top - broke away from the floating ice tongue of Petermann glacier in north-west Greenland.
 Sentinel-1 image sequence of the Petermann ice island, before and after the 4 August 2026 calving. Credit: ESA/Copernicus.
More than 76 square kilometres (km2) in size, with an estimated thickness of 150 metres, the amount of water frozen in this iceberg would be enough to submerge the entirety of greater London to a depth of 6.65m.
This was the largest loss of floating ice at the Petermann glacier since 2012 and the biggest calving event by any Arctic glacier since 2020.
Similar breakoffs occurred in 2010 and 2012 and the current one had long been expected, given growing cracks in the glacier for several years.
Scientists anticipate more calving events at the Petermann glacier. Two further ice islands, with estimated areas of roughly 94 and 84km2, are expected to detach as existing rifts continue to cut across the ice tongue.
Together, the three would remove about 22% of Petermann's remaining floating ice.
Because the ice tongue is already floating, this calving does not directly raise sea levels. But Petermann is one of Greenland's largest marine-terminating glaciers, acting as a brake on ice flowing from the interior to the ocean.
The recent breakaway is a reminder that calving and glacier retreat continue apace in Greenland, even in years when the surface mass budget is unremarkable. (To date, calving and glacier retreat have driven roughly two-thirds of total ice loss on the continent.)
The impact of global weatherGreenland's relatively high surface mass balance in 2025-26 can be explained, in part, by the hot summer in Europe.
Multiple heatwaves were observed across southern Europe and North America over the summer of 2026, with temperature records recorded in multiple countries.
When high-pressure systems that cause heatwaves become blocked in place, the jet stream - fast-moving winds that blow from west to east high in the atmosphere - is shaped like the Greek capital letter Omega (Ω). This is the pattern that dominated this year.
Warm conditions settle near the cores of high-pressure systems, while cool, wet conditions can be found at the "feet" of the Omega.
This year, Greenland was on the right side of the Omega-shaped jet stream and thus experienced cooler conditions.
If the Omega pattern had been displaced by half a wavelength, Greenland would have likely seen warm temperatures that brought record levels of melt - and a lower surface mass balance.
Three decades of declineSo, why does the milestone of 30 years of ice mass decline in Greenland matter?
A single year, however dramatic, can be strongly influenced by the weather. An extreme melt summer - or an unusually cold, snowy one - says little on its own about the region's long-term trajectory.
This is why climate scientists typically look at 30-year periods when distinguishing a change in climate from natural variability.
Thirty years of data shows that the annual ice budget in Greenland has ended in the red, without exception, since 1996. This applies to warm years, cold years and snowy years.
The largest single-year loss remains 2012, when around 458bn tonnes of ice disappeared from the ice sheet.
The past two years have been moderate by comparison - yet even these "quiet" years produced losses of more than 100bn tonnes each.
Thirty years of data on ice mass decline means that scientists now can confidently say that Greenland mass loss is due to climate change.
Greenland in the global sea level pictureA new assessment highlights how Greenland's losses are the largest single contribution from the ice sheets to global sea level rise.
The Ice Sheet Mass Balance Intercomparison Exercise (IMBIE) combines 42 independent estimates of ice sheet mass change from satellite gravimetry, altimetry and the input-output method - including the Danish Meteorological Institute's surface mass balance estimates detailed in this article - all into a single record.
The latest assessment, published in the journal Scientific Data in September, shows that Greenland and Antarctica together lost 11,309bn tonnes of ice between 1979 and 2023, raising global sea levels by around 32mm.
The two ice sheets now account for almost one-quarter of observed global sea level rise.
Greenland dominates that record. It lost 6,215bn tonnes of ice between 1972 and 2023 - an average of 119bn tonnes per year. Two-thirds of the loss was driven by increased ice discharge and one-third by reduced surface mass balance due to increased melt.
Annual losses from ice melt accelerated from around 60bn tonnes in the 1980s to 264bn tonnes in the 2010s.
In contrast, Antarctica lost 4,780bn tonnes over the same period, raising sea levels by around 13mm.
All of Antarctica's losses are due to discharge from the ice sheet, concentrated in west Antarctica. East Antarctica, on the other hand, has so far remained relatively stable, with record snowfall in recent years even producing a small mass gain.
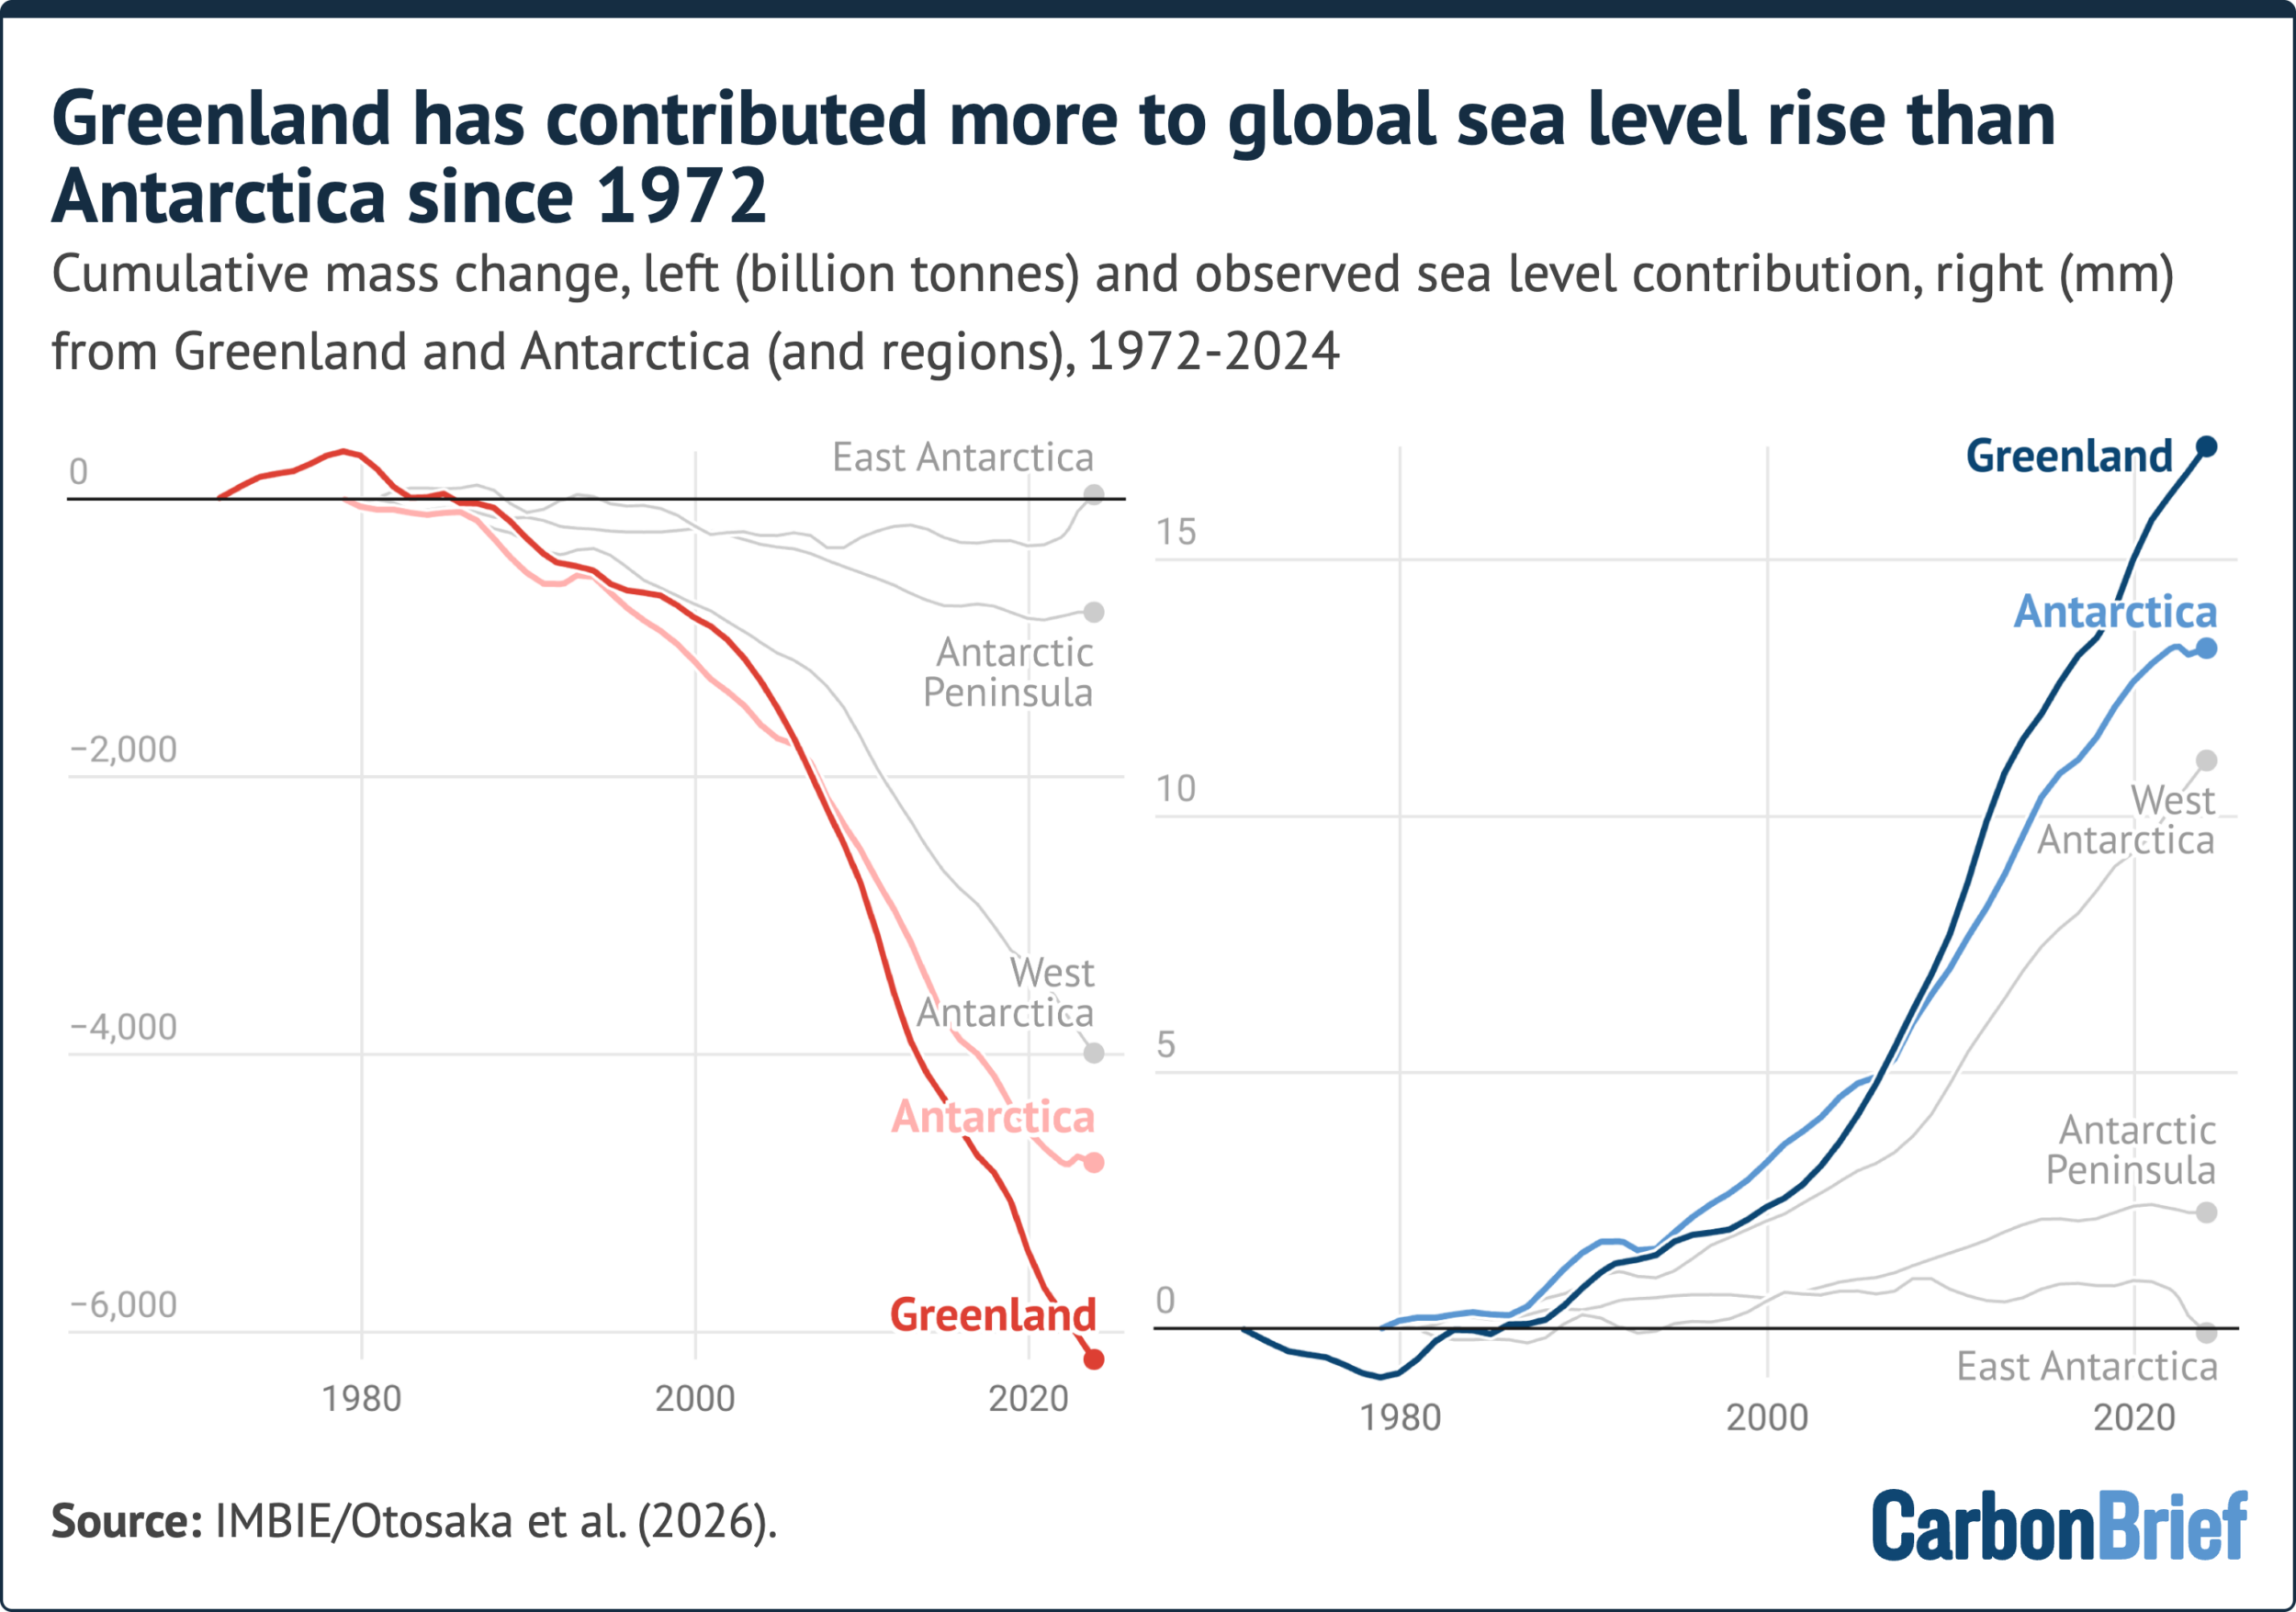
This division in sea-level contribution is expected to change. Greenland's losses to date amount to only a few centimetres of sea level rise, but Antarctica's ice sheet is roughly 10 times larger and therefore could lead to significantly more sea level rise in the future.
The IMBIE assessment notes that Antarctica's losses are dominated by marine-terminating glaciers whose stability is hardest to predict.
The processes now increasingly observed in Antarctica - increasing surface melt, shrinking sea ice, loss of ice shelves and seasonal patterns of retreat of outlet glaciers - have been seen in Greenland for decades. We call this the "Greenlandification" of Antarctica.
Greenland, in other words, is not just the largest present-day source of ice-driven sea level rise - it is also a preview of what may come from the far larger ice sheet at the other end of the planet.
Related Q&A: How Trump is threatening climate science in Earth's polar regions
20.02.2026
Antarctica
 Guest post: The challenges in projecting future global sea levels
17.02.2026
Greenland
 State of the climate: 2025 in top-three hottest years on record as ocean heat surges
14.01.2026
Climate modelling
 Guest post: How the Greenland ice sheet fared in 2025
15.12.2025
Greenland
The post Guest post: Greenland ice sheet shrinks for 30th year in a row appeared first on Carbon Brief.
For the first time, new-energy vehicles (NEVs) made up 67% of new car sales in China in September, according to the latest data from the China Passenger Car Association (CPCA).
The figures show that NEVs, which include battery electric cars and plug-in hybrids, captured a record share of sales, even though fewer were sold than last year.
This is because sales of combustion-engine cars are falling steeply, a trend that the CPCA has attributed to rising petrol prices following the start of the Hormuz crisis.
Indeed, sales of fuel-only cars were down 31% year-on-year in the first nine months of 2026, with plug-in hybrid sales down 26% - whereas battery EV sales were only down 4%.
One analyst tells Carbon Brief that China's rapidly growing EV fleet has offset demand for 143m barrels of oil since the start of the Hormuz crisis.
Another says that the crisis is "reinforcing China's electrification of road transport".
Meanwhile, amid slowing domestic sales, Chinese carmakers' exports of NEVs more than doubled [in 2026 to date / in September] from a year earlier.
NEV recordA record two out of every three cars sold in September in China were NEVs, according to CPCA data, as shown in the figure below.
(NEVs predominantly include battery electric vehicles - BEVs - and plug-in hybrids - PHEVs. BEVs only run on electricity, whereas PHEVs also have a combustion engine.)
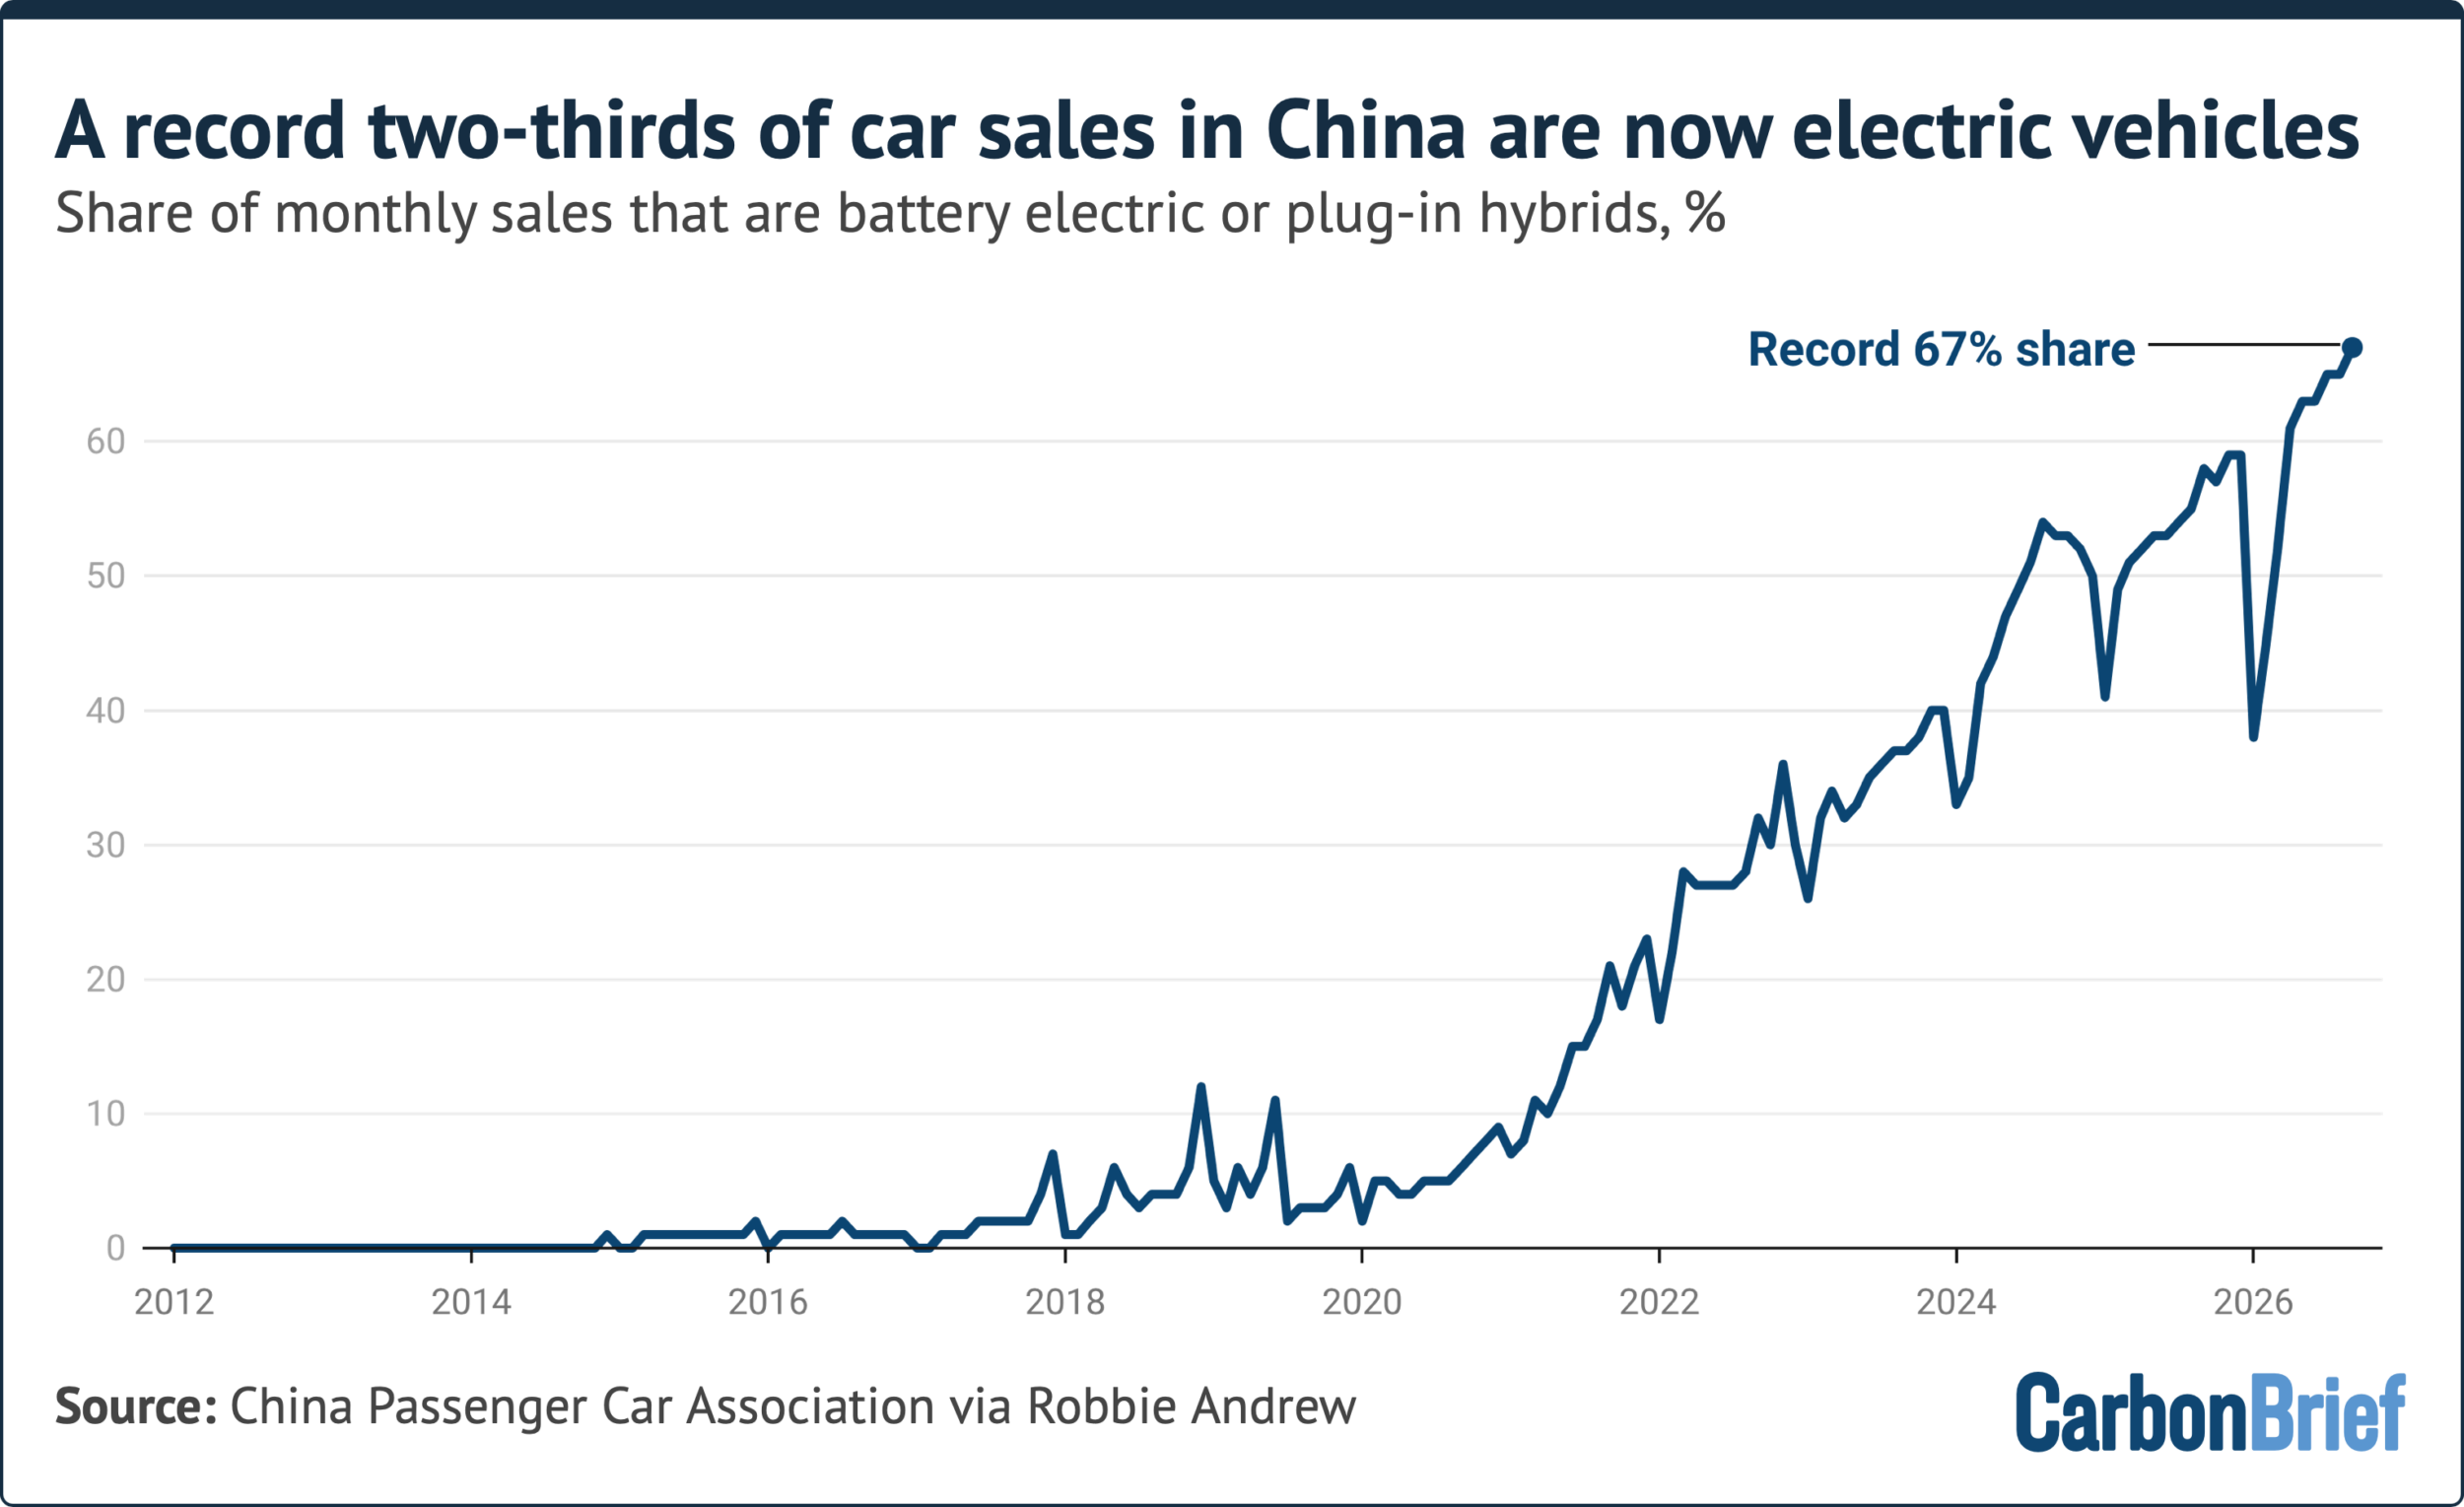
This marks a rapid rise for NEVs from just 6% of new car sales in 2020 up to 58% in 2026 to date - and a record 67% in the month of September.
This year, NEVs' share of sales has also bounced back from a low of 39% in January, after the full purchase tax exemption that had been in place for more than a decade came to an end in December 2025.
The gain in NEV share in 2026 has come amid a slowdown across the wider domestic passenger-car market, which has hit sales of combustion-engine vehicles particularly hard.
This September, passenger-car retail sales across all categories declined, with overall sales volumes falling 28% year-on-year.
The contraction was led by combustion-engine vehicles, which saw sales fall 43% year-on-year in September and 31% in 2026 to date.
However, sales of PHEVs also fell by 36% year-on-year in September and by 26% in 2026 to date. By comparison, BEVs performed better, although sales still declined 8.5% from a year earlier in September and 4% in 2026 to date.
As a result, NEV sales overall fell by 17% in September and 13% in 2026 to date.
While the market changes in 2026 to date were particularly dramatic, they reflect a broad continuation of trends seen over the past decade.
Indeed, sales of combustion-engine cars in China peaked in 2017 and they have been declining ever since, shown in the figure below.
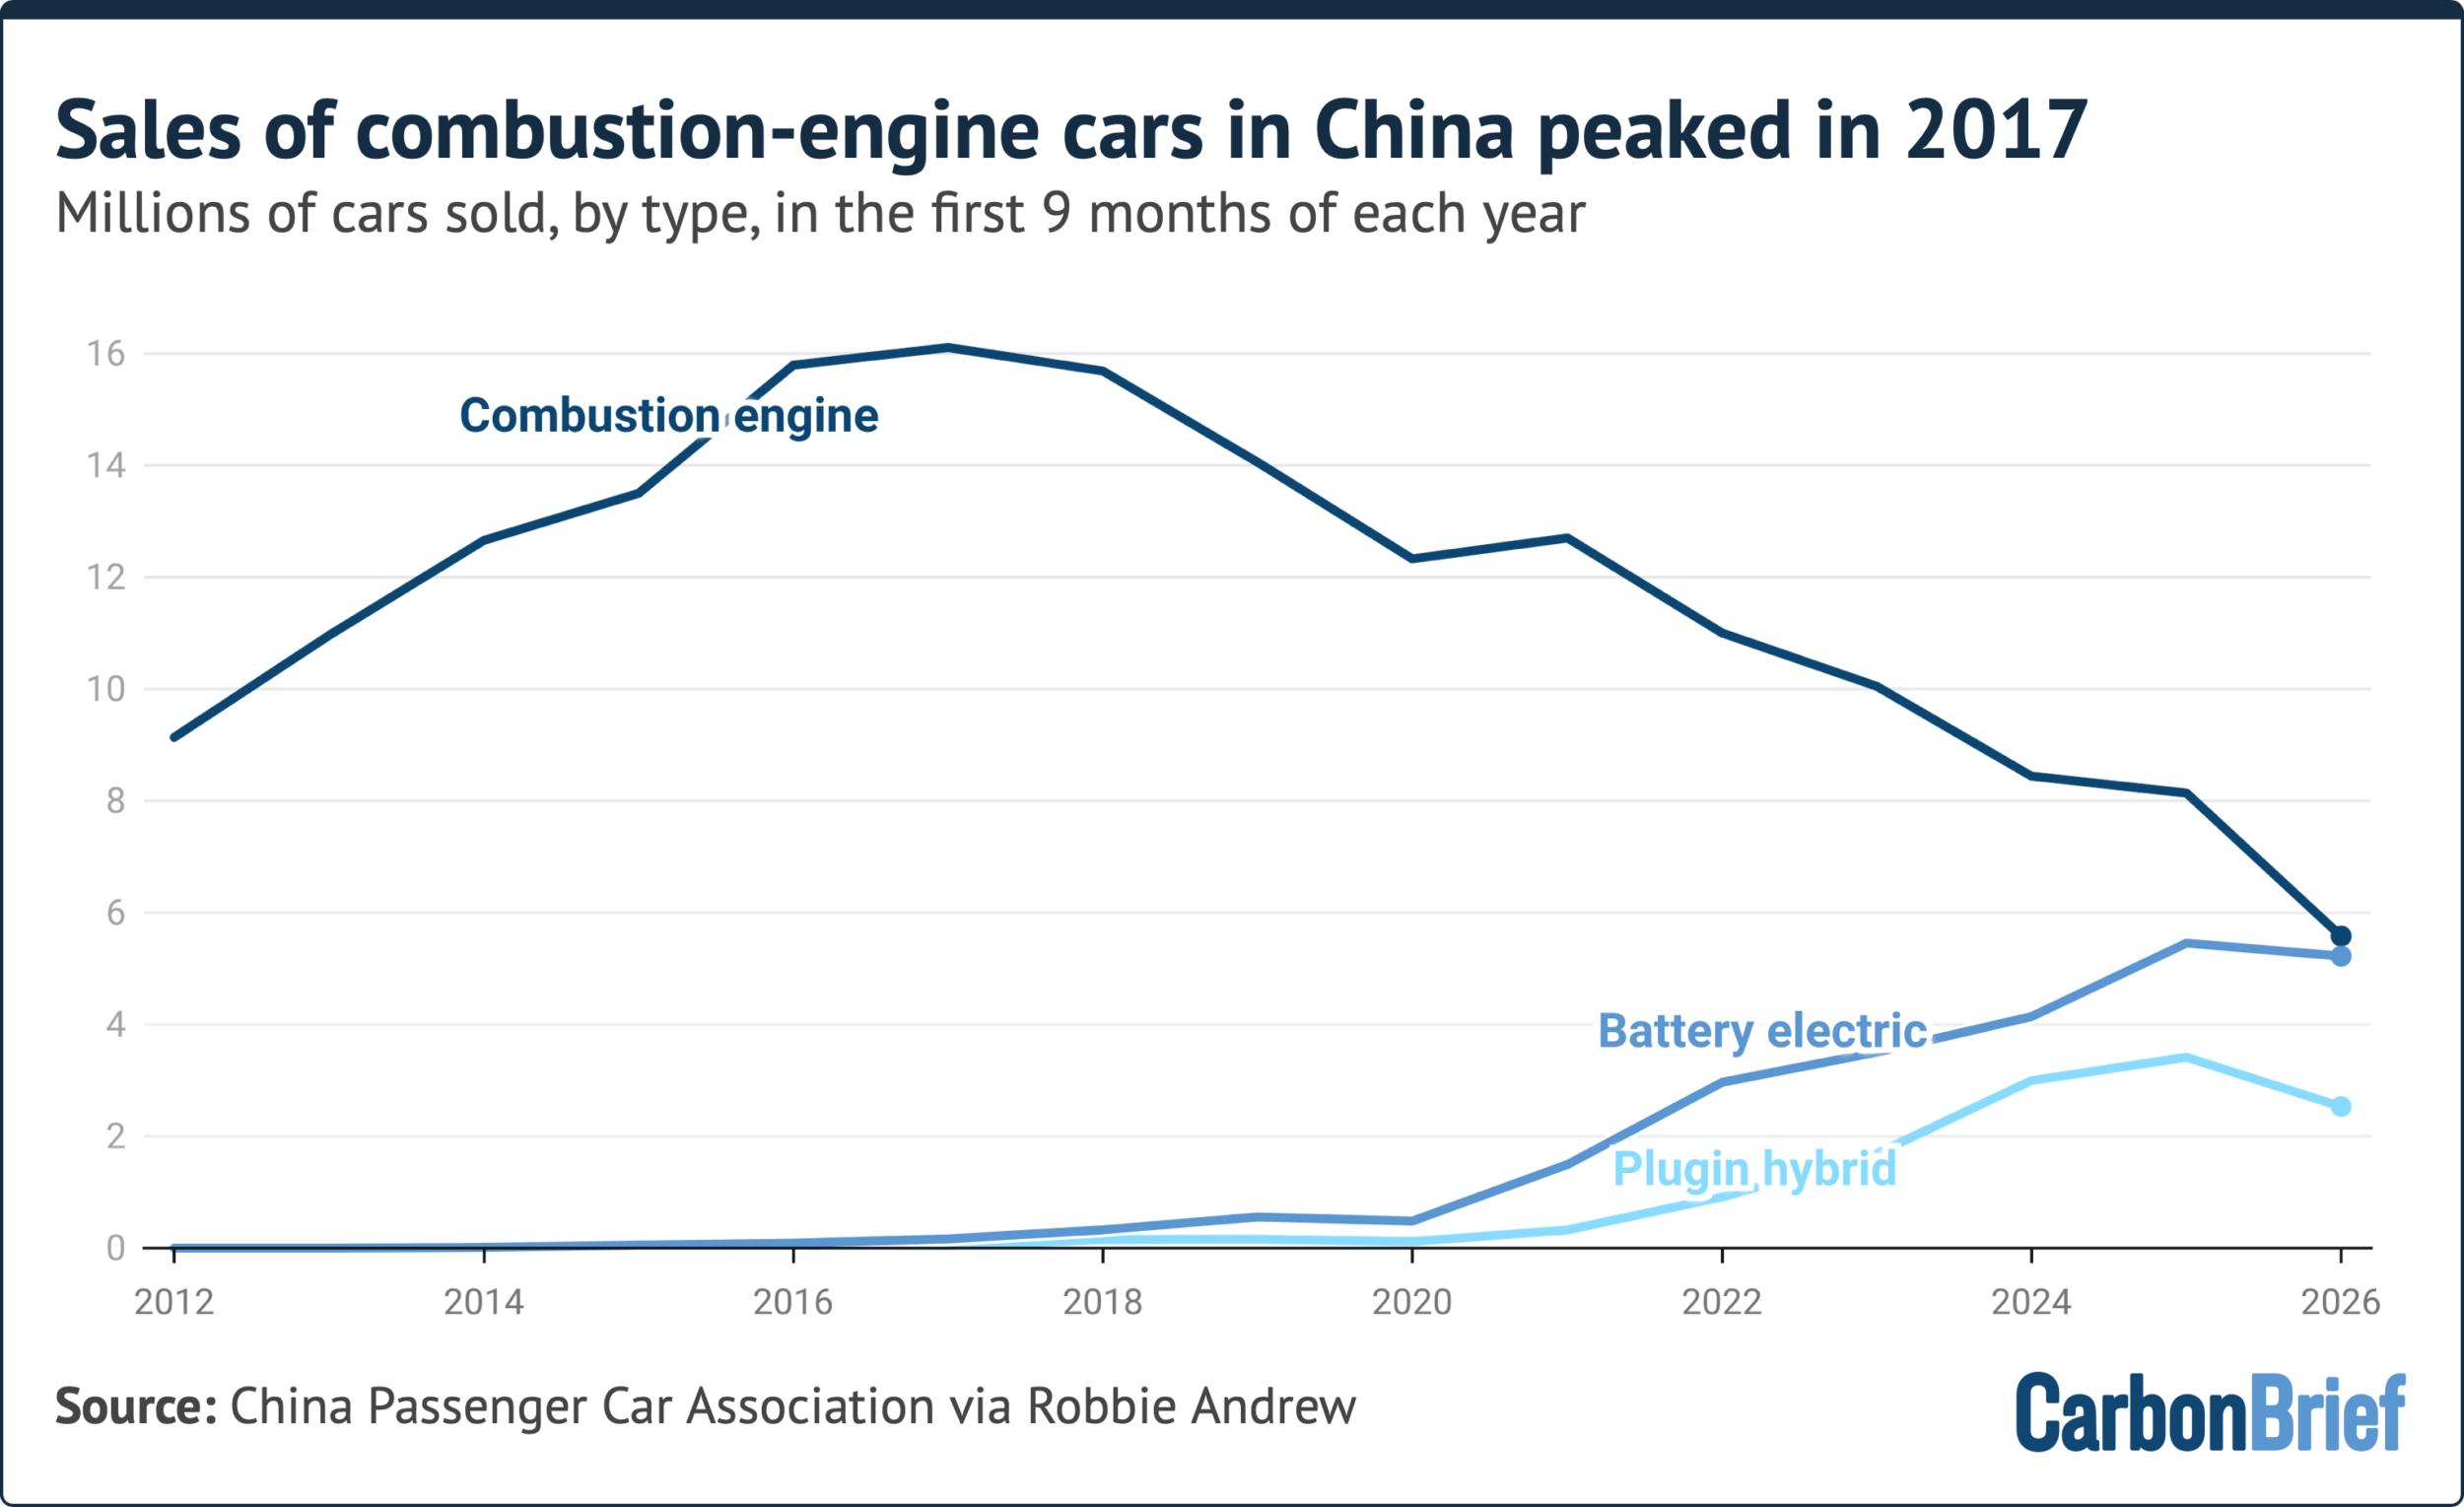 Impact of Hormuz
Part of the reason for the advance of NEVs in 2026, said Chinese technology news outlet OFweek, was petrol cars "giving up market share" as they were outperformed by electric alternatives.
Cui Dongshu, secretary-general of the CPCA, cited higher petrol prices as an explanation for September's weak combustion-car sales, in comments to financial news outlet National Business Daily.
Imports of oil into China in January-September have fallen 15% compared to 2025, equivalent to 470m barrels, as ongoing conflict tightened supply and drove up prices.
China's passenger-car NEV fleet has displaced 143m barrels of oil so far during the strait of Hormuz crisis, Euan Graham, senior energy analyst at thinktank Ember, tells Carbon Brief.
EVs "accounted for 12% of the decrease in China's oil use post-Hormuz", according to an estimate provided to thinktank the Brookings Institute by an unnamed analyst.
#gform_wrapper_6[data-form-index="0"].gform-theme,[data-parent-form="6_0"]{--gf-color-primary: #204ce5;--gf-color-primary-rgb: 32, 76, 229;--gf-color-primary-contrast: #fff;--gf-color-primary-contrast-rgb: 255, 255, 255;--gf-color-primary-darker: #001AB3;--gf-color-primary-lighter: #527EFF;--gf-color-secondary: #fff;--gf-color-secondary-rgb: 255, 255, 255;--gf-color-secondary-contrast: #112337;--gf-color-secondary-contrast-rgb: 17, 35, 55;--gf-color-secondary-darker: #F5F5F5;--gf-color-secondary-lighter: #FFFFFF;--gf-color-out-ctrl-light: rgba(17, 35, 55, 0.1);--gf-color-out-ctrl-light-rgb: 17, 35, 55;--gf-color-out-ctrl-light-darker: rgba(104, 110, 119, 0.35);--gf-color-out-ctrl-light-lighter: #F5F5F5;--gf-color-out-ctrl-dark: #585e6a;--gf-color-out-ctrl-dark-rgb: 88, 94, 106;--gf-color-out-ctrl-dark-darker: #112337;--gf-color-out-ctrl-dark-lighter: rgba(17, 35, 55, 0.65);--gf-color-in-ctrl: #fff;--gf-color-in-ctrl-rgb: 255, 255, 255;--gf-color-in-ctrl-contrast: #112337;--gf-color-in-ctrl-contrast-rgb: 17, 35, 55;--gf-color-in-ctrl-darker: #F5F5F5;--gf-color-in-ctrl-lighter: #FFFFFF;--gf-color-in-ctrl-primary: #204ce5;--gf-color-in-ctrl-primary-rgb: 32, 76, 229;--gf-color-in-ctrl-primary-contrast: #fff;--gf-color-in-ctrl-primary-contrast-rgb: 255, 255, 255;--gf-color-in-ctrl-primary-darker: #001AB3;--gf-color-in-ctrl-primary-lighter: #527EFF;--gf-color-in-ctrl-light: rgba(17, 35, 55, 0.1);--gf-color-in-ctrl-light-rgb: 17, 35, 55;--gf-color-in-ctrl-light-darker: rgba(104, 110, 119, 0.35);--gf-color-in-ctrl-light-lighter: #F5F5F5;--gf-color-in-ctrl-dark: #585e6a;--gf-color-in-ctrl-dark-rgb: 88, 94, 106;--gf-color-in-ctrl-dark-darker: #112337;--gf-color-in-ctrl-dark-lighter: rgba(17, 35, 55, 0.65);--gf-radius: 3px;--gf-font-size-secondary: 14px;--gf-font-size-tertiary: 13px;--gf-icon-ctrl-number: url("data:image/svg+xml,%3Csvg width='8' height='14' viewBox='0 0 8 14' fill='none' xmlns='http://www.w3.org/2000/svg'%3E%3Cpath fill-rule='evenodd' clip-rule='evenodd' d='M4 0C4.26522 5.96046e-08 4.51957 0.105357 4.70711 0.292893L7.70711 3.29289C8.09763 3.68342 8.09763 4.31658 7.70711 4.70711C7.31658 5.09763 6.68342 5.09763 6.29289 4.70711L4 2.41421L1.70711 4.70711C1.31658 5.09763 0.683417 5.09763 0.292893 4.70711C-0.0976311 4.31658 -0.097631 3.68342 0.292893 3.29289L3.29289 0.292893C3.48043 0.105357 3.73478 0 4 0ZM0.292893 9.29289C0.683417 8.90237 1.31658 8.90237 1.70711 9.29289L4 11.5858L6.29289 9.29289C6.68342 8.90237 7.31658 8.90237 7.70711 9.29289C8.09763 9.68342 8.09763 10.3166 7.70711 10.7071L4.70711 13.7071C4.31658 14.0976 3.68342 14.0976 3.29289 13.7071L0.292893 10.7071C-0.0976311 10.3166 -0.0976311 9.68342 0.292893 9.29289Z' fill='rgba(17, 35, 55, 0.65)'/%3E%3C/svg%3E");--gf-icon-ctrl-select: url("data:image/svg+xml,%3Csvg width='10' height='6' viewBox='0 0 10 6' fill='none' xmlns='http://www.w3.org/2000/svg'%3E%3Cpath fill-rule='evenodd' clip-rule='evenodd' d='M0.292893 0.292893C0.683417 -0.097631 1.31658 -0.097631 1.70711 0.292893L5 3.58579L8.29289 0.292893C8.68342 -0.0976311 9.31658 -0.0976311 9.70711 0.292893C10.0976 0.683417 10.0976 1.31658 9.70711 1.70711L5.70711 5.70711C5.31658 6.09763 4.68342 6.09763 4.29289 5.70711L0.292893 1.70711C-0.0976311 1.31658 -0.0976311 0.683418 0.292893 0.292893Z' fill='rgba(17, 35, 55, 0.65)'/%3E%3C/svg%3E");--gf-icon-ctrl-search: url("data:image/svg+xml,%3Csvg width='640' height='640' xmlns='http://www.w3.org/2000/svg'%3E%3Cpath d='M256 128c-70.692 0-128 57.308-128 128 0 70.691 57.308 128 128 128 70.691 0 128-57.309 128-128 0-70.692-57.309-128-128-128zM64 256c0-106.039 85.961-192 192-192s192 85.961 192 192c0 41.466-13.146 79.863-35.498 111.248l154.125 154.125c12.496 12.496 12.496 32.758 0 45.254s-32.758 12.496-45.254 0L367.248 412.502C335.862 434.854 297.467 448 256 448c-106.039 0-192-85.962-192-192z' fill='rgba(17, 35, 55, 0.65)'/%3E%3C/svg%3E");--gf-label-space-y-secondary: var(--gf-label-space-y-md-secondary);--gf-ctrl-border-color: #686e77;--gf-ctrl-size: var(--gf-ctrl-size-md);--gf-ctrl-label-color-primary: #112337;--gf-ctrl-label-color-secondary: #112337;--gf-ctrl-choice-size: var(--gf-ctrl-choice-size-md);--gf-ctrl-checkbox-check-size: var(--gf-ctrl-checkbox-check-size-md);--gf-ctrl-radio-check-size: var(--gf-ctrl-radio-check-size-md);--gf-ctrl-btn-font-size: var(--gf-ctrl-btn-font-size-md);--gf-ctrl-btn-padding-x: var(--gf-ctrl-btn-padding-x-md);--gf-ctrl-btn-size: var(--gf-ctrl-btn-size-md);--gf-ctrl-btn-border-color-secondary: #686e77;--gf-ctrl-file-btn-bg-color-hover: #EBEBEB;--gf-field-img-choice-size: var(--gf-field-img-choice-size-md);--gf-field-img-choice-card-space: var(--gf-field-img-choice-card-space-md);--gf-field-img-choice-check-ind-size: var(--gf-field-img-choice-check-ind-size-md);--gf-field-img-choice-check-ind-icon-size: var(--gf-field-img-choice-check-ind-icon-size-md);--gf-field-pg-steps-number-color: rgba(17, 35, 55, 0.8);} NameThis field is for validation purposes and should be left unchanged.Free fortnightly newsletter
.preheader p{ margin-top: 0; font-family: 'PT Sans', sans-serif; font-weight: var(--type--3--font-weight--bold); color: var(--button--color); font-size: var(--button--font-size, inherit); }
.newsletter-inline{
display: flex;
border: solid 1px #333333;
padding: 1em;
background: #ffffff;
}
.inline-email{
display:inline-block;
margin-right:1em;
margin-top:0 !important;
margin-bottom:0.5em;
}
#field_submit{
display:inline-block;
margin-top:0 !important;
}
.gform_wrapper .gfield+.gfield{
margin-top:0
}
Email
gform.initializeOnLoaded( function() {gformInitSpinner( 6, 'https://www.carbonbrief.org/wp-content/plugins/gravityforms/images/spinner.svg', false );jQuery('#gform_ajax_frame_6').on('load',function(){var contents = jQuery(this).contents().find('*').html();var is_postback = contents.indexOf('GF_AJAX_POSTBACK') >= 0;if(!is_postback){return;}var form_content = jQuery(this).contents().find('#gform_wrapper_6');var is_confirmation = jQuery(this).contents().find('#gform_confirmation_wrapper_6').length > 0;var is_redirect = contents.indexOf('gformRedirect(){') >= 0;var is_form = form_content.length > 0 && ! is_redirect && ! is_confirmation;var mt = parseInt(jQuery('html').css('margin-top'), 10) + parseInt(jQuery('body').css('margin-top'), 10) + 100;if(is_form){jQuery('#gform_wrapper_6').html(form_content.html());if(form_content.hasClass('gform_validation_error')){jQuery('#gform_wrapper_6').addClass('gform_validation_error');} else {jQuery('#gform_wrapper_6').removeClass('gform_validation_error');}setTimeout( function() { /* delay the scroll by 50 milliseconds to fix a bug in chrome */ jQuery(document).scrollTop(jQuery('#gform_wrapper_6').offset().top - mt); }, 50 );if(window['gformInitDatepicker']) {gformInitDatepicker();}if(window['gformInitPriceFields']) {gformInitPriceFields();}var current_page = jQuery('#gform_source_page_number_6').val();gformInitSpinner( 6, 'https://www.carbonbrief.org/wp-content/plugins/gravityforms/images/spinner.svg', false );jQuery(document).trigger('gform_page_loaded', [6, current_page]);window['gf_submitting_6'] = false;}else if(!is_redirect){var confirmation_content = jQuery(this).contents().find('.GF_AJAX_POSTBACK').html();if(!confirmation_content){confirmation_content = contents;}jQuery('#gform_wrapper_6').replaceWith(confirmation_content);jQuery(document).scrollTop(jQuery('#gf_6').offset().top - mt);jQuery(document).trigger('gform_confirmation_loaded', [6]);window['gf_submitting_6'] = false;wp.a11y.speak(jQuery('#gform_confirmation_message_6').text());}else{jQuery('#gform_6').append(contents);if(window['gformRedirect']) {gformRedirect();}}jQuery(document).trigger("gform_pre_post_render", [{ formId: "6", currentPage: "current_page", abort: function() { this.preventDefault(); } }]); if (event && event.defaultPrevented) { return; } const gformWrapperDiv = document.getElementById( "gform_wrapper_6" ); if ( gformWrapperDiv ) { const visibilitySpan = document.createElement( "span" ); visibilitySpan.id = "gform_visibility_test_6"; gformWrapperDiv.insertAdjacentElement( "afterend", visibilitySpan ); } const visibilityTestDiv = document.getElementById( "gform_visibility_test_6" ); let postRenderFired = false; function triggerPostRender() { if ( postRenderFired ) { return; } postRenderFired = true; gform.core.triggerPostRenderEvents( 6, current_page ); if ( visibilityTestDiv ) { visibilityTestDiv.parentNode.removeChild( visibilityTestDiv ); } } function debounce( func, wait, immediate ) { var timeout; return function() { var context = this, args = arguments; var later = function() { timeout = null; if ( !immediate ) func.apply( context, args ); }; var callNow = immediate && !timeout; clearTimeout( timeout ); timeout = setTimeout( later, wait ); if ( callNow ) func.apply( context, args ); }; } const debouncedTriggerPostRender = debounce( function() { triggerPostRender(); }, 200 ); if ( visibilityTestDiv && visibilityTestDiv.offsetParent === null ) { const observer = new MutationObserver( ( mutations ) => { mutations.forEach( ( mutation ) => { if ( mutation.type === 'attributes' && visibilityTestDiv.offsetParent !== null ) { debouncedTriggerPostRender(); observer.disconnect(); } }); }); observer.observe( document.body, { attributes: true, childList: false, subtree: true, attributeFilter: [ 'style', 'class' ], }); } else { triggerPostRender(); } } );} );
Erica Downs, a senior research scholar at Columbia University's Center on Global Energy Policy, tells Carbon Brief that the strait of Hormuz crisis and higher oil prices are "reinforcing China's electrification of road transport".
She says the "world's largest oil supply disruption" vindicates China's early bet on EVs, which was partly driven by concerns about oil-supply security.
NEV demand downNevertheless, NEV sales have fallen year-on-year, albeit at a slower rate than overall car sales. The growth in NEV market share has also been decelerating.
Zhang Yichao, a partner at consulting firm AlixPartners, tells Carbon Brief that NEVs benefit from government trade-in policies and a "strong pipeline" of new models, particularly those involving innovation.
He says these factors help explain why NEVs sales have fallen at a slower rate to their combustion-car counterparts.
Cui told the state-run China National Radio that the fall for NEVs and for cars overall in September 2026, is also due to a high baseline of sales from the same month in 2025, as well as changes to trade-in policies and disruptions from the holiday period.
Other factors, says consulting firm Wood Mackenzie, are the weakened demand due to "demand pull-forward" in 2025 caused by the end of subsidies, as well as "tighter financing conditions".
Zhang tells Carbon Brief he does not "see much more room ahead" for further growth in NEVs' market share.
He adds that, in his view, their share in China is unlikely to exceed 80%, as some premium-market segments and specific use cases will continue to require combustion-engine vehicles.
Exports surgeMeanwhile, while domestic NEV retail sales fell 17% in September 2026, exports more than doubled, increasing 164% year-on-year, according to the CPCA.
This extends the decline in domestic sales and very strong growth in exports seen across 2026 to date, as shown in the figure below.
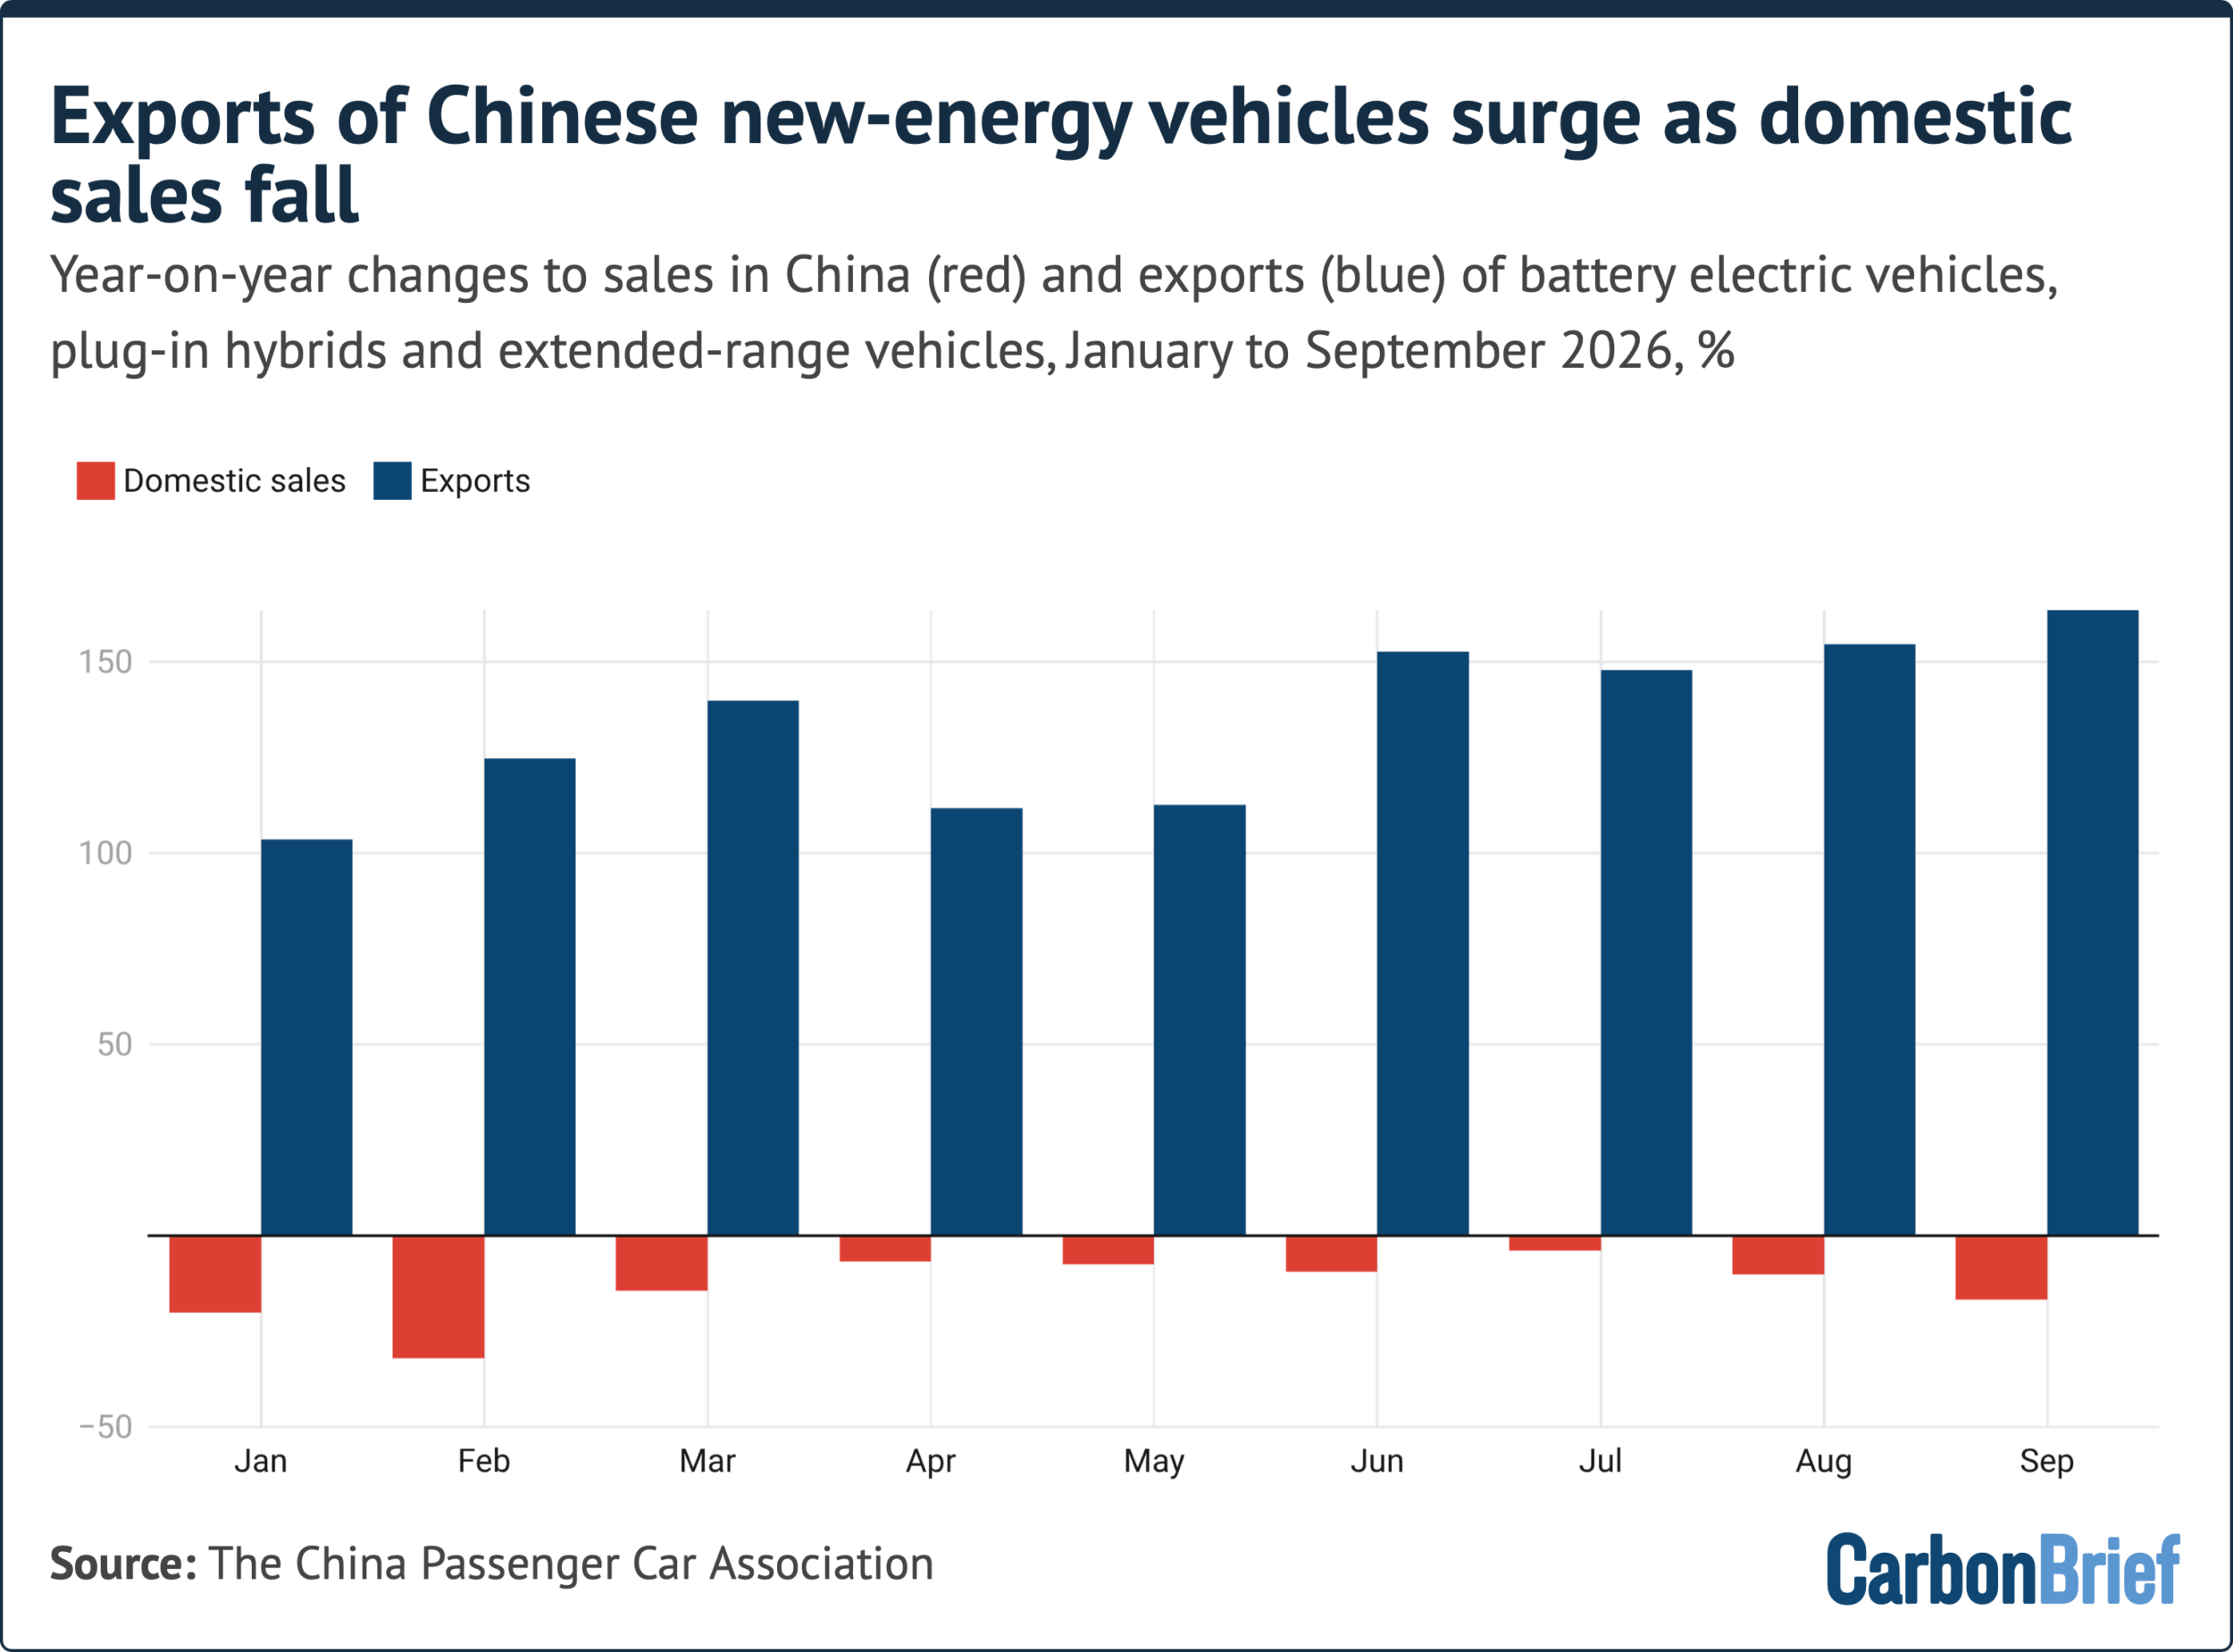
In September, 1,084,000 NEVs were sold domestically in China, while 558,000 NEVs were exported.
Exports are becoming increasingly important to Chinese carmakers, in the face of weaker domestic demand and cut-throat industrial competition.
The CPCA says exports have become "a core priority" for some carmakers.
However, the surge in exports from China has created concern in the EU, which has placed tariffs on imports of EVs from China and recently agreed plans to cut imports of hybrids.
Countries including Mexico and Turkey have also placed tariffs on Chinese EV imports.
At the same time, the Chinese government is putting policies in place that might be expected to disincentivise exports, such as cutting VAT export rebates.
Analysts differ on what impact this policy shift will have, with some saying it will be limited, while others believe it could cause the price of exported cars to rise.
Related
Interactive: What China's dozens of 'five-year plans' say about climate and energy
24.09.2026
China policy
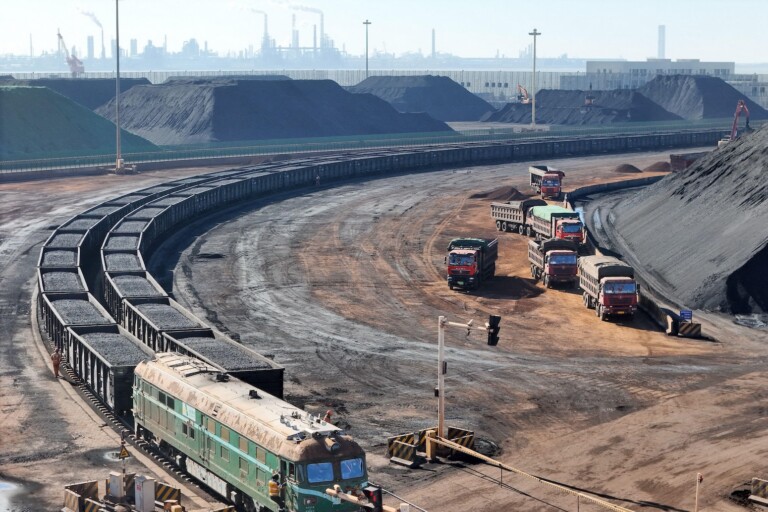 Q&A: What does China's 15th five-year plan for coal mean for climate action?
14.08.2026
China policy
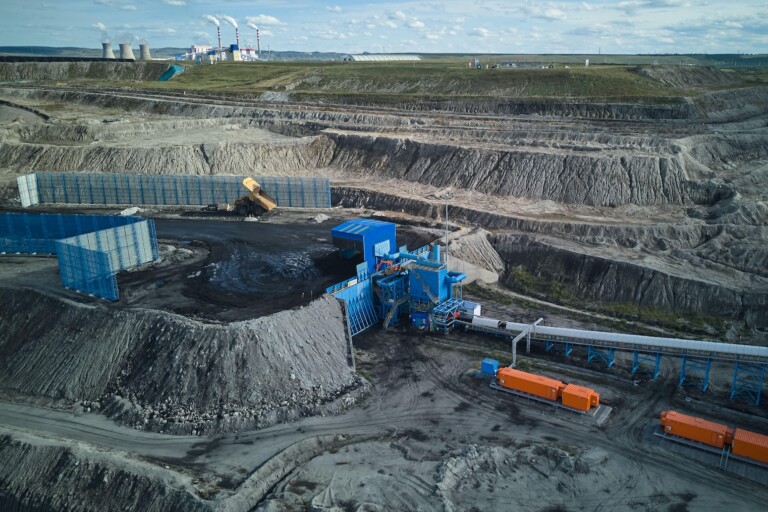 Q&A: What is in China's new five-year plan for climate change?
06.08.2026
China policy
 Q&A: What does China's 15th 'five-year plan' for renewables mean for climate change?
29.07.2026
China policy
The post Chart: A record two-thirds of car sales in China are now electric vehicles appeared first on Carbon Brief.
Artificial intelligence (AI) is developing at a rapid pace and is increasingly being used by scientists to better understand climate change.
AI is perhaps best-known for its use in "large language models", such as ChatGPT, Claude and Gemini.
However, the field is vast.
From weather forecasting to analysing satellite images, climate scientists are using various types of AI to develop faster and more efficient ways to study the warming planet.
However, the technology comes with no shortage of risks and challenges, including overreliance on unverified results, intensive energy use and exacerbating existing inequalities in climate science.
Carbon Brief spoke to 10 experts working across a range of climate-related fields - from developing climate forecasts to analysing changes in the energy grid - about how AI is being used.
Their answers are set out below, grouped by theme.
- What are the benefits and challenges of using AI in weather and climate forecasting?
- What are some other current uses of AI in climate science research?
- How is AI being used to advance climate policy and action?
- How could AI be used in climate research over the coming years?
- Are there any misconceptions about the use of AI in climate science?
- Could AI improve or exacerbate inequalities in climate research?
- What are some other risks and challenges of AI in climate change research?
- What are the benefits and challenges of using AI in weather and climate forecasting?
- What are some other current uses of AI in climate science research?
- How is AI being used to advance climate policy and action?
- How could AI be used in climate research over the coming years?
- Are there any misconceptions about the use of AI in climate science?
- Could AI improve or exacerbate inequalities in climate research?
- What are some other risks and challenges of AI in climate change research?
Dr Doug McNeall, science lead in data-driven climate modelling at the UK Met Office:
One of the most significant recent developments has been the success of AI weather-prediction models, which learn from large volumes of weather data to predict the next few hours ahead and then repeatedly feed those predictions back into themselves to generate forecasts up to two weeks into the future.
These models have demonstrated that AI can provide accurate predictions while requiring far less computing power than existing numerical models [which rely on mathematical equations to simulate the climate].
One of the main challenges is that AI weather-prediction models have been developed for relatively short timescales, where large amounts of observational data [for example, temperature, rainfall or sea ice extent data] is available and model performance can be evaluated quickly and rigorously.
Climate prediction is fundamentally different. To provide useful climate information, we need to make projections for future climates that lie outside the observational record.
One promising route forward is, therefore, to use AI to emulate or accelerate these existing models, rather than relying solely on purely data-driven approaches. This blended approach could make climate risk information far more accessible and affordable to produce, while retaining the physical understanding [based on mathematical and scientific principles] that underpins confidence in climate projections.
Prof William Collins, professor of AI for climate science at the University of East Anglia:
We're seeing a really exciting renaissance in both weather and climate science…Machine learning [a subset of AI that uses algorithms to let computers learn from data and make predictions without being explicitly programmed] has had an enormous impact on numerical weather prediction.
So, for example, the European Center for Mid-Range Weather Forecasts is now deploying an AI forecast system as part of their official communication of weather predictions to the European community, alongside the traditional forecast system. AI systems have become good enough that they're absolutely competitive with the world's leading numerical weather prediction…So that's been quite remarkable.
Much of machine learning and AI involves learning from data and climate represents a future for which we do not have data. We're literally trying to predict the future. We don't have observations of it. So, where does the data come from to inform the models? That is, at the moment, the central challenge that the climate community is attempting to overcome.
Dr Amirpasha Mozaffari, researcher in Earth artificial intelligence at the Barcelona Supercomputing Centre:
AI forecast models do well on typical weather, but underperform physics-based models on record-breaking and unprecedented extremes - precisely the events that matter most for adaptation [to climate change].
Solving that - whether through hybrid models [which combine AI with traditional models], physical constraints [in which rules are implemented based on the laws of physics to help the models make realistic forecasts] or new ways of evaluating models on what they have not seen - is the central open problem for the field.
What are some other current uses of AI in climate science research?Dr Stefano Materia, researcher in climate variability and change at the Barcelona Supercomputing Centre:
Besides the climate modelling and prediction framework, the proliferation of Earth-observation satellites has created a massive influx of geospatial data (for example, images showing deforestation or sea ice melt). AI is used to translate raw pixel data into actionable climate intelligence.
Methane tracking and ecosystem monitoring are two examples of this kind of application. Methane is a potent greenhouse gas, but leaks are largely invisible and hard to track. AI algorithms now automatically scan hyperspectral imagery [which uses data from across the electromagnetic spectrum] from satellites to pinpoint specific industrial methane leaks globally, alerting operators in near real-time.
At the same time, machine-learning models process thousands of satellite images daily to detect illegal logging, track land-use changes and monitor glacier retreat long before humans could manually review the footage.
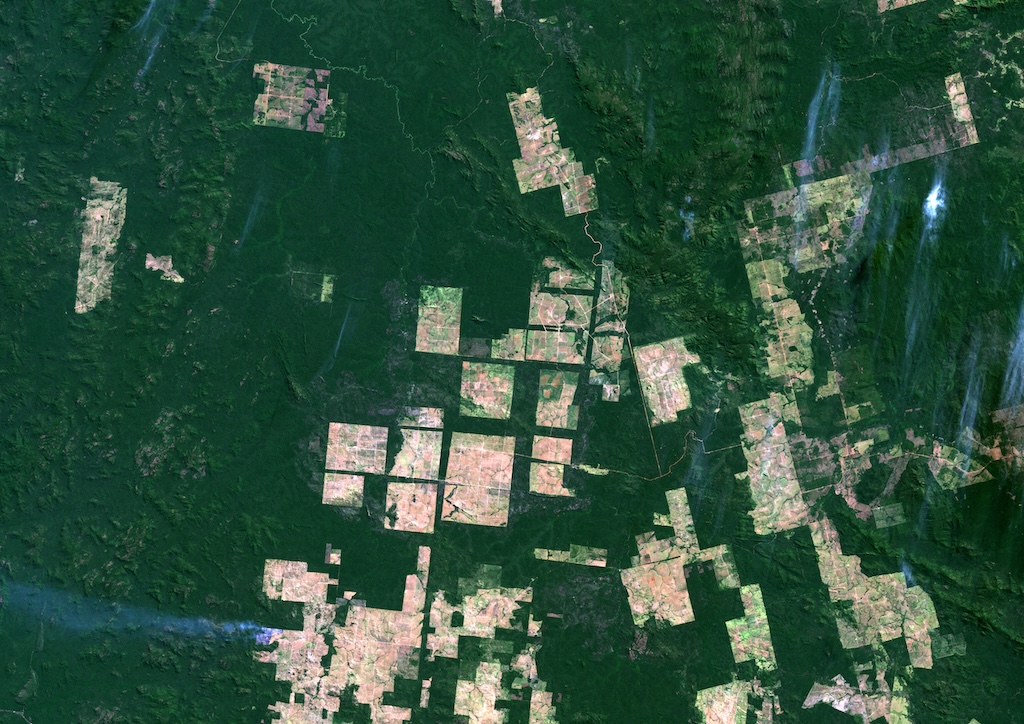 Satellite image showing deforestation in Para, Brazil. Credit: Universal Images Group North America LLC / Alamy Stock Photo
Dr Clare Eayrs, polar research scientist at the Environmental Fluid Dynamics Lab at New York University:
In sea ice research, machine learning is now used across the sea ice modelling workflow…The most mature application is extracting more information from observations, for example, mapping fine-scale sea ice deformation from ship radar and classifying snow layers in micropenetrometer profiles [which measure the hardness or softness of different layers of snow].
Forecasting is the most visible application in this field. Ice Net [a sea ice forecasting system] was an early demonstration that a deep-learning system [which uses models inspired by the layers of a human brain to process information] could outperform a leading physical model in seasonal Arctic forecasts. Machine-learning systems are now used to predict [climate] variables such as sea ice concentration, thickness and drift.
Prof Cristiana Stan, vice-chair of the World Climate Research Programme (WCRP):
AI now appears across all major parts of the WCRP. [For example,]…the "weather prediction model intercomparison project" [an initiative to create a centralised database of physics- based, machine-learning and hybrid model forecasts] includes physics-based numerical weather prediction models, hybrid [models] and AI weather prediction models. Because it is focused on operational models, the project offers a direct comparison between state-of-the art systems. [It] is intended to accelerate the deployment of the next generation of operational models and contributes to development of metrics needed to assess relative strengths and weaknesses of models.
Downscaling is another area that is harnessing AI power to refine the coarse-resolution model output into high-resolution.
Dr William Collins:
The Intergovernmental Panel on Climate Change (IPCC) is performing its seventh assessment report (AR7)…This time, for the very first time, there's a model intercomparison project just for models using AI [for weather and climate forecasting]. So that is a real milestone…It's a very exciting proof of principle or proof of concept and, I think, the harbinger of many more developments of this kind to come.
[For more on how model intercomparison will inform IPCC AR7, see Carbon Brief's recent guest post.]
Dr Amirpasha Mozaffari:
A few years ago, it took two or three years for a new architecture to make its way from the machine-learning community into weather and climate work. Today it is a matter of months: diffusion models, foundation models and generative ensembles have all arrived in our field almost as soon as they appeared elsewhere. That speed opens up things that were previously out of reach.
And the cost of running a global forecast has dropped by orders of magnitude…which, in principle, changes who can produce weather and climate information at all.
How is AI being used to advance climate policy and action?Prof Priya Donti, assistant professor at the Massachusetts Institute of Technology and co-founder of Climate Change AI:
As we introduce more solar, wind and other renewable energy into the power grid, we need to rethink how we actually manage the various sources on the power grid…
AI is used in a few different ways here. One of them is just trying to get better predictions of solar and wind power production in order to reduce that uncertainty and allow us to plan with a little more foresight.
 Wind turbines and solar panels in California. Credit: Tom Grundy / Alamy Stock Photo
Another big one is helping to actually optimise and control the various components we have on power grids - the power generators, the batteries, flexible loads like industrial loads or the batteries in your electric vehicles or heating and cooling systems.
Dr Carlos Rodriguez-Pardo, postdoctoral researcher at Politecnico di Milano, affiliated scientist at the European Institute on Economics and the Environment and at the Euro-Mediterranean Center on Climate Change:
AI is already useful at every stage of the climate policy cycle.
The first stage is measurement: understanding what is happening, what has been tried and who is exposed. Machine learning helps us process satellite imagery to estimate emissions, improve air quality monitoring, harmonise fragmented policy databases and map a scientific literature that has grown far beyond what any human team could read.
The second stage is modelling futures. The models we use to explore climate and economic scenarios are computationally very expensive, so AI-based emulators [simple models that can be used to represent more complex mathematical models] that reproduce their behaviour at a small fraction of the cost are transforming what we can do. Instead of a handful of scenarios, we can explore thousands and quantify uncertainties that were previously out of reach.
Reinforcement learning [a type of AI in which a computer programme learns to make decisions through a process of trial and error] is also allowing us to study how multiple actors, such as countries or electricity producers, compete and cooperate under different policy designs. This can reveal strategies that classical analysis misses.
The third stage is evaluation, where causal machine learning is extending the toolkit we use to answer whether a policy actually worked. That is a different - and much harder - question than predicting what will happen next.
How could AI be used in climate research over the coming years?Prof Cristiana Stan:
The WCRP has established a task team to address this very question. The focus areas considered by the task team include modelling and projections, data and observations [and AI] impacts and services, engagement with the private sector supporting development and integration of AI and machine learning into climate research and applications and the scientific rigour and trustworthiness of AI and machine learning methods.
Dr William Collins:
I think the IPCC's eighth assessment [likely due in the late 2020s] may itself largely be written using large language models. Basically, the job of the people writing the IPCC report is to synthesise…One could certainly argue whether or not that needs to be done by people. AI should be telling us the known unknowns, not the known knowns… The thing that's value-added [by AI] as part of that assessment process is to tell us what isn't certain, what isn't known well. Because then that tells you where the science should be heading.
[In September 2026, the IPCC established an "informal group" on AI to "provide timely guidance on the responsible use of AI and emerging digital technologies in IPCC processes".]
AI will also be an integral part of the eighth Coupled Model Intercomparison Project, with machine-learning codes running alongside traditional climate models.
Dr Stefano Materia:
The inclusion of AI in climate and land-vegetation modelling represents a paradigm shift. Rather than replacing physical models entirely, hybrid modelling merges the mathematical rigour and physical consistency of traditional process-based Earth system models [advanced computer models that combine physical, chemical and biological processes to simulate the climate] with the pattern-recognition power and speed of machine learning.
This new approach will be able to overcome computational bottlenecks, replace unresolved subgrid processes [which are too small to be captured by the grid cells of a computer model], improve the terrestrial biosphere - finally narrowing down the uncertainties on the terrestrial carbon sink and accurately pinpointing emergent constraints and non-linear tipping points.
Dr Clare Eayrs:
Much of what we know about Antarctic sea ice comes from the satellite era, which begins in 1979. That is a short record for a system with strong decadal variability. A great deal of information about earlier conditions is contained in ship logs, whaling records, expedition photographs and early aerial and pre-1979 satellite imagery. Machine learning is well suited to extracting it. Lengthening the observational record would improve almost everything else we do, including training and testing AI systems.
 "The Bear" whaling ship getting free from the ice pack. Credit: New Bedford Whaling Museum
Are there any misconceptions about the use of AI in climate science?
Dr David Rolnick:
AI is frequently thought of as large generative models, like [those] developed by large tech companies. But that is not mostly what is useful in AI for tackling climate change.
People talk a lot about energy usage of AI and negative impacts on society, including on the climate, as a result of that energy usage and associated negative impacts like water usage. These are very real worries. However, it is worth noting that the massive energy and other requirements of AI systems are referring to those large-scale generative and agentic systems. They're not mostly about the kinds of AI systems that are actually used to fight climate change.
Prof Priya Donti:
I think the general public thinks of AI as this one specific thing…often large language models, chatbots, etc…People who are making allocation decisions for who funds scientists might have a mismatched understanding of what needs to happen, which means the right science doesn't necessarily get funded.
Could AI improve or exacerbate inequalities in climate research?Dr Amirpasha Mozzafari:
Frontier models [which are at the cutting edge of AI research] are built almost exclusively in the global north, trained on data that is densest where observations are richest and validated against benchmarks that reflect the same regions.
Cheap inference [in which a trained AI model applies its learned patterns to new, unseen data] does not fix that on its own: being able to run someone else's model is not the same as having a say in what it is trained on, how it is evaluated, or whether it serves your decisions.
Without deliberate effort to share data infrastructure, evaluation metrics that centre on people's wellbeing and genuine co-production of knowledge, AI risks automating and amplifying the existing divide in the global climate information system rather than closing it.
#gform_wrapper_5[data-form-index="0"].gform-theme,[data-parent-form="5_0"]{--gf-color-primary: #204ce5;--gf-color-primary-rgb: 32, 76, 229;--gf-color-primary-contrast: #fff;--gf-color-primary-contrast-rgb: 255, 255, 255;--gf-color-primary-darker: #001AB3;--gf-color-primary-lighter: #527EFF;--gf-color-secondary: #fff;--gf-color-secondary-rgb: 255, 255, 255;--gf-color-secondary-contrast: #112337;--gf-color-secondary-contrast-rgb: 17, 35, 55;--gf-color-secondary-darker: #F5F5F5;--gf-color-secondary-lighter: #FFFFFF;--gf-color-out-ctrl-light: rgba(17, 35, 55, 0.1);--gf-color-out-ctrl-light-rgb: 17, 35, 55;--gf-color-out-ctrl-light-darker: rgba(104, 110, 119, 0.35);--gf-color-out-ctrl-light-lighter: #F5F5F5;--gf-color-out-ctrl-dark: #585e6a;--gf-color-out-ctrl-dark-rgb: 88, 94, 106;--gf-color-out-ctrl-dark-darker: #112337;--gf-color-out-ctrl-dark-lighter: rgba(17, 35, 55, 0.65);--gf-color-in-ctrl: #fff;--gf-color-in-ctrl-rgb: 255, 255, 255;--gf-color-in-ctrl-contrast: #112337;--gf-color-in-ctrl-contrast-rgb: 17, 35, 55;--gf-color-in-ctrl-darker: #F5F5F5;--gf-color-in-ctrl-lighter: #FFFFFF;--gf-color-in-ctrl-primary: #204ce5;--gf-color-in-ctrl-primary-rgb: 32, 76, 229;--gf-color-in-ctrl-primary-contrast: #fff;--gf-color-in-ctrl-primary-contrast-rgb: 255, 255, 255;--gf-color-in-ctrl-primary-darker: #001AB3;--gf-color-in-ctrl-primary-lighter: #527EFF;--gf-color-in-ctrl-light: rgba(17, 35, 55, 0.1);--gf-color-in-ctrl-light-rgb: 17, 35, 55;--gf-color-in-ctrl-light-darker: rgba(104, 110, 119, 0.35);--gf-color-in-ctrl-light-lighter: #F5F5F5;--gf-color-in-ctrl-dark: #585e6a;--gf-color-in-ctrl-dark-rgb: 88, 94, 106;--gf-color-in-ctrl-dark-darker: #112337;--gf-color-in-ctrl-dark-lighter: rgba(17, 35, 55, 0.65);--gf-radius: 3px;--gf-font-size-secondary: 14px;--gf-font-size-tertiary: 13px;--gf-icon-ctrl-number: url("data:image/svg+xml,%3Csvg width='8' height='14' viewBox='0 0 8 14' fill='none' xmlns='http://www.w3.org/2000/svg'%3E%3Cpath fill-rule='evenodd' clip-rule='evenodd' d='M4 0C4.26522 5.96046e-08 4.51957 0.105357 4.70711 0.292893L7.70711 3.29289C8.09763 3.68342 8.09763 4.31658 7.70711 4.70711C7.31658 5.09763 6.68342 5.09763 6.29289 4.70711L4 2.41421L1.70711 4.70711C1.31658 5.09763 0.683417 5.09763 0.292893 4.70711C-0.0976311 4.31658 -0.097631 3.68342 0.292893 3.29289L3.29289 0.292893C3.48043 0.105357 3.73478 0 4 0ZM0.292893 9.29289C0.683417 8.90237 1.31658 8.90237 1.70711 9.29289L4 11.5858L6.29289 9.29289C6.68342 8.90237 7.31658 8.90237 7.70711 9.29289C8.09763 9.68342 8.09763 10.3166 7.70711 10.7071L4.70711 13.7071C4.31658 14.0976 3.68342 14.0976 3.29289 13.7071L0.292893 10.7071C-0.0976311 10.3166 -0.0976311 9.68342 0.292893 9.29289Z' fill='rgba(17, 35, 55, 0.65)'/%3E%3C/svg%3E");--gf-icon-ctrl-select: url("data:image/svg+xml,%3Csvg width='10' height='6' viewBox='0 0 10 6' fill='none' xmlns='http://www.w3.org/2000/svg'%3E%3Cpath fill-rule='evenodd' clip-rule='evenodd' d='M0.292893 0.292893C0.683417 -0.097631 1.31658 -0.097631 1.70711 0.292893L5 3.58579L8.29289 0.292893C8.68342 -0.0976311 9.31658 -0.0976311 9.70711 0.292893C10.0976 0.683417 10.0976 1.31658 9.70711 1.70711L5.70711 5.70711C5.31658 6.09763 4.68342 6.09763 4.29289 5.70711L0.292893 1.70711C-0.0976311 1.31658 -0.0976311 0.683418 0.292893 0.292893Z' fill='rgba(17, 35, 55, 0.65)'/%3E%3C/svg%3E");--gf-icon-ctrl-search: url("data:image/svg+xml,%3Csvg width='640' height='640' xmlns='http://www.w3.org/2000/svg'%3E%3Cpath d='M256 128c-70.692 0-128 57.308-128 128 0 70.691 57.308 128 128 128 70.691 0 128-57.309 128-128 0-70.692-57.309-128-128-128zM64 256c0-106.039 85.961-192 192-192s192 85.961 192 192c0 41.466-13.146 79.863-35.498 111.248l154.125 154.125c12.496 12.496 12.496 32.758 0 45.254s-32.758 12.496-45.254 0L367.248 412.502C335.862 434.854 297.467 448 256 448c-106.039 0-192-85.962-192-192z' fill='rgba(17, 35, 55, 0.65)'/%3E%3C/svg%3E");--gf-label-space-y-secondary: var(--gf-label-space-y-md-secondary);--gf-ctrl-border-color: #686e77;--gf-ctrl-size: var(--gf-ctrl-size-md);--gf-ctrl-label-color-primary: #112337;--gf-ctrl-label-color-secondary: #112337;--gf-ctrl-choice-size: var(--gf-ctrl-choice-size-md);--gf-ctrl-checkbox-check-size: var(--gf-ctrl-checkbox-check-size-md);--gf-ctrl-radio-check-size: var(--gf-ctrl-radio-check-size-md);--gf-ctrl-btn-font-size: var(--gf-ctrl-btn-font-size-md);--gf-ctrl-btn-padding-x: var(--gf-ctrl-btn-padding-x-md);--gf-ctrl-btn-size: var(--gf-ctrl-btn-size-md);--gf-ctrl-btn-border-color-secondary: #686e77;--gf-ctrl-file-btn-bg-color-hover: #EBEBEB;--gf-field-img-choice-size: var(--gf-field-img-choice-size-md);--gf-field-img-choice-card-space: var(--gf-field-img-choice-card-space-md);--gf-field-img-choice-check-ind-size: var(--gf-field-img-choice-check-ind-size-md);--gf-field-img-choice-check-ind-icon-size: var(--gf-field-img-choice-check-ind-icon-size-md);--gf-field-pg-steps-number-color: rgba(17, 35, 55, 0.8);} CommentsThis field is for validation purposes and should be left unchanged.Free fortnightly newsletter
.preheader p{ margin-top: 0; font-family: 'PT Sans', sans-serif; font-weight: var(--type--3--font-weight--bold); color: var(--button--color); font-size: var(--button--font-size, inherit); }
.newsletter-inline{
display: flex;
border: solid 1px #333333;
padding: 1em;
background: #ffffff;
}
.inline-email{
display:inline-block;
margin-right:1em;
margin-top:0 !important;
margin-bottom:0.5em;
}
#field_submit{
display:inline-block;
margin-top:0 !important;
}
.gform_wrapper .gfield+.gfield{
margin-top:0
}
Email
gform.initializeOnLoaded( function() {gformInitSpinner( 5, 'https://www.carbonbrief.org/wp-content/plugins/gravityforms/images/spinner.svg', false );jQuery('#gform_ajax_frame_5').on('load',function(){var contents = jQuery(this).contents().find('*').html();var is_postback = contents.indexOf('GF_AJAX_POSTBACK') >= 0;if(!is_postback){return;}var form_content = jQuery(this).contents().find('#gform_wrapper_5');var is_confirmation = jQuery(this).contents().find('#gform_confirmation_wrapper_5').length > 0;var is_redirect = contents.indexOf('gformRedirect(){') >= 0;var is_form = form_content.length > 0 && ! is_redirect && ! is_confirmation;var mt = parseInt(jQuery('html').css('margin-top'), 10) + parseInt(jQuery('body').css('margin-top'), 10) + 100;if(is_form){jQuery('#gform_wrapper_5').html(form_content.html());if(form_content.hasClass('gform_validation_error')){jQuery('#gform_wrapper_5').addClass('gform_validation_error');} else {jQuery('#gform_wrapper_5').removeClass('gform_validation_error');}setTimeout( function() { /* delay the scroll by 50 milliseconds to fix a bug in chrome */ jQuery(document).scrollTop(jQuery('#gform_wrapper_5').offset().top - mt); }, 50 );if(window['gformInitDatepicker']) {gformInitDatepicker();}if(window['gformInitPriceFields']) {gformInitPriceFields();}var current_page = jQuery('#gform_source_page_number_5').val();gformInitSpinner( 5, 'https://www.carbonbrief.org/wp-content/plugins/gravityforms/images/spinner.svg', false );jQuery(document).trigger('gform_page_loaded', [5, current_page]);window['gf_submitting_5'] = false;}else if(!is_redirect){var confirmation_content = jQuery(this).contents().find('.GF_AJAX_POSTBACK').html();if(!confirmation_content){confirmation_content = contents;}jQuery('#gform_wrapper_5').replaceWith(confirmation_content);jQuery(document).scrollTop(jQuery('#gf_5').offset().top - mt);jQuery(document).trigger('gform_confirmation_loaded', [5]);window['gf_submitting_5'] = false;wp.a11y.speak(jQuery('#gform_confirmation_message_5').text());}else{jQuery('#gform_5').append(contents);if(window['gformRedirect']) {gformRedirect();}}jQuery(document).trigger("gform_pre_post_render", [{ formId: "5", currentPage: "current_page", abort: function() { this.preventDefault(); } }]); if (event && event.defaultPrevented) { return; } const gformWrapperDiv = document.getElementById( "gform_wrapper_5" ); if ( gformWrapperDiv ) { const visibilitySpan = document.createElement( "span" ); visibilitySpan.id = "gform_visibility_test_5"; gformWrapperDiv.insertAdjacentElement( "afterend", visibilitySpan ); } const visibilityTestDiv = document.getElementById( "gform_visibility_test_5" ); let postRenderFired = false; function triggerPostRender() { if ( postRenderFired ) { return; } postRenderFired = true; gform.core.triggerPostRenderEvents( 5, current_page ); if ( visibilityTestDiv ) { visibilityTestDiv.parentNode.removeChild( visibilityTestDiv ); } } function debounce( func, wait, immediate ) { var timeout; return function() { var context = this, args = arguments; var later = function() { timeout = null; if ( !immediate ) func.apply( context, args ); }; var callNow = immediate && !timeout; clearTimeout( timeout ); timeout = setTimeout( later, wait ); if ( callNow ) func.apply( context, args ); }; } const debouncedTriggerPostRender = debounce( function() { triggerPostRender(); }, 200 ); if ( visibilityTestDiv && visibilityTestDiv.offsetParent === null ) { const observer = new MutationObserver( ( mutations ) => { mutations.forEach( ( mutation ) => { if ( mutation.type === 'attributes' && visibilityTestDiv.offsetParent !== null ) { debouncedTriggerPostRender(); observer.disconnect(); } }); }); observer.observe( document.body, { attributes: true, childList: false, subtree: true, attributeFilter: [ 'style', 'class' ], }); } else { triggerPostRender(); } } );} );
Dr Carlos Rodriguez-Pardo:
If done well, [developing AI-based Earth system models] could dramatically lower barriers to entry. A small research group, or an agency in a data-poor region, could adapt a pre-trained model on modest hardware rather than building bespoke systems from scratch. That matters because [the] data is thinnest and the resolution gap is largest exactly where vulnerability to climate [change] is highest.
Dr David Rolnick, associate professor in the school of computer science at McGill University and cofounder of Climate Change AI:
Climate action should fundamentally be about democratisation of action and equitable response to climate change, both in terms of mitigation and in terms of adaptation. The consolidation of large-scale AI can often work counter to those goals by consolidating power in certain geographies and stakeholders, and by defining action based upon the goals of those stakeholders.
When you build technology in specific institutions, they do not necessarily understand the needs of the majority of the world's population or local stakeholders from other geographies and other entities.
What are some other risks and challenges of AI in climate change research?Dr Clare Eayrs:
The biggest challenge is trust…Good performance is necessary, but it is not enough. We also need independent evaluation, physical credibility, process-based validation, robustness and some degree of interpretability.
The risk I worry about most is that the apparent success of these systems could be read as a reason to invest less on observations. AI is not a substitute for observation, physical understanding or careful evaluation. Especially for Antarctic sea ice, where observations of sea ice and snow thickness remain sparse and understanding of snow-ice processes remains limited, we need more, targeted observations, not fewer. It also makes the case for documenting them - and their uncertainties - far better than we do now.
Dr William Collins:
The challenge is always making sure that you're getting the right answer for the right reason and the risk is getting a plausible answer that is "truthy", but not the truth…Ask a computer for an answer and it will give you one. And it's very good. It will always obey. It will always give you an answer. The question is whether or not that answer is valid or not.
Dr David Rolnick:
The first and foremost risk is AI diverging attention from other forms of climate action. AI is not a silver bullet. It is not an answer in itself. And where it is useful, it is only one part of the solution.
Prof Detlef van Vuuren, a senior researcher at the PBL Netherlands Environmental Assessment Agency [in a 2026 Carbon Brief interview]:
There are now many more proposals being submitted than in the past, as people can use AI tools. So our science discipline has to start learning how to deal with this, both in terms of what we feel is allowed in creating [scientific] articles - what is allowed in reviewing [and] what is allowed in proposal writing. This is something that we have to learn.
Dr William Collins:
The partnership between academia, the data centres and private industry is going to be integral to our success going forward. And I think the challenge is going to be navigating that relationship in a way that respects open science, uses open source code, etc…
You do not want to be in a situation where we have something like a large language model where it's not open source…[We need] fairness, accountability, transparency and explainability.
Dr Carlos Rodriguez-Pardo:
High-resolution outputs can look exact when they are not; uncertainties compound in invisible ways and predictions that feed into policy need honest, well-calibrated uncertainty estimates, communicated in decision-relevant terms.
Like any other technology, AI should augment human judgement in climate decisions, not replace it. As researchers, it is our responsibility to ensure the field serves as a force for social progress.
Related
Explainer: The CMIP7 emissions scenarios - and how they explore future climate change
01.09.2026
Climate modelling
 Guest post: How CMIP7 will shape the next wave of climate science
22.05.2026
Climate modelling
 Traditional models still 'outperform AI' for extreme weather forecasts
29.04.2026
Climate modelling
 Limiting global warming to 2C would not 'rule out' extreme impacts
25.03.2026
Climate modelling
The post Experts: How are climate scientists using artificial intelligence? appeared first on Carbon Brief.
A surge in wholesale costs driven by expensive gas is responsible for nearly 90% of the rise in UK household electricity bills since 2020, reveals new analysis.
The figures, shared with Carbon Brief by thinktank Nesta, show that wholesale gas costs are also behind the vast majority (77%) of the increase in household gas bills.
The analysis firmly contradicts the idea, which has become embedded in UK media and political narratives, that the UK's net-zero target is to blame for high energy bills.
Andrew Sissons, director for sustainable future at Nesta, tells Carbon Brief that net-zero is, in fact, "helping to shelter Britain from the impact of expensive gas". He adds:
"Rising gas prices, not net-zero, have driven most of the recent surge in Britain's energy bills. Britain is particularly exposed, with over 80% of households connected to gas mains, while our electricity system still relies too much on gas as the marginal unit."
The analysis comes after the UK government gave its approval for the Jackdaw gas field to be developed in the North Sea, despite stating that it "would not…affect prices".
Another gas crisisIn January 2026, Carbon Brief reported that two-thirds of the rise in electricity bills since before the 2022 global energy crisis was due to high gas prices.
Now, amid ongoing conflict in the Middle East, wholesale gas prices are at their highest levels since Russia's 2022 invasion of Ukraine.
Indeed, as of 19 October, UK wholesale gas prices stood at 220p per therm (£75 per megawatt hour, MWh), above the average for 2022 of 210p/therm (£72/MWh).
The figure below shows that, after accounting for inflation, typical UK annual household electricity bills had risen £180 by the fourth quarter of 2026, relative to the same period in 2020.
Some 90% of this increase (£161) is due to wholesale costs, driven by the price of gas.
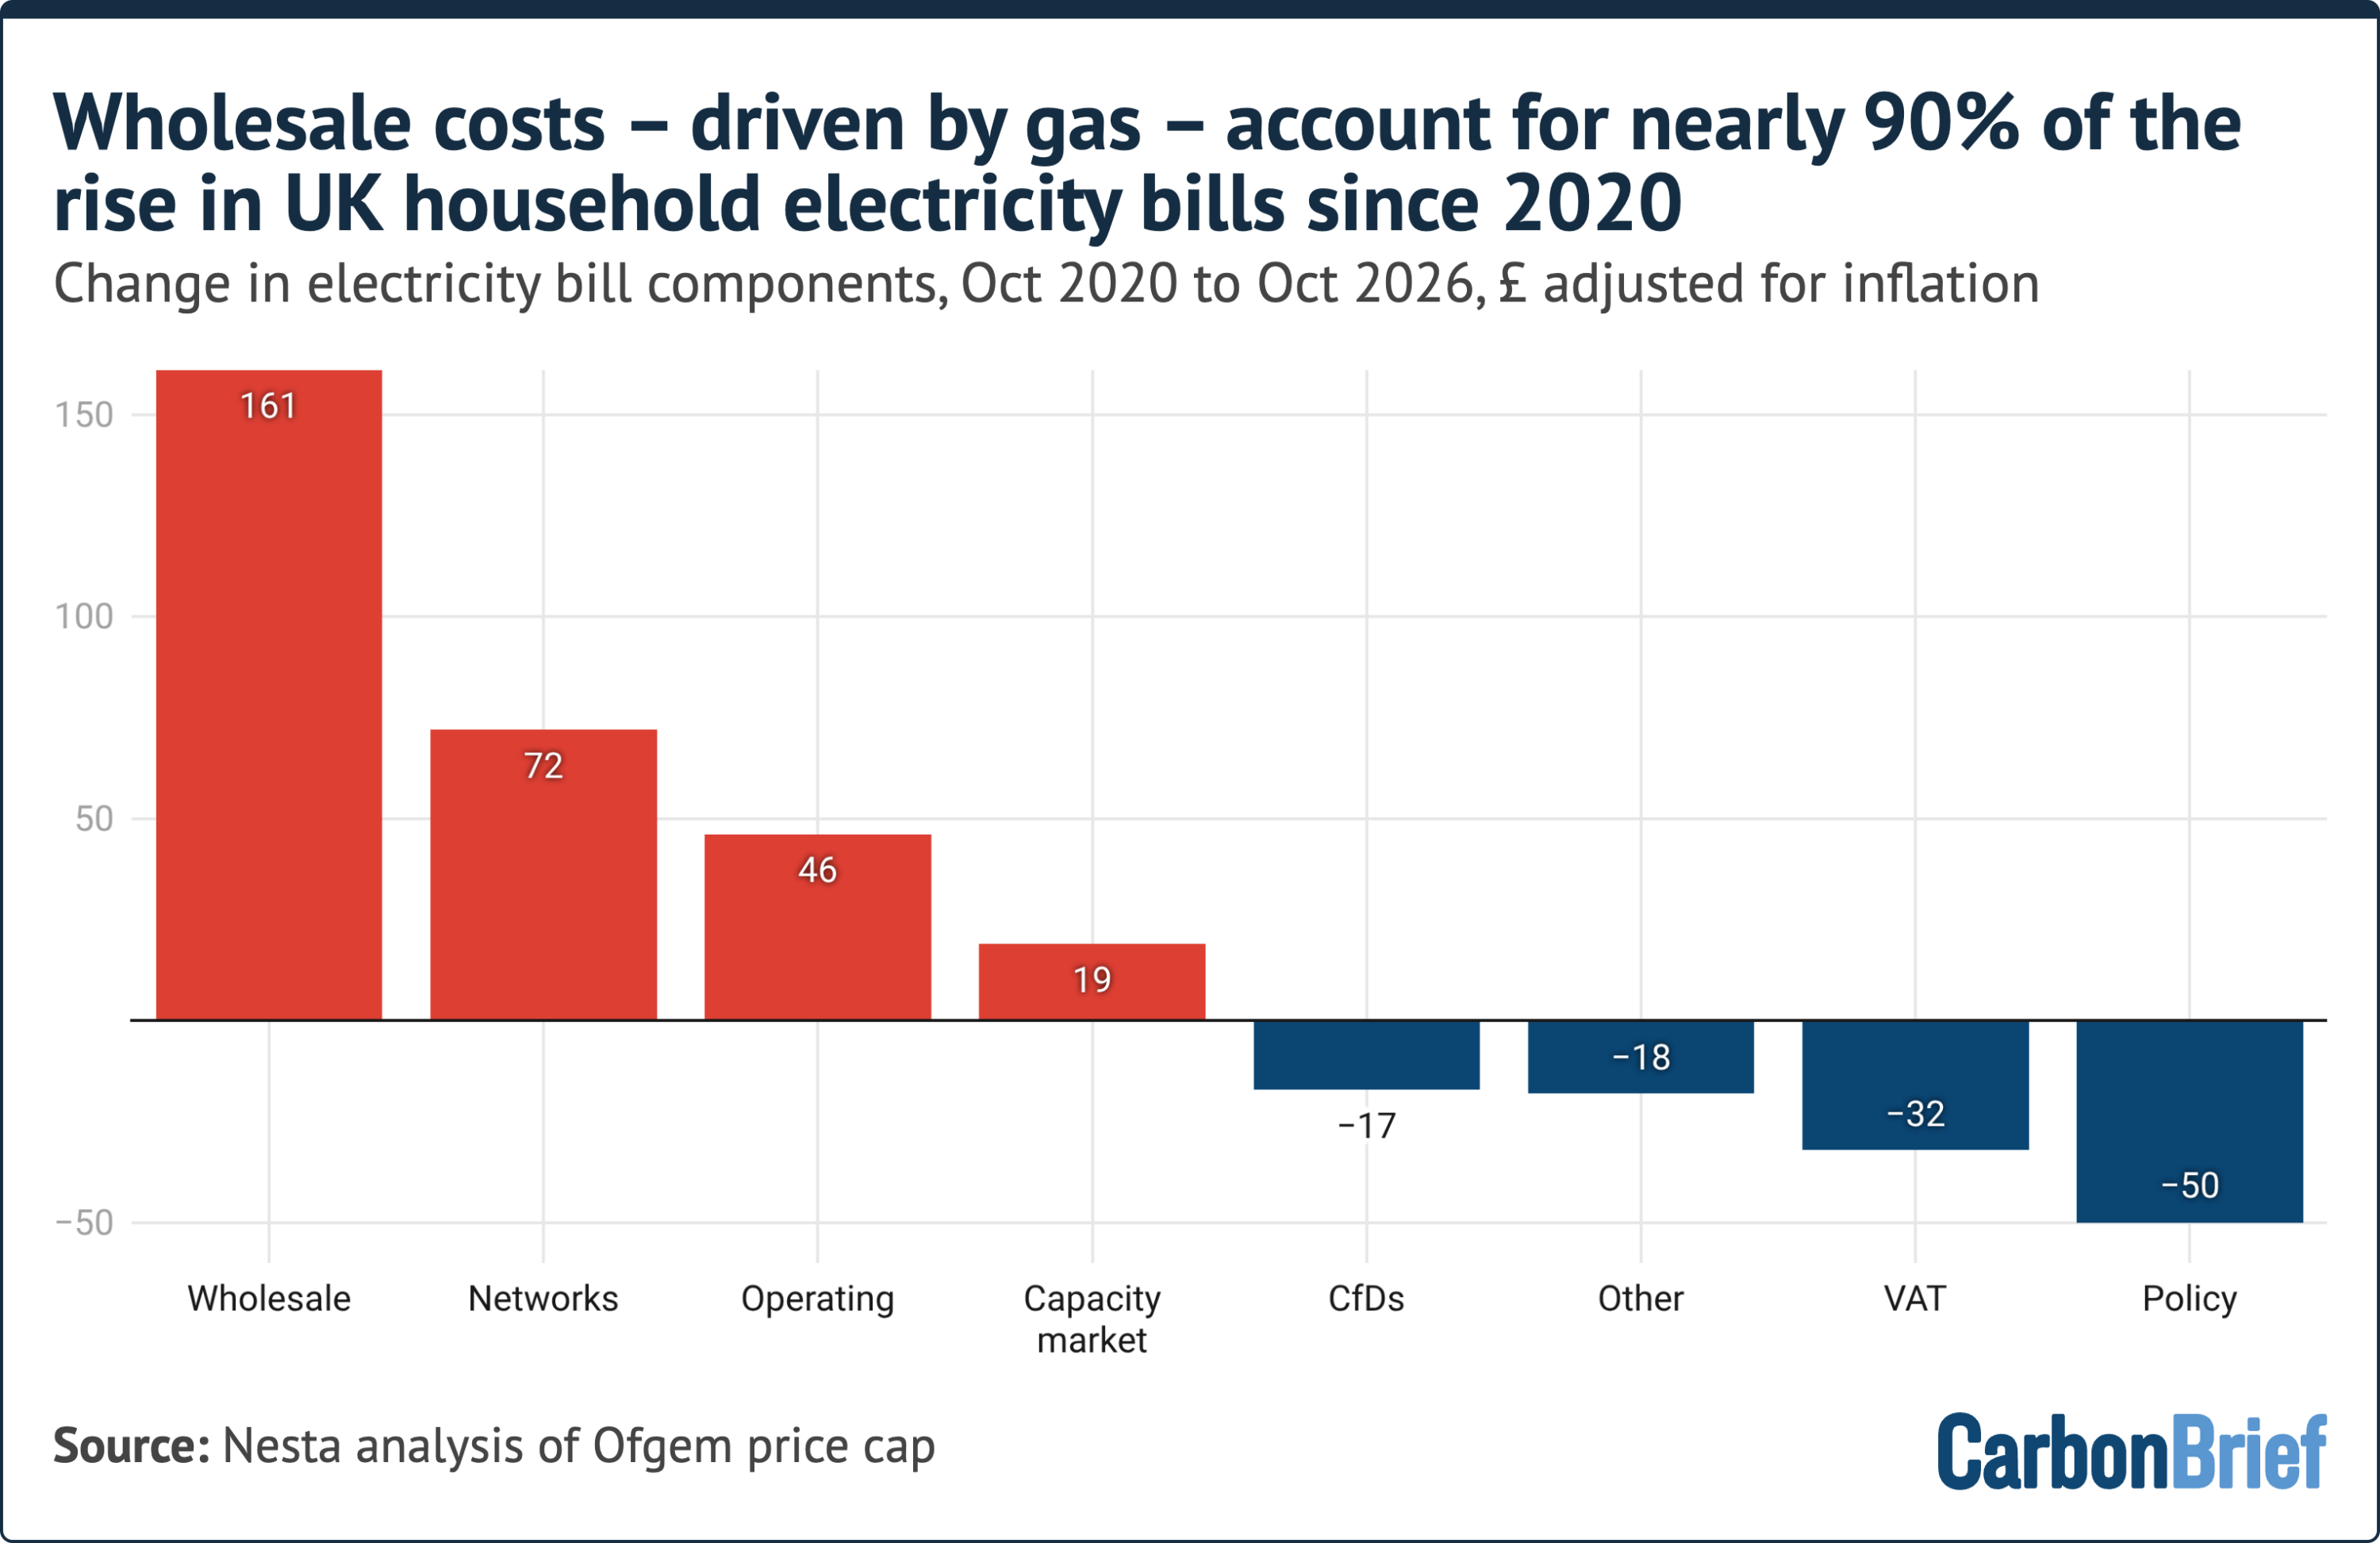
In contrast - and contrary to widespread perceptions - renewable "contracts for difference" (CfDs) are reducing electricity bills by £17 under the current price cap, according to the Nesta analysis.
In addition, the government has cut policy costs for electricity by moving 75% of legacy renewable support onto general taxation, ending the "ECO" efficiency scheme and temporarily removing VAT.
Network costs have added £72 to typical bills since 2020, according to Nesta. Most of this (£46) is for investment in the electricity transmission network, known as the "motorways" of the grid.
Only £21 of the rise in network costs relates to balancing the system, including "constraint payments" for turning off windfarms - and turning on gas plants - due to insufficient grid capacity.
Wind constraint payments regularly receive extensive news coverage, despite balancing costs - in total - making up just £35 (4%) of a typical £858 annual household electricity bill.
The Nesta figures show energy supplier operating costs have gone up by £46 since 2020. These costs are not broken down in the underlying Ofgem figures, but the increase is thought to be driven by the cost of rising household energy debt. Supplier profits are capped at 2.5% of bills.
Breaking the linkNotably, household electricity prices have increased far less rapidly since the Hormuz crisis than gas bills, with higher clean-energy generation helping break the link between the two.
Since 2020, household gas bills have increased by £368 in real terms, according to Nesta's analysis. Some 77% of this (£283) is due to wholesale gas costs.
After accounting for inflation, total dual-fuel bills for a typical household have increased from £1,175 per year in October 2020 to £1,723 per year in October 2026, a rise of 47%.
The rise in wholesale costs driven by high gas prices accounts for £444 (81%) of this increase in real terms, as shown in the figure below.
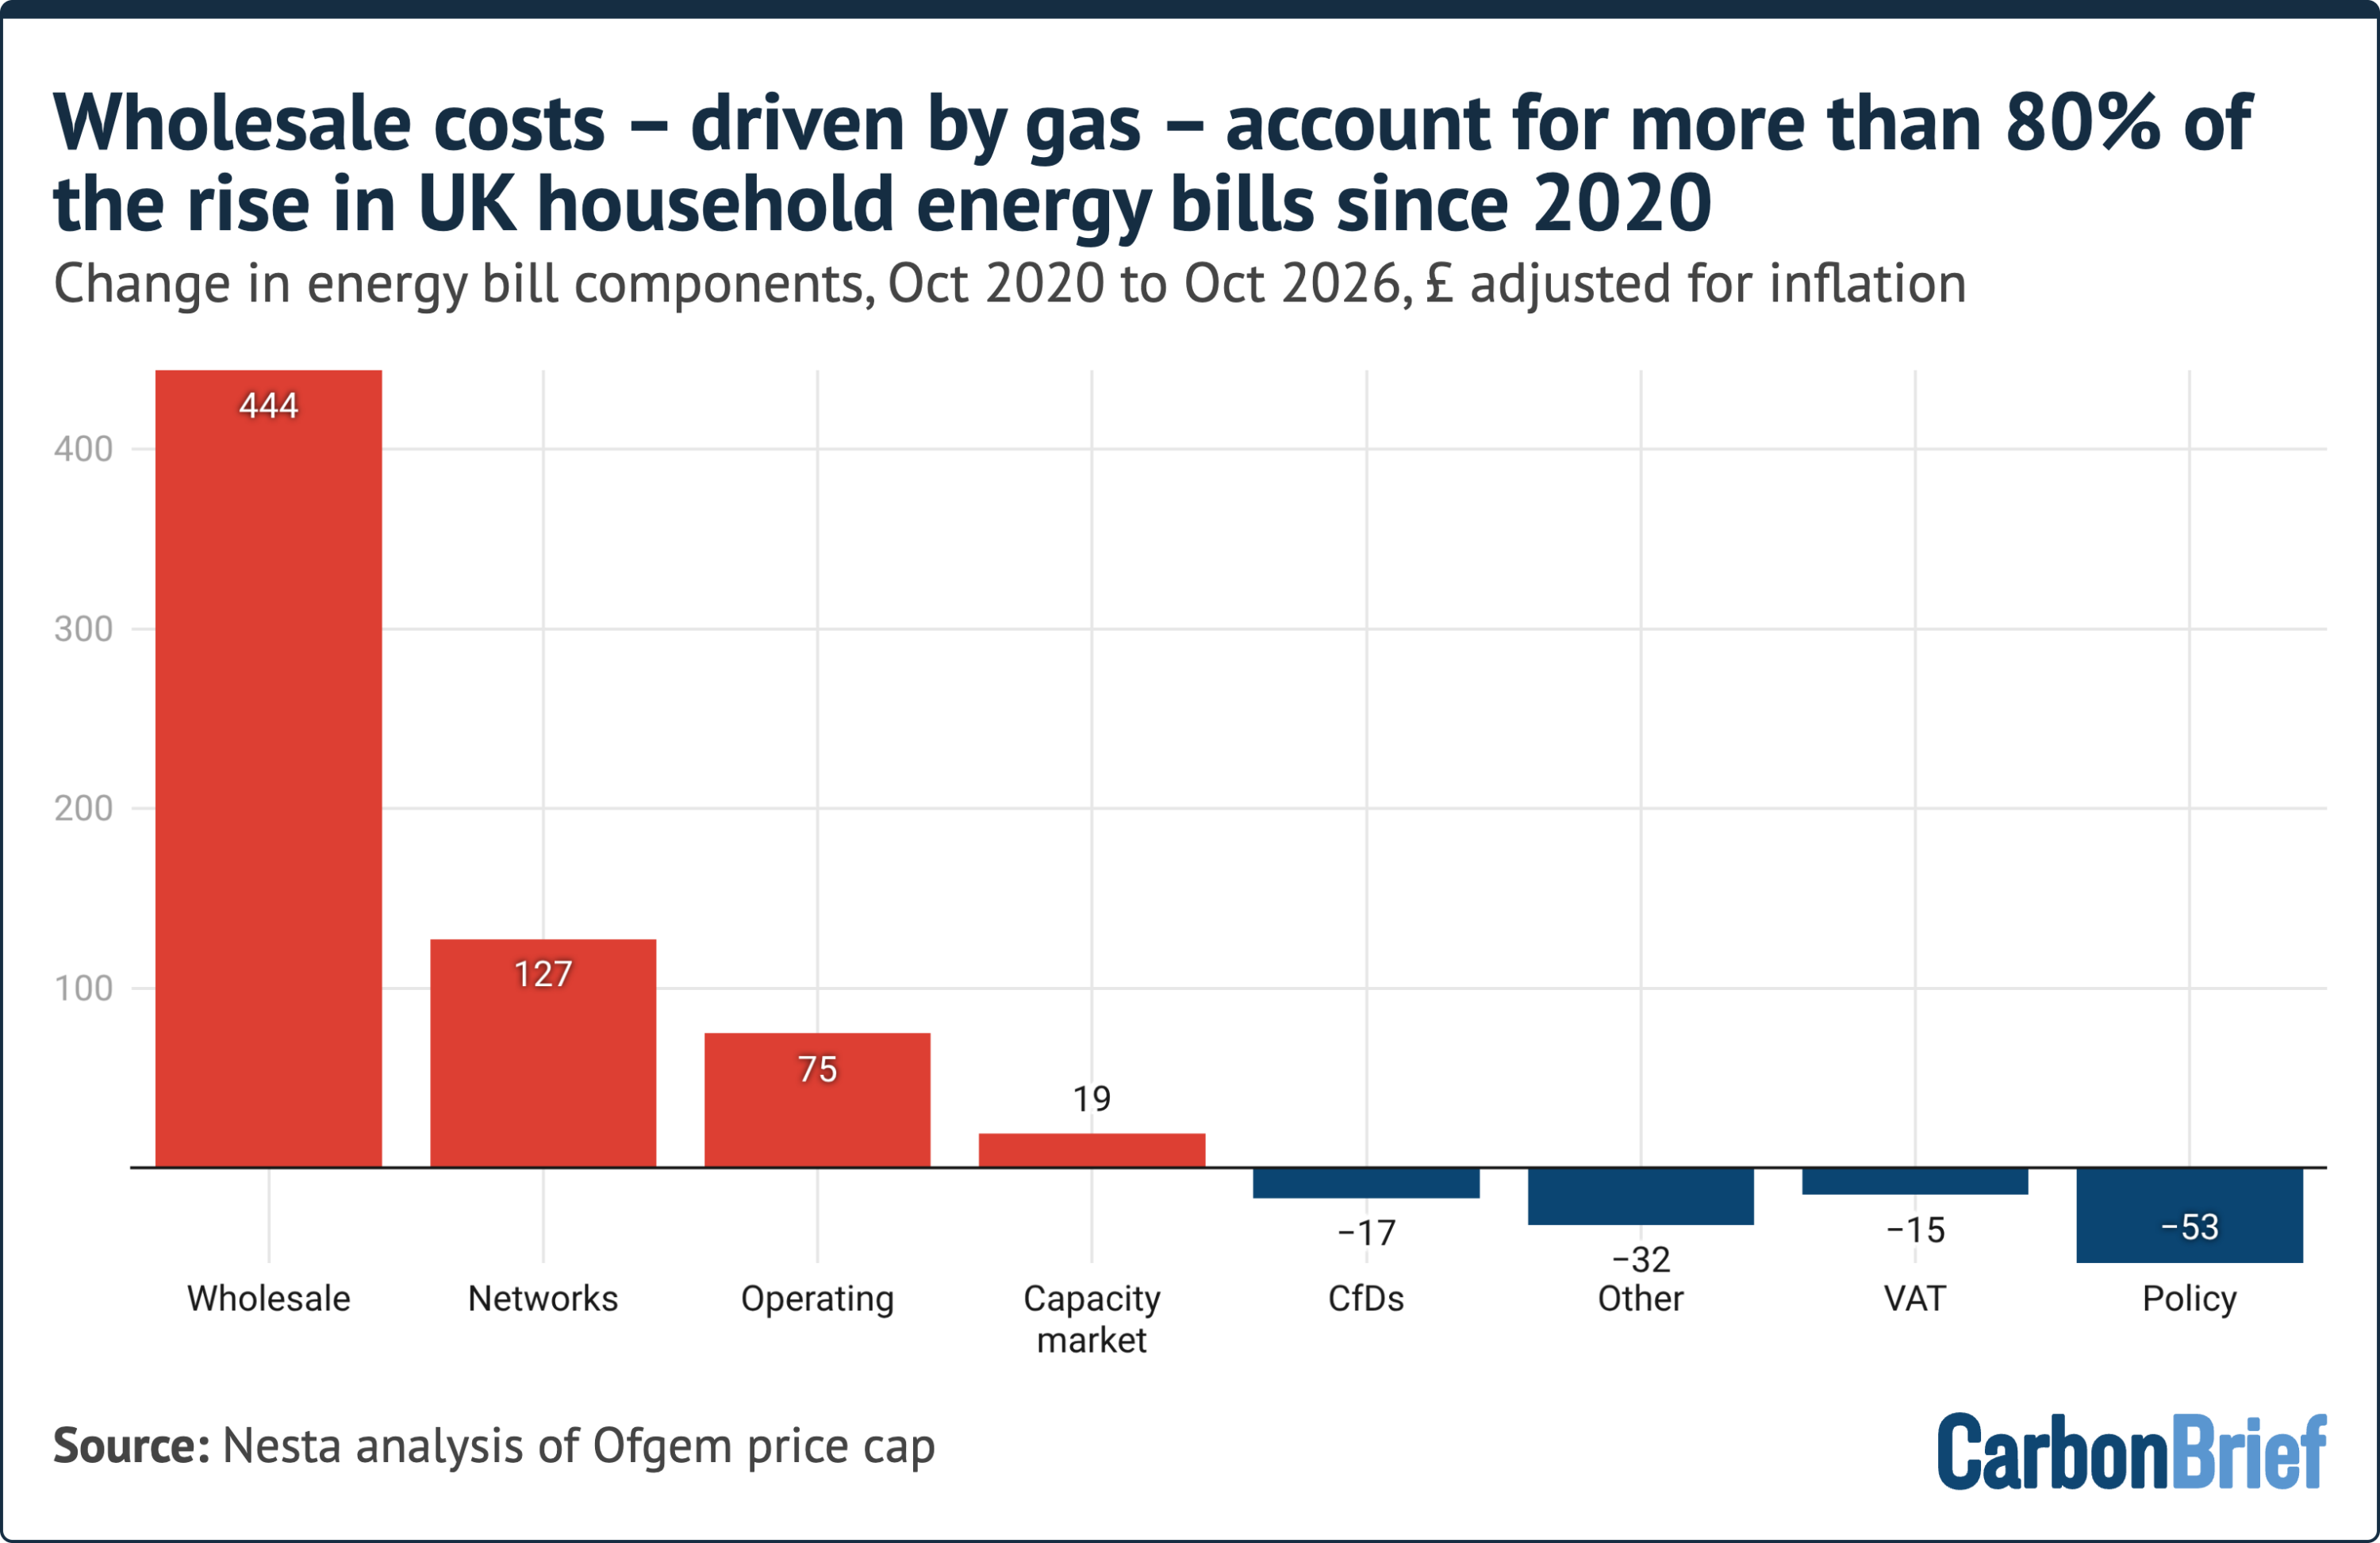
The £127 real-terms rise in network costs includes £72 for electricity transmission, distribution and balancing, as well as £55 for investment in the gas grid.
(According to the Energy Networks Association, up to 80% of the investment in electricity grids is required to maintain existing assets, with the remainder going towards expansion for net-zero.)
In total, the cost of government social and climate policies made up £183 (16%) of typical dual-fuel bills in October 2020. This had fallen to £114 (7%) as of the current October 2026 price cap.
Wholesale costs make up the largest share of the current cap, at £757 (44%). Network costs are the second-largest component of bills, at £417 (24%), followed by operating costs at £291 (17%).
Sissons tells Carbon Brief:
"Upgrading the grid is not cost-neutral, but that price tag is dwarfed by the impact of rising gas prices. In fact, net-zero is helping to shelter Britain from the impact of expensive gas. Since the start of the Iran war, electricity bills have begun to decouple from gas bills, thanks to the UK's increased renewable power and support from contracts for difference."
"Going further will require British households to have clean electricity, electric vehicles and heat pumps over fossil-fuel cars and boilers. By focusing on growing electricity demand, the government can spread upgrade costs more widely. This can lock in the consistent investment in electrification that is Britain's best path to stop global turmoil showing up on winter energy bills."
Related
Factcheck: UK Conservatives double the 'cost of net-zero' after spreadsheet blunder
09.10.2026
UK policy
 Analysis: Wind and solar save UK from gas imports worth £5.9bn during Hormuz crisis
30.09.2026
Energy
 Analysis: EVs are now nine times cheaper than petrol or diesel to drive in the UK
24.09.2026
Oil and gas
 CCC: Heathrow expansion could push flights to '80% of UK emissions by 2050'
16.09.2026
Emissions
The post Revealed: Expensive gas behind 'nearly 90%' of rise in UK electricity bills appeared first on Carbon Brief.
A temporary breach of the 1.5C global-warming limit is now "inevitable" following "decades of insufficient climate action", says the UN Environment Programme (UNEP).
In its "sobering" annual assessment of the global "emissions gap", UNEP says that exceeding the Paris Agreement's 1.5C limit is "imminent and unavoidable".
This year's report, titled "The point of return", says the "task now" is to minimise the size and scale of a temperature "overshoot" and to "establish a credible return path to 1.5C by the end of the century".
Even the "lowest possible" overshoot scenario for 1.5C would first see global warming peak at around 1.7-1.8C in the middle of the century before declining, says the report.
This scenario - which is "still aligned with the long-term temperature goal of the Paris Agreement" - would require global emissions cuts of 18% by 2030 and 45% by 2035, while ramping up "removals" of carbon dioxide (CO2) from the atmosphere, says UNEP.
In contrast, it notes that the current climate pledges by countries around the world - even if fully implemented - would only reduce emissions by 5-8% by 2030 and 11-15 % by 2035, relative to 2025 levels.
Nonetheless, the report identifies "ample opportunity to accelerate action", concluding that "countries can still limit peak warming, shorten the duration of overshoot and keep the goals of the Paris Agreement within reach".
(See Carbon Brief's detailed coverage of previous reports in 2014, 2015, 2016, 2017, 2018, 2019, 2020, 2021, 2022, 2023, 2024 and 2025.)
Article Contents Expand menu- Emissions 'comparable' between 2024 and 2025
- New NDCs would reduce emissions 'far from what is needed'
- Emissions gap is 'still large'
- Every five years of delay will add 0.1C
- 'Uneven and insufficient' progress towards global stocktake
The report says that emissions in 2025 were "comparable" to those of 2024.
Global greenhouse gas emissions in 2025 totalled 58.4bn tonnes of CO2 equivalent (GtCO2e), according to the report. This is around 0.16GtCO2e lower than 2024 levels - albeit, with high levels of uncertainty around the numbers.
In addition, because the figures presented in the 2025 report are "provisional", the report says, it is "not possible to conclude on the overall direction of emissions in 2025".
The emissions growth rate has been slowing down in recent decades: the growth rate over 1990-2015 was, on average, 1.7% per year, while emissions have increased by an average of 0.8% per year since 2016.
The chart below shows the total human-driven emissions between 1990 and 2025, separated by greenhouse gas: CO2 from fossil-fuel combustion (dark grey), methane (light grey), nitrous oxide (blue), fluorinated gases (orange) and CO2 from land-use change (green).
 Credit: UNEP emissions gap report (2026)
Compared to 2024, emissions from fossil fuels increased slightly, by between 0.4-1.1%, says the report. Emissions of both nitrous oxide and fluorinated gases increased by even higher rates, but since these comprise such a small part of total greenhouse gas emissions, "their contribution to the overall trend is relatively less significant", it adds. Methane emissions remained steady over that time.
A reduction in the CO2 emissions from land use, land-use change and forestry (LULUCF) "slightly overcompensates" for the rise in emissions of fossil-fuel CO2 and other gases, according to the report. (For more on falling land-use emissions, see Carbon Brief's explainer.)
The decrease in LULUCF emissions was "partially driven" by a decline in global wildfire emissions, particularly in Africa, South America and parts of south-east Asia. The report notes that these decreases were "likely connected to the ceasing of El Niño conditions". The ongoing "super" El Niño is likely to cause LULUCF emissions to increase in 2026.
The report also examines countries' contributions to the increase in greenhouse gas emissions - although here, it excludes LULUCF due to a lag in national-level emissions inventories for the sector.
Among the top six emitters, only the US saw a notable increase in 2025, says the report, whereas emissions in China, the EU, India, Russia and Indonesia were relatively flat. Emissions in the US grew by 133m tonnes of CO2e (MtCO2e) in 2025, due to increased electricity demand and a "rebound" of coal power. This growth in US emissions is likely due to a combination of market factors, including increased heating demand due to a colder winter, higher gas prices and overall increased electricity demand.
The changes for the six largest emitters, the rest of the G20 countries, international transport and the rest of the world can be seen in the chart below.
 Credit: UNEP emissions gap report (2026)
Across most sectors, progress towards decarbonisation has been "modest", says the report. The most notable decreases have occurred in the power sector and the transport sector, due to the growth of solar power and electric vehicles. The report notes:
"There are emerging signs of transport sector electrification and decarbonisation, but at rates and levels that are not yet sufficient to drive emissions reductions at the global level."
However, emissions from the transport sector have continued to grow, due to increased demand for international aviation and shipping.
The report notes that while electricity demand from data centres is "projected to double" by 2030, data centres at present account for less than 1% of total emissions.
New NDCs would reduce emissions 'far from what is needed'All countries were meant to submit new UN climate pledges for 2035, known as the third nationally determined contributions (NDCs) to the Paris Agreement, by February 2025. However, 95% of nations missed this deadline.
Many countries came forward with their third NDCs at a UN climate summit in New York in September 2025 and at the COP30 climate summit in Brazil in November 2025.
By the end of COP30, 122 - or 63% - of countries had produced their third NDCs.
The report says that figure had risen to 124 by 1 September 2026, with pledges now covering 75% of global emissions.
This is more than double the number of third NDCs available at the time of the 2025 emissions gap report - allowing a "more robust basis for assessing collective progress and ambition toward 2035", says the report.
Although the first global stocktake of action towards the goals of the Paris Agreement called for countries to submit targets "covering all greenhouse gases", there has only been a "modest" increase in the number of nations to do so, according to the report.
It says that eight countries included greenhouse gas targets for the first time in their third NDCs, bringing the total number parties with such targets up to 155.
The third NDCs "increasingly use more robust and verifiable target formulations", such as standardised baselines, says the report.
However, they have not "meaningfully broadened the scope of sectors and gases covered by the targets", it adds.
If the third NDCs were implemented in full, it would lower global emissions in 2035 by 3.5GtCO2e, compared to 2030 targets, says the report.
It says this is "far from the global reductions needed to get on track to achieving the long-term temperature goal of the Paris Agreement".
Compared to the 2025 report, the projections for global emissions in 2035 as a result the third NDCs are about 3GtCO2e higher.
This is down to the formal withdrawal of the US from the Paris Agreement, as well as from "harmonising" the projections with the latest historical emissions data, says the report.
The global "implementation gap" for 2030 - defined as the difference between countries' projected emissions under current policies and the emissions expected if they implemented their NDCs in full - has narrowed compared to last year, says the report.
However, this is mainly due to the withdrawal of the US from the Paris Agreement. In other words, the narrowing of the gap is due to "policy changes, not policy progress".
The implementation gap for both 2030 and 2035 are of a similar size - suggesting "enhanced collective ambition of 2035 NDCs is weak", continues the report.
Some 14 of the 17 G20 nations, counting the EU as one, have submitted new NDCs with emissions targets for 2035, says the report.
However, the emissions trajectories of the majority of G20 nations remain "misaligned" with their net-zero targets, says the report.
The chart below shows the gap between nations' current emission trajectories and their NDC targets for 2030 and 2035 (diamonds), along with their net-zero targets (circles).
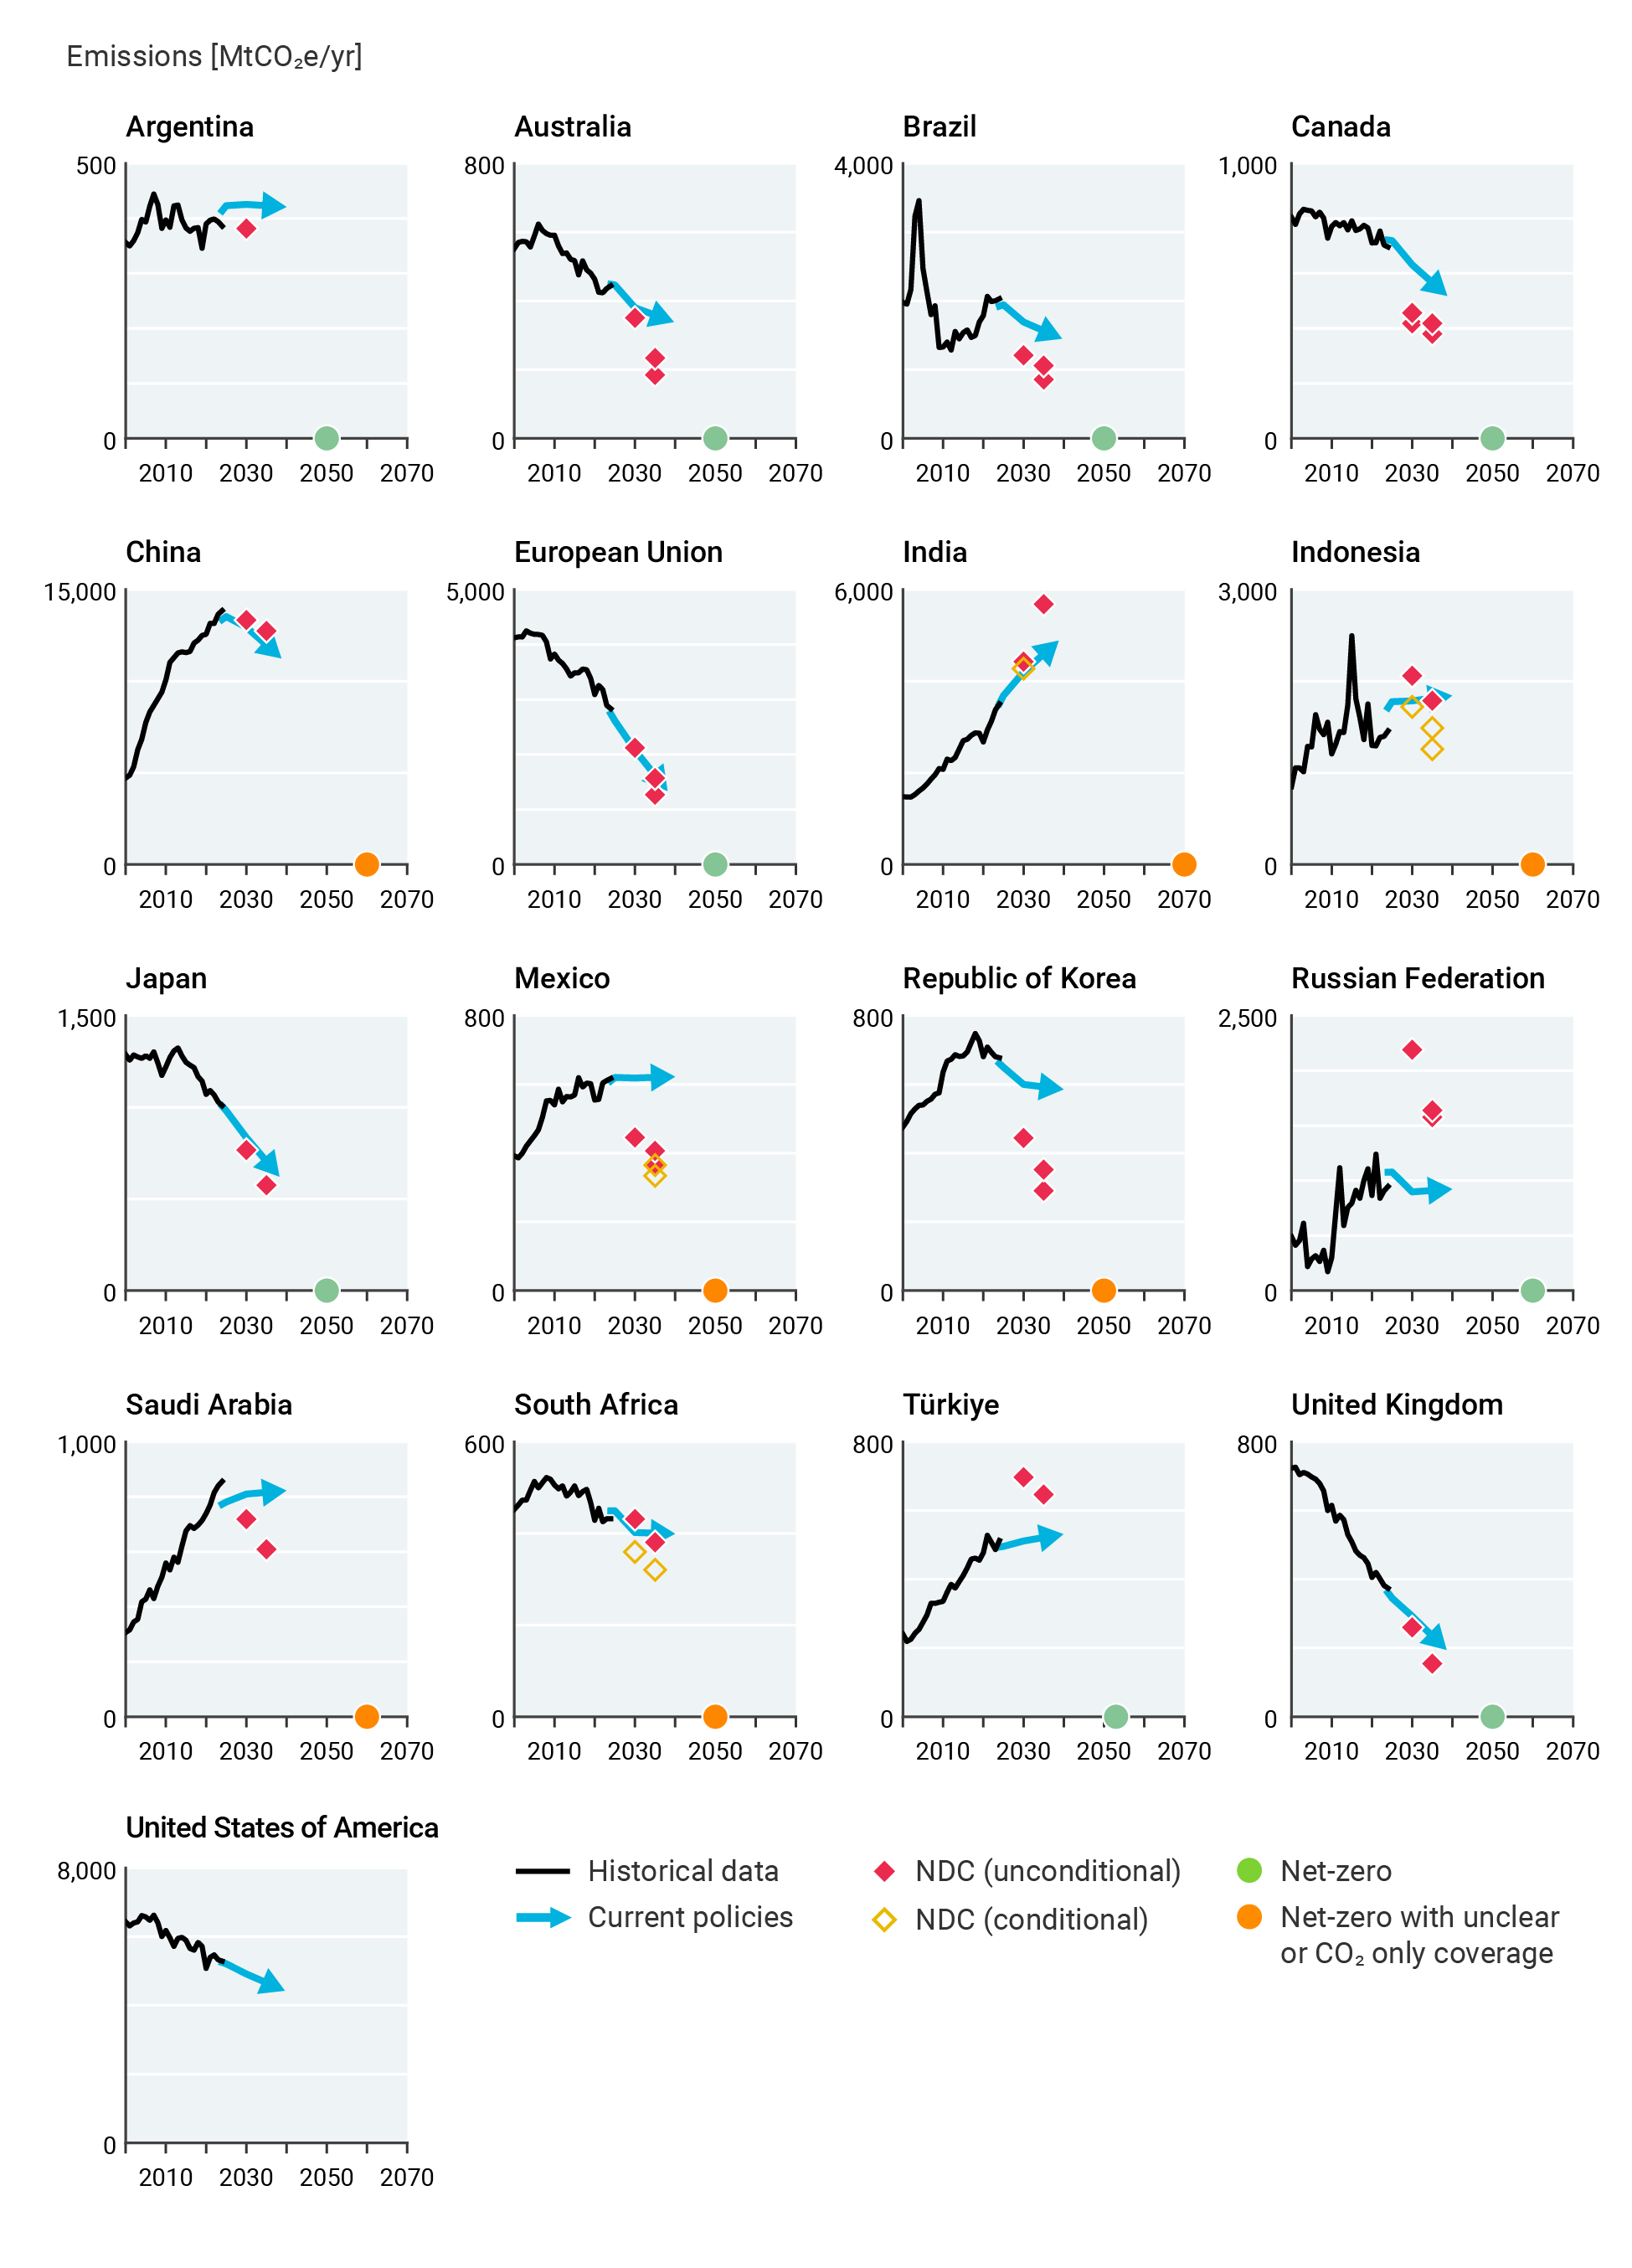 Credit: UNEP emissions gap report (2026)
All G20 members except Japan, the EU and UK would need to "accelerate their emission reduction rates based on current policies" to achieve their net-zero targets, adds the report.
Emissions gap is 'still large'The report goes on to estimate the "emissions gap" - the difference between projected global emissions if all NDCs are met in full and what would be needed to achieve the long-term temperature goal of the Paris Agreement.
The report assesses a range of potential future pathways - some that have been assessed in previous reports and some new. The three core "NDC scenarios" are:
- A "current policy" scenario, which projects global greenhouse gas emissions based only on policies adopted and implemented as of November 2025.
- An "unconditional NDCs" scenario, which projects greenhouse gas emissions assuming full implementation of the most recent NDCs that do not depend on external support (with a cut-off date of 1 September 2026).
- A "conditional NDCs" scenario that further assumes that the implementation of NDCs that depend on external support, such as climate finance from wealthier countries (also with a cut-off date of 1 September 2026).
As with the 2025 report, the authors also analyse two "scenario extensions", which explore the implications of current policies, NDCs and net-zero pledges beyond 2035:
- A "current policies continuing" scenario, which "follows current policies to 2035 and assumes a continuation of similar efforts thereafter".
- A "conditional NDCs plus all net-zero pledges" scenario, which is "the most optimistic scenario included". This scenario assumes the "conditional NDC" scenario is achieved until 2035 and then all net-zero or other long-term low emissions developments strategies are followed thereafter, excluding that of the US.
In previous reports, the authors have compared all of these scenarios against pathways that hold warming below 2C and 1.8C, or against 1.5C with no more than 0.1C of "overshoot".
(Overshoot refers to pathways where global warming first exceeds the 1.5C limit and is then brought back down through techniques that remove carbon from the atmosphere.)
These three warming pathways were drawn from the scenario database for the mitigation report of the Intergovernmental Panel on Climate Change's (IPCC) sixth assessment (AR6).
These scenarios were developed around 2015-20 and assumed that the world would pursue immediate emissions cuts from around 2020. However, in reality, emissions have continued to rise. As a result, the report says, those temperature pathways "have become outdated".
For example, the authors explain, emissions are currently around 80% above the level that would have been needed by 2030 to limit warming to 1.5C with no or "low" overshoot.
Therefore, as a result of "decades of insufficient emission reductions", the possibility of limiting warming to 1.5C with limited or no overshoot "has now been lost", say the authors.
The 2026 report instead "draws on a new generation of pathways in which ambitious mitigation action starts from 2025". These are:
- A "below 2C" scenario, which is consistent with keeping global warming below 2C throughout the 21st century, with at least a 66% chance.
- A "lowest 1.5C overshoot" scenario, which keeps warming to 1.7-1.8C throughout the entire century (with a 66% chance) and returns it to 1.5C by 2100 (with a 50% chance).
These updated scenarios "reflect the failure to cut global emissions to date", note the authors.
The overshoot scenario "minimise[s] both the magnitude and duration of overshoot above 1.5C", say the authors, while meeting a defined set of "feasibility and sustainability guardrails". These include, for example, balancing the demands of bioenergy and large-scale carbon removals with biodiversity and food security needs.
The task to "minimise" overshoot reflects the wording of the "Global Mutirão" package of measures agreed at the COP30 climate summit in Brazil in 2025. This acknowledged - for the first time in a COP text - that there was likely to be an overshoot of 1.5C and urged that both its extent and duration needed to be "limit[ed]".
The chart below, taken from the report, shows how the emissions pathways compare to each other, as well as historical emissions and the 1.5C pathway used in previous reports.
The right-hand section shows the "unbridgeable gap" to pathways that limit warming to 1.5C with overshoot of no more than 0.1C.
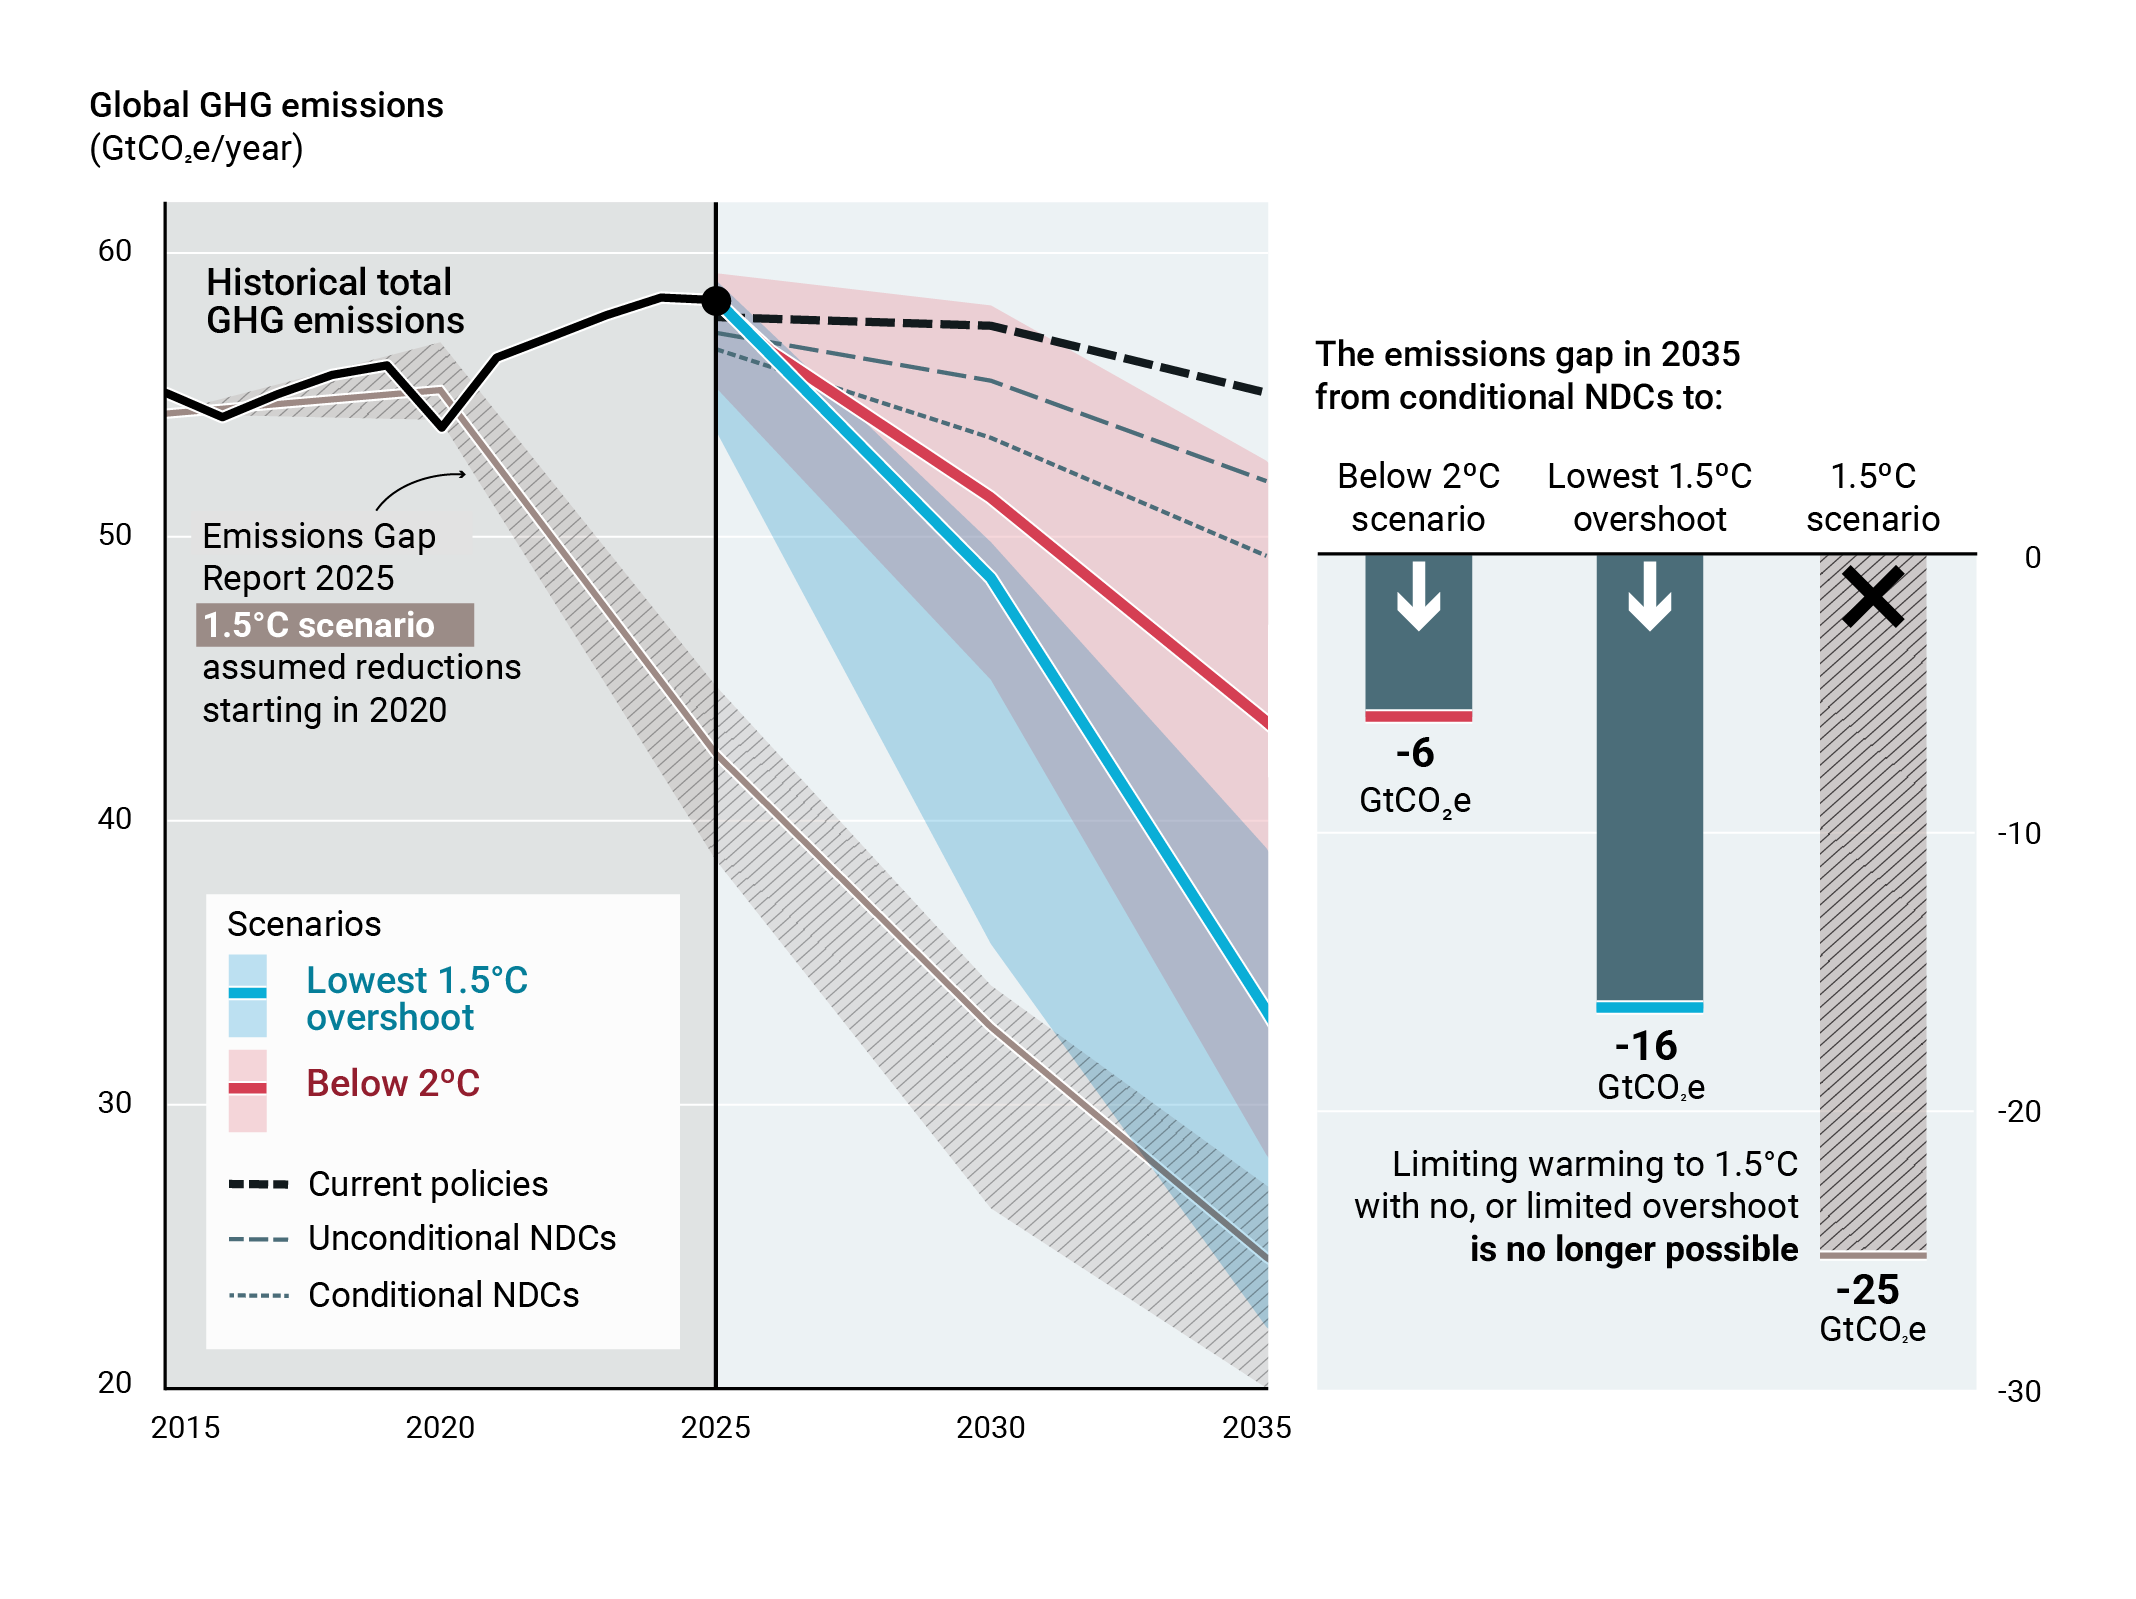 The left-hand chart shows projected emissions under the three NDC scenarios (median estimates), as well as the "below 2C" and "lowest 1.5C overshoot" scenarios (central estimates, plus the full min-max range) out to 2035. The right-hand chart shows the emissions gap in 2035 to the conditional NDCs. Credit: UNEP emissions gap report (2026)
The lowest 1.5C overshoot scenario requires "immediate, deep, rapid and sustained reductions", says the report. Global greenhouse gas emissions would need to fall by 18% by 2030, 45% by 2035 and 69% by 2040, relative to 2025 levels. Global net-zero CO2 emissions would be reached around 2050.
These benchmarks for 1.5C effectively replace those in the IPCC's AR6, which specified reductions of 43% by 2030 and 60% by 2035, relative to 2019 levels. These have been frequently cited in COP decisions and other declarations.
With the ongoing uncertainty around the timeline for the IPCC's seventh assessment reports, the benchmarks in the UNEP report provide an important update on the emissions cuts required to limit overshoot.
For the 2C scenario, global greenhouse gas emissions would need to drop by 11% by 2030, 24% by 2035 and 37% by 2040, relative to 2025 levels, the report says.
The table below sets out the estimated emissions from the NDC scenarios and the gaps to the new "below 2C" and "lowest 1.5C overshoot" scenarios.
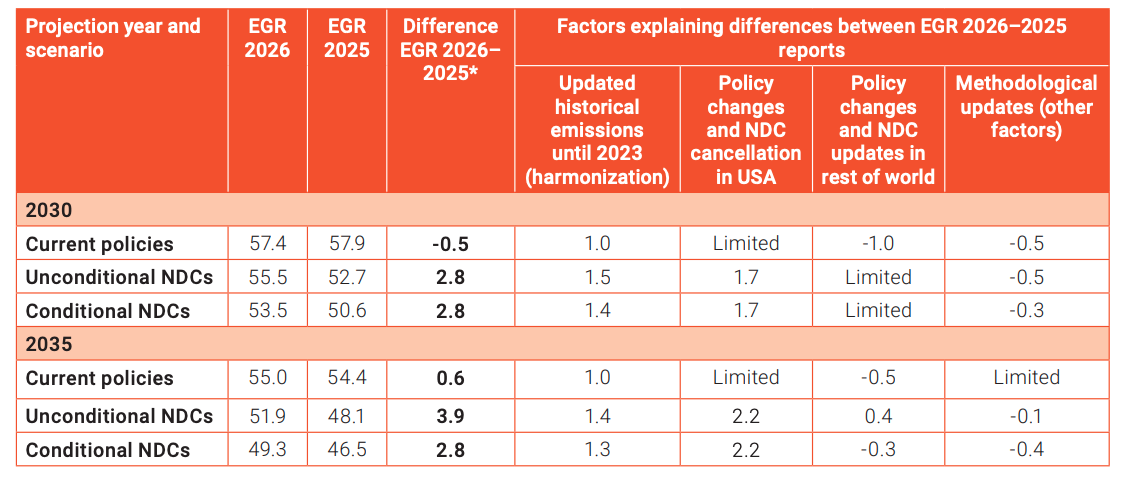 Credit: UNEP emissions gap report (2026)
These emissions gaps are "still large", say the authors, with current NDCs and net-zero targets not being "enough to minimise overshoot".
(The report also notes that because the 1.5C and 2C scenarios have changed, the emissions gaps in 2026 are not directly comparable with previous reports.)
Putting the world on track for the lowest 1.5C scenario would require global emissions to fall by 5.7% per year over the next decade, it says.
This is "even more rapid" than the 5% annual drop that would have been required to meet the 1.5C limit without overshoot, had emissions cuts started in 2019, adds the report.
Every five years of delay will add 0.1CTo explore different future emission pathways and their impact on global temperatures, the report uses a simple climate model, or "emulator", called FaIR.
The report estimates that current national policies would cause 2.8C of global warming over the century, with a 66% chance. Under this scenario, there is also a 10% chance that warming would exceed 3.4C.
If unconditional NDCs are implemented, warming this century could reach 2.7C, with a 66% chance, it says.
If all NDCs are fully implemented, warming could reach 2.6C by 2100, with a 66% chance.
In the "most optimistic" scenario, where countries fully implement their NDCs and reach their net-zero targets, there is a 66% chance that warming could be limited to 2.1C by the end of this century.
These results are illustrated on the chart below, with boxes showing a 10-90% certainty range under a central estimate of future emissions and vertical lines showing the "combined uncertainty across greenhouse gas emissions projections and Earth-system response uncertainty".
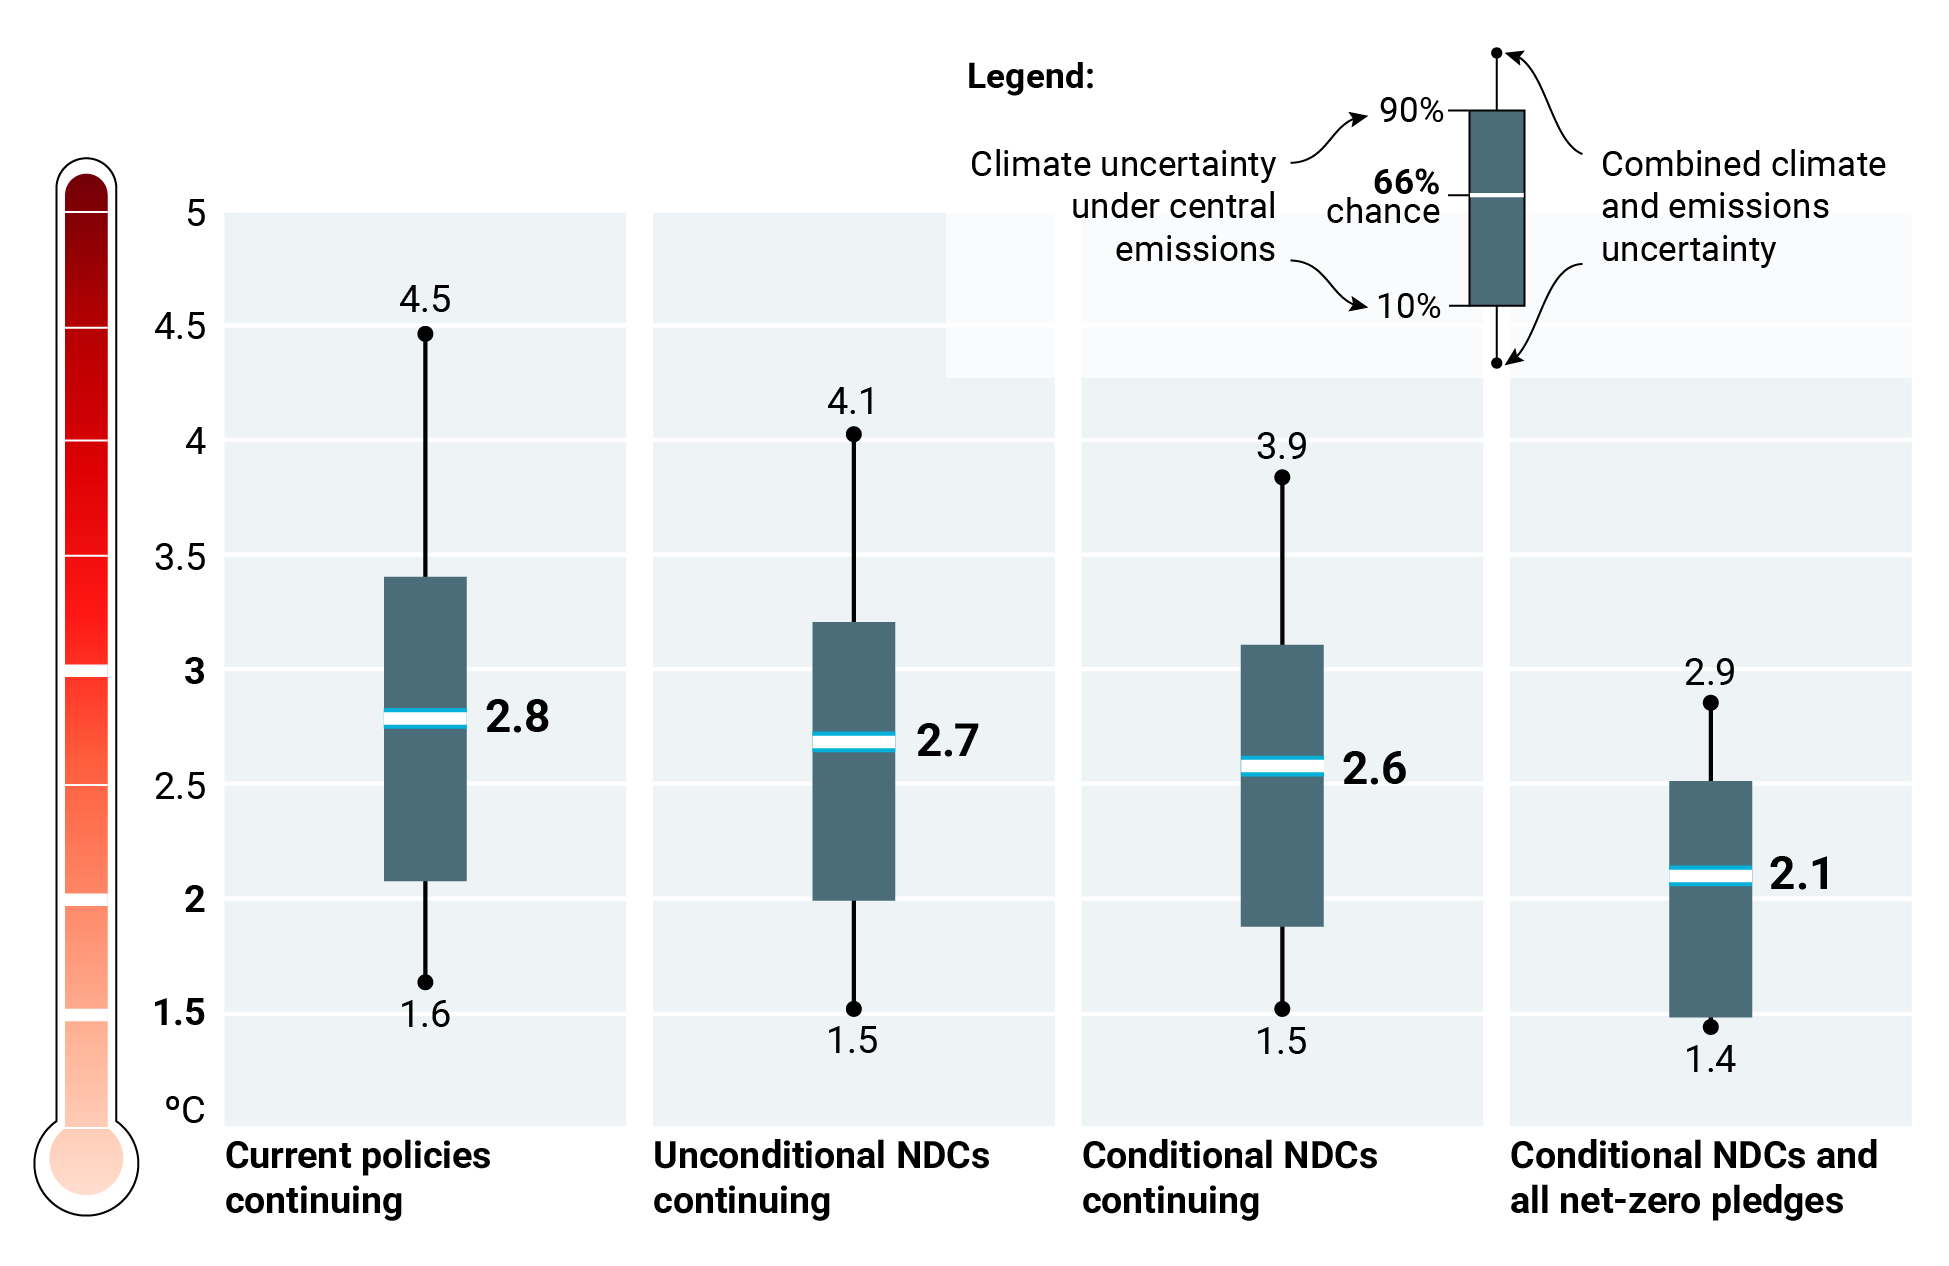 Credit: UNEP emissions gap report (2026)
Compared to last year, the central warming estimates in 2100 for the NDC scenarios are about 0.2-0.3C higher, says the report.
This is because the projected global emissions as a result of the 2035 NDCs have increased. Again, this is down to the US withdrawal from the Paris Agreement and higher estimates of historical emissions.
While fully implementing all NDCs and net-zero pledges could cut warming by 0.6C, this would still be 0.25C higher than the lowest 1.5C overshoot pathways, says the report.
It adds that this "highlights the need both to close the implementation gap between current policies and existing NDCs and net-zero pledges, and to strengthen NDCs or exceed existing commitments".
As noted above, the report continues that, "with immediate, deep, rapid and sustained emission cuts", it would still be possible to limit peak warming to 1.7-1.8C, with a 66% chance.
If these emission cuts are "combined with an ambitious and sustainable scale-up of CO2 removal", then warming could be returned to 1.5C by the end of the century, it continues.
However, "continued delay" in reducing global emissions would "further worsen the climate outcomes still achievable", it says, adding:
"For every five years of delay in starting to cut emissions, around another 0.1C of warming will be locked in.
"Continued insufficient emission reductions over the next decades could make warming of 2C inevitable, putting the Paris Agreement at risk of failure."
The figure below shows the likelihood of holding warming to 1.5C, 2C and 3C under scenarios over this century where countries continue with current policies, implement unconditional NDCs, all NDCs and both NDCs and net-zero pledges.
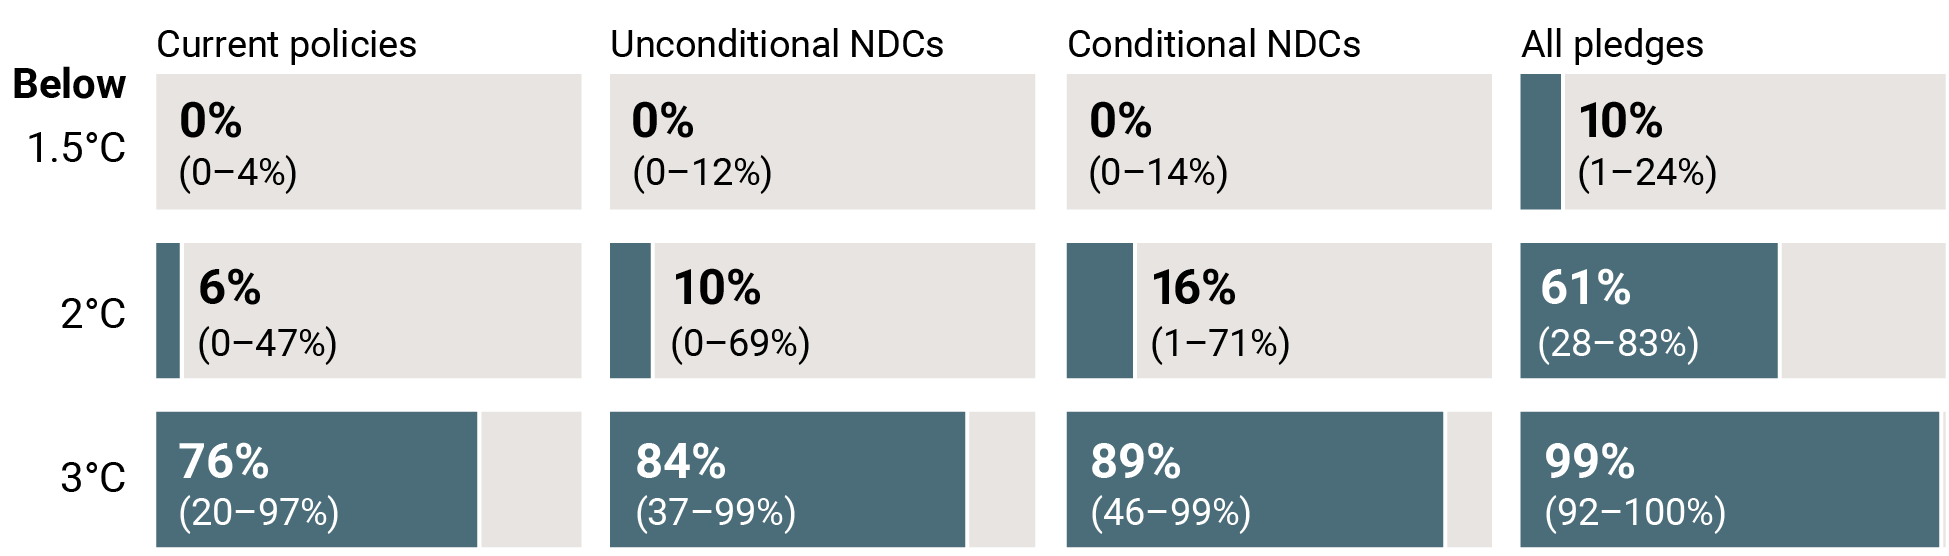 Credit: UNEP emissions gap report (2026)
'Uneven and insufficient' progress towards global stocktake
The report also looks at how the world is measuring up against the mitigation actions set out in the first "global stocktake", which was agreed at the COP28 climate summit in Dubai, in 2023.
The global stocktake is a key part of the Paris regime that assesses progress towards meeting the goals of the agreement. After each stocktake is completed, countries are supposed to increase their ambition as needed to get on track with their collective targets.
The report looks at nine "mitigation action areas" agreed in the outcome of the first global stocktake. Overall, the report says, progress in those areas is "uneven and insufficient".
However, it does note that there are "several remarkable examples of progress that exceeded expectations".
In particular, the deployment of renewable energy has increased substantially more than was expected by future projections made in 2015 using then-current policies, notes the report. The increase in overall renewable capacity was three times higher than expected under the previous projections. As a result, CO2 emissions related to energy generation increased by 40% less than was expected.
The chart below shows how key energy indicators have changed (black circles), compared to the 2015 projections (white circles).
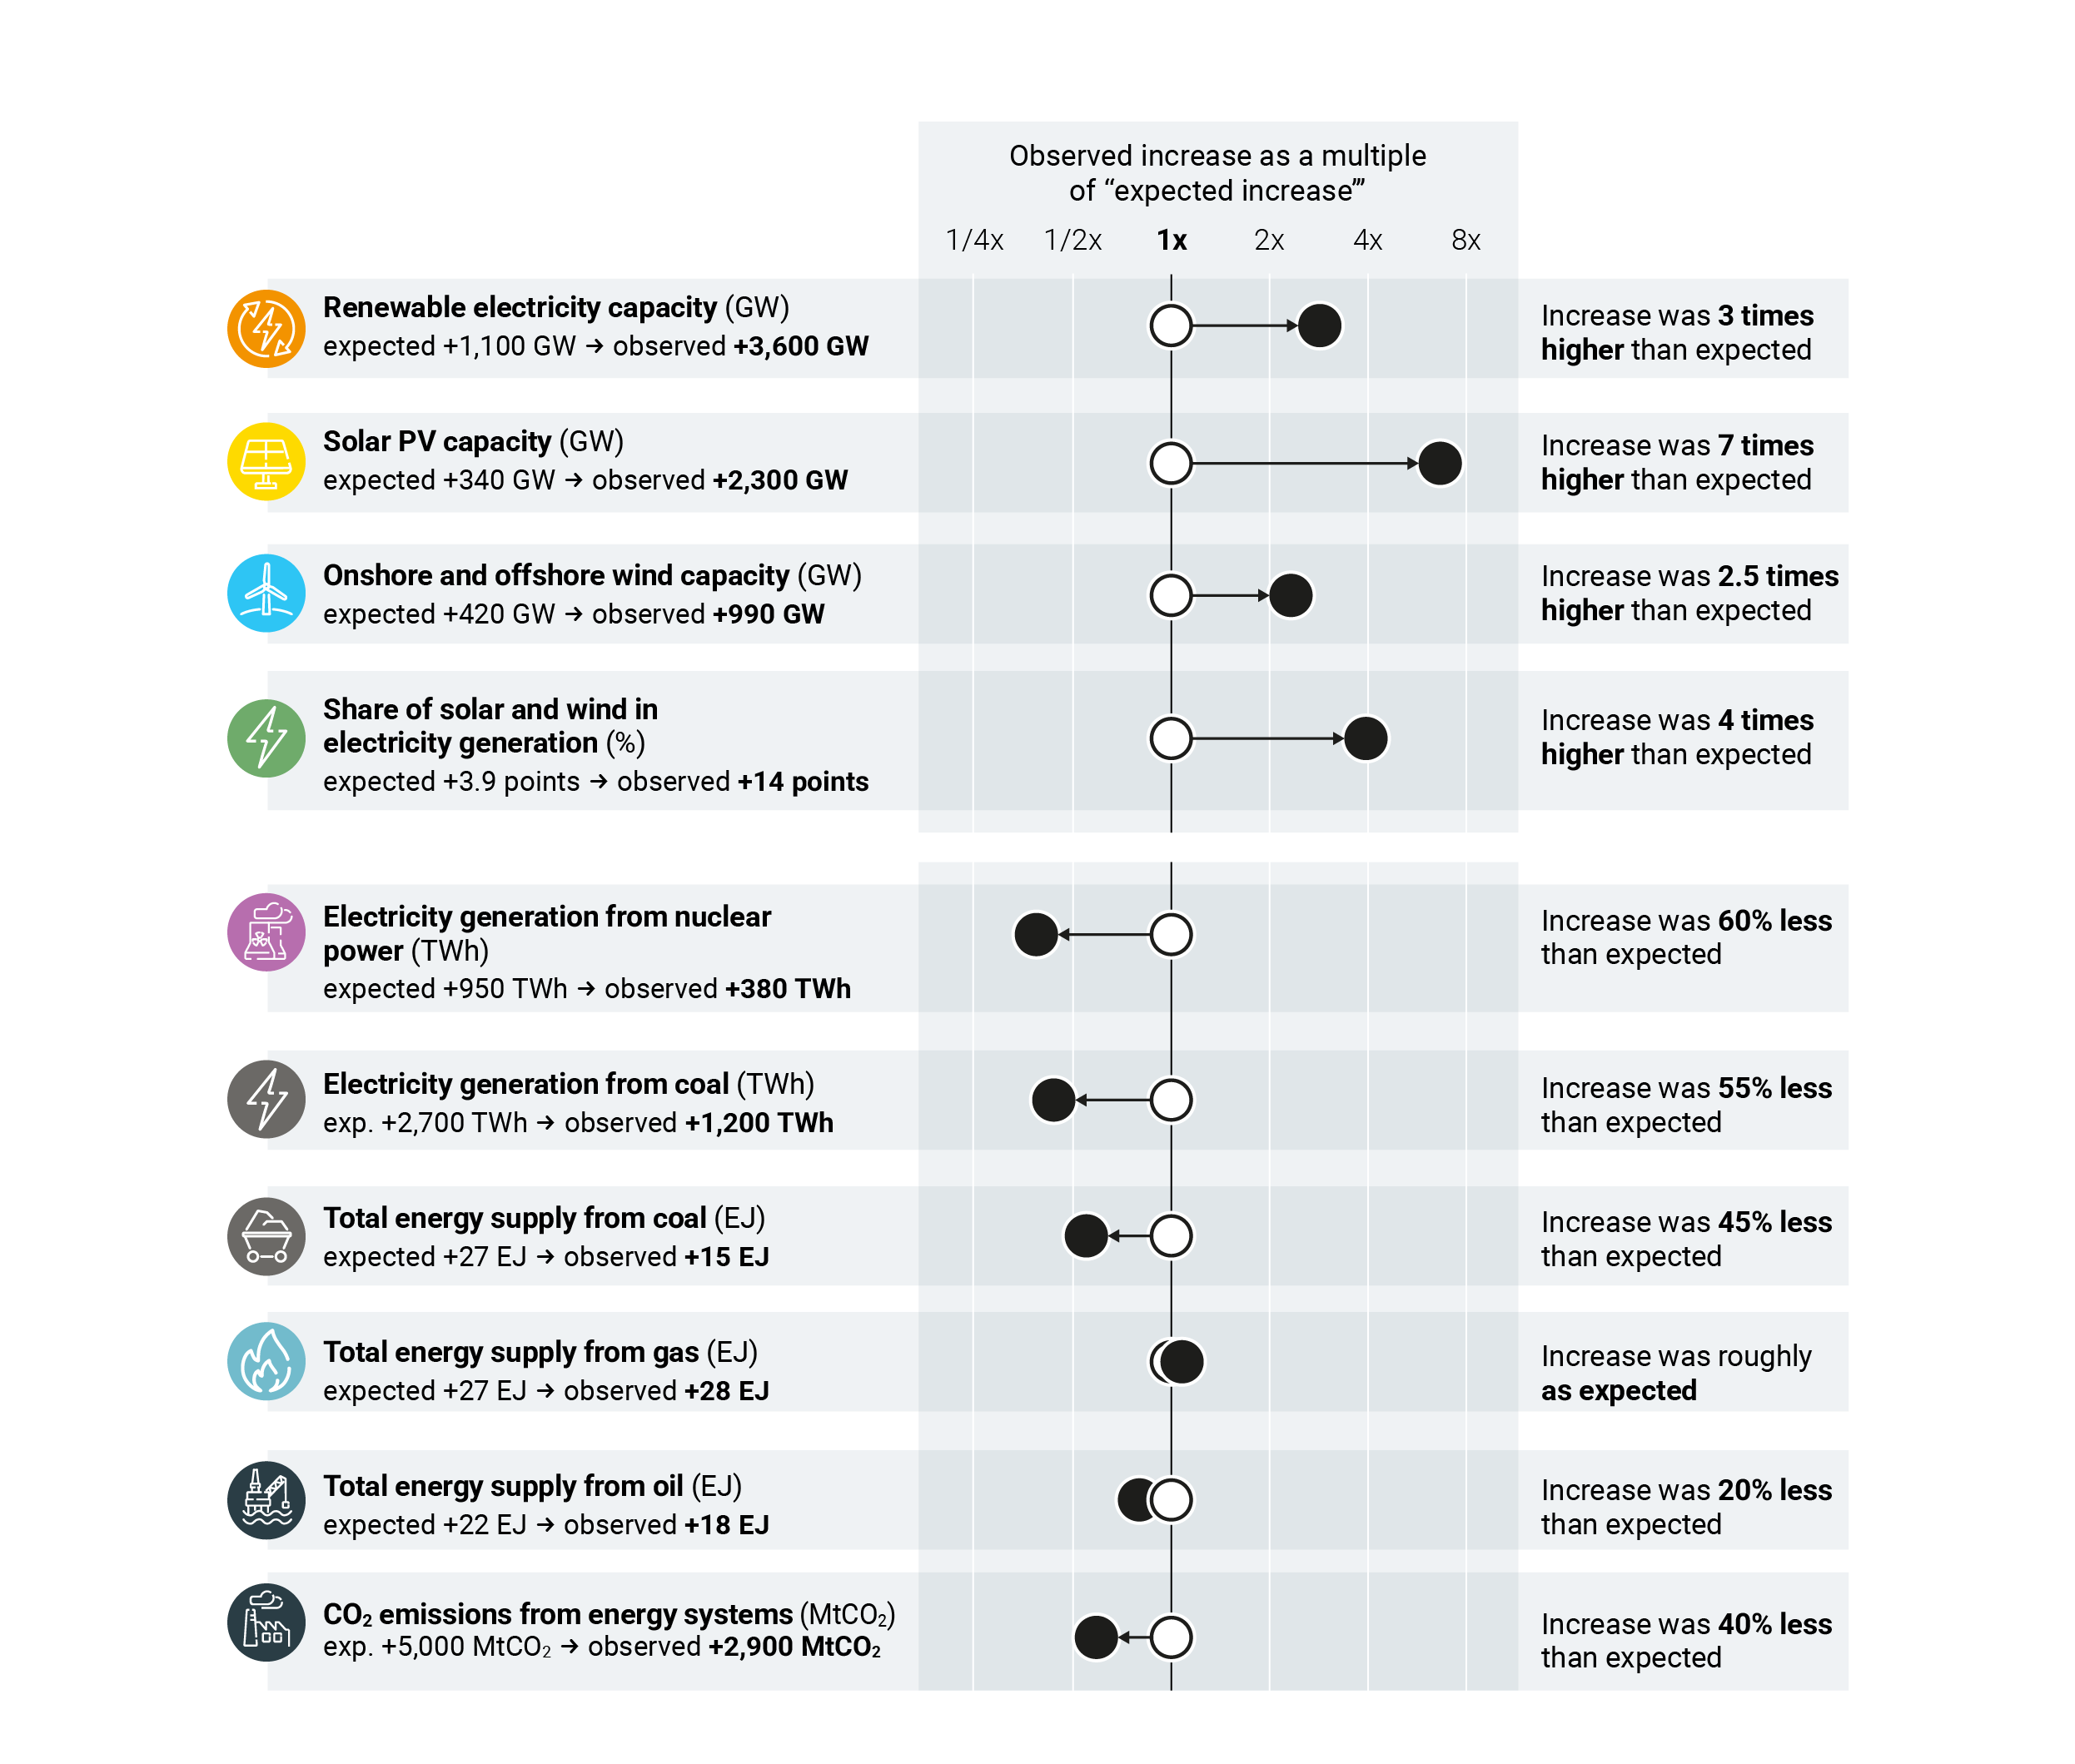 Source: UNEP emissions gap report (2026)
According to the report, "only renewables are on track for 2030…though continued adoption and implementation of supportive policies will be required to sustain such growth".
The world is "lagging particularly far behind" where it needs to be to limit warming to the lowest possible overshoot of the 1.5C target in two areas: transitioning away from fossil fuels and halting deforestation, says the report. (Deforestation is the largest contributor to LULUCF emissions.)
The report notes that the amount of energy sourced from fossil fuels "continues to rise globally, albeit at a slower rate than was projected in 2015". Under current policies, it says, global coal usage may peak by 2030, but oil and gas use is "likely to keep increasing".
Furthermore, it says, global efforts to stop deforestation by 2030 "remain significantly off track". Achieving the end-of-decade target would require accelerating the slowdown in forest loss by "more than a factor of 10".
The report also includes modelling that shows what level of ambition is needed to achieve the "lowest overshoot" scenario - that which will "minimise the magnitude and duration of overshoot". This lowest overshoot scenario results in a maximum warming of around 1.7C, with the world returning below 1.5C by 2100, report authors explained in a press briefing.
(It is "no longer feasible", the report notes, to limit global warming to a temperature rise of 1.5C with an overshoot of no more than 0.1C.)
It provides projections for the ambition needed by 2030, 2035, 2040 and 2050 to achieve this lowest overshoot scenario. For example, minimising overshoot will require reducing the amount of energy derived from coal by 15% by 2030, compared to 2025 levels. Coal energy should be reduced 55% by 2035, 75% by 2040 and 90% by 2050, shows the report.
For oil and gas, smaller reductions are needed in the short term - 5% and 0%, respectively, by 2030 - but with steep declines in the following years. By 2050, energy from oil should be reduced by 65% and energy from gas should be reduced by 75%, says the report.
The chart below shows the outcomes needed in several energy- and electricity-related areas to limit the peak and duration of overshoot.
The black line shows the observed changes from 2020 to 2025, while the dashed black line shows 2015 projections based on then-current policies. The thick blue line shows the "minimum collective effort" needed to achieve the lowest overshoot scenario.
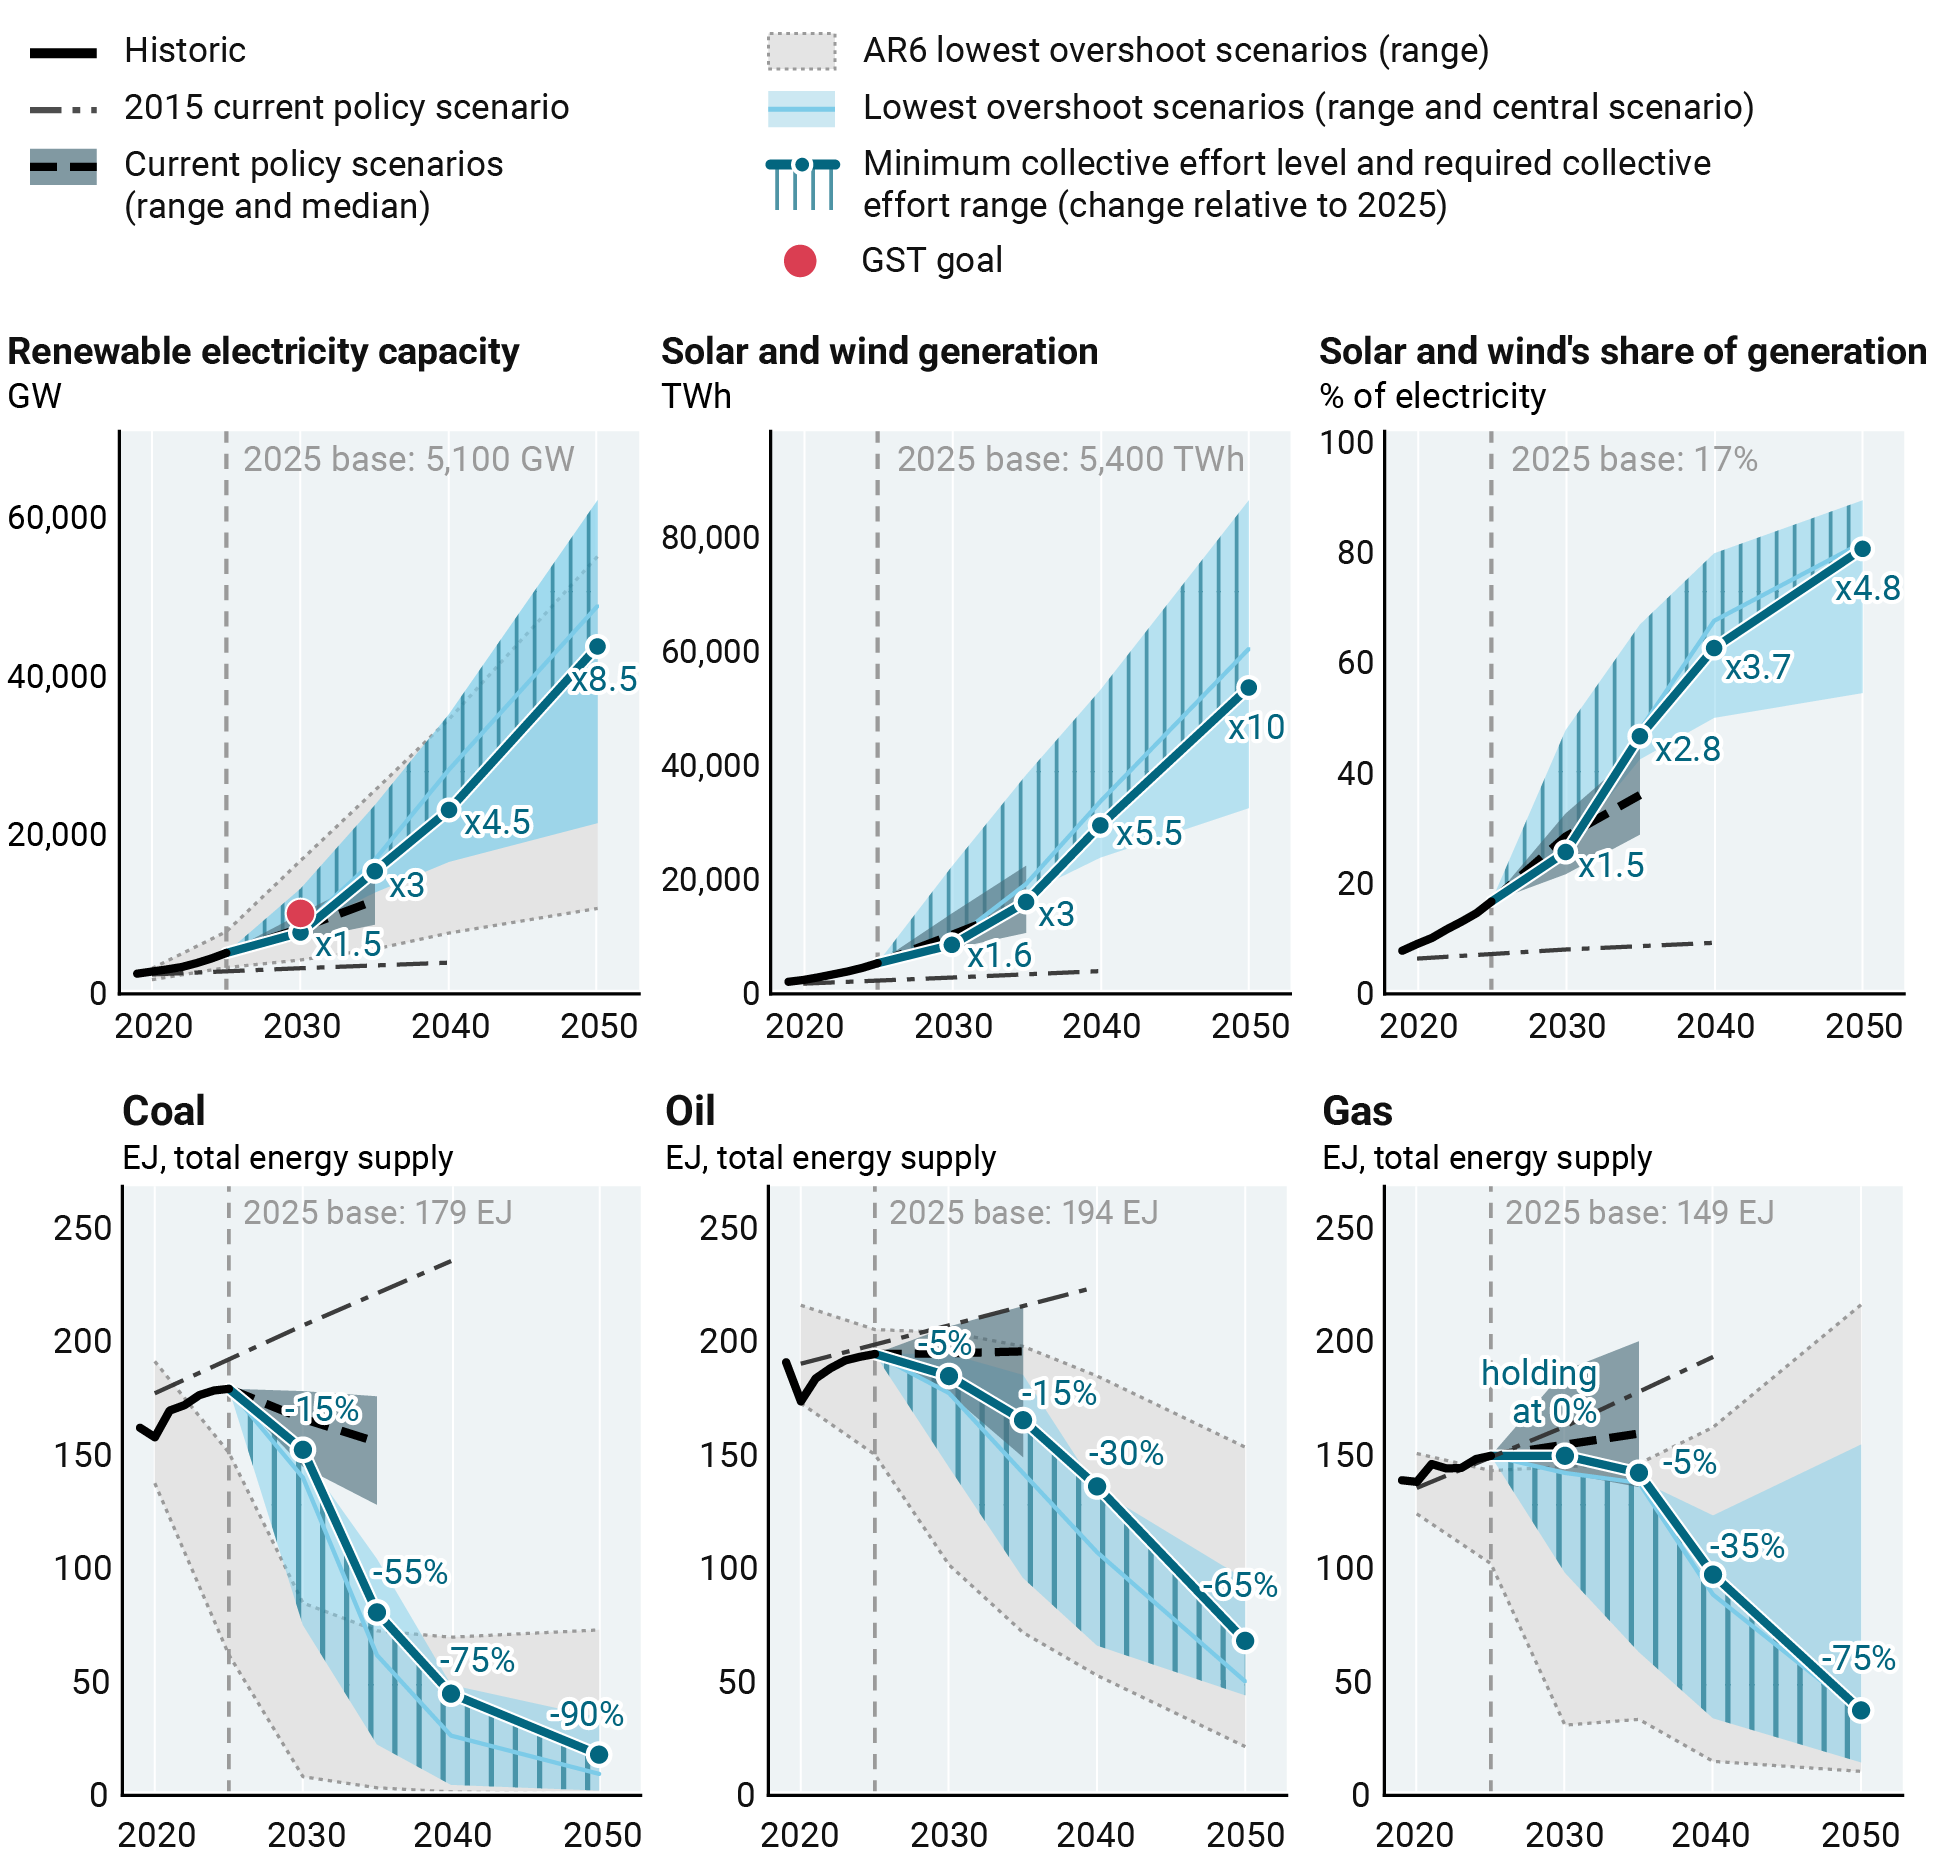 Source: UNEP emissions gap report (2026)
(There are a range of different ways to reach the "lowest overshoot" scenario. The "minimum collective effort" illustrates the lowest contribution from each sector or fuel that would still be compatible with reaching the "lowest overshoot" scenario overall.)
Article information
Dr Simon Evans, Carbon Brief's deputy editor and senior policy editor, is an observer of the UNEP gap report's steering committee.
UNEP (2026), Emissions gap report 2026: The point of return: Urgent emissions cuts needed to come back from overshoot of 1.5C
Related
Guest post: Why tough methane cuts are crucial for keeping warming 'well-below' 2C
01.09.2026
Climate pollutants
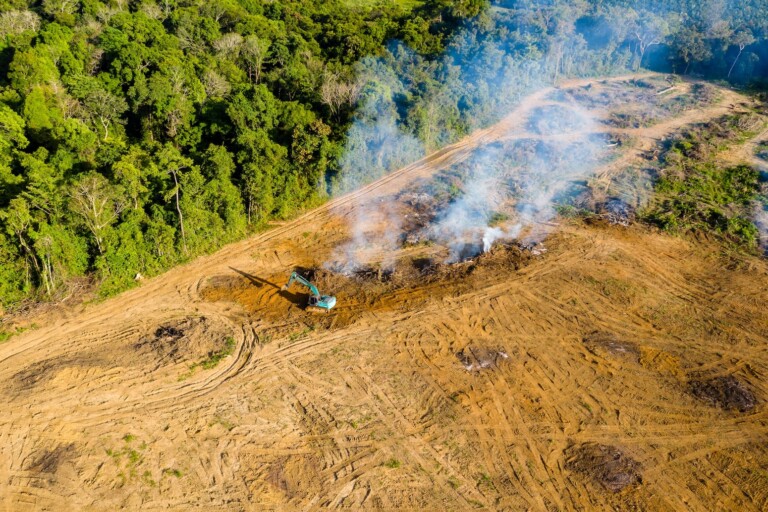 Why land-use emissions have fallen by a third this century - in six charts
17.08.2026
Climate pollutants
 Experts: Why carbon removal needs a 'major scale up' to return warming to 1.5C
19.06.2026
Carbon dioxide removal
 Analysis: What are the causes of recent record-high global temperatures?
10.12.2025
Climate pollutants
The post UNEP: Opportunity has 'been lost' to meet 1.5C warming limit without 'overshoot' appeared first on Carbon Brief.
- What timeline options were delegates debating?
- How did the timeline discussions unfold?
- What were the main points of disagreement?
- Why is the IPCC in a 'serious funding crisis'?
- How have scientists reacted?
- What other issues remain unresolved?
- How are the IPCC AR7 reports progressing?
- How might the IPCC use AI and enhance gender inclusivity?
Countries have failed - for the sixth time running - to agree on the timeline for publishing the Intergovernmental Panel on Climate Change's (IPCC) next set of influential reports.
The IPCC's 65th session (IPCC-65) was seen by many to be the final opportunity for countries to agree on a schedule where its seventh assessment report (AR7) would be published in time for the UN's second "global stocktake" of climate action.
Before last week's meeting in Addis Ababa, Ethiopia, IPCC chair Prof Sir Jim Skea had warned that releasing the reports in time for the stocktake in 2028 would depend on a timeline being agreed by the end of 2026.
But the week-long meeting descended into fraught disagreements between governments, resulting in Skea "suspending" the talks on Friday evening with no decision made.
Countries were also unable to agree on the IPCC's budget for the rest of the AR7 cycle, leaving the body with a "serious funding crisis".
The IPCC has pledged to reconvene the meeting at the "earliest opportunity"; however, it has not yet given an indication of when this will be.
In his concluding remarks, Skea described the Addis Ababa summit as a "profound disappointment" and "among the most difficult IPCC meetings", according to reporting from the Earth Negotiations Bulletin (ENB).
Some countries have reacted with dismay to the breakdown of negotiations, warning that a failure to have the IPCC's latest assessments on climate adaptation and mitigation ready for the UN stocktaking exercise would undermine global climate action.
A climate envoy from a Pacific island state said it was a "travesty that a handful of countries continue to delay the IPCC's reports - the science we need back home to help us save lives and livelihoods".
Below, Carbon Brief explores the key developments, debates and disagreements at the IPCC meeting.
- What timeline options were delegates debating?
- How did the timeline discussions unfold?
- What were the main points of disagreement?
- Why is the IPCC in a 'serious funding crisis'?
- How have scientists reacted?
- What other issues remain unresolved?
- How are the IPCC AR7 reports progressing?
- How might the IPCC use AI and enhance gender inclusivity?
Top of the agenda during the Addis Ababa meeting was a decision on the timeline of the publication of AR7's three working group reports - also known as the "work plan". The three reports cover climate science (WG1), impacts and adaptation (WG2) and mitigation (WG3).
Countries failed to reach a resolution on the scheduling of the influential reports at five consecutive IPCC meetings since 2024 - despite drafting being well underway.
(For more, see Carbon Brief's write-up of discussions in Istanbul, Sofia, Hangzhou, Lima and Bangkok.)
Reporting from the ENB from inside these meetings has highlighted that countries are split, broadly, into two groups - those that want all three reports to be published in time for the UN's second "global stocktake" in 2028, and those that one, or more, to be published afterwards.
A key pillar of the Paris Agreement, the global stocktake is a formal assessment of the world's collective progress on tackling climate change. The exercise is designed to guide future global climate action, including decisions on national emissions targets and climate finance.
The second global stocktake is due to culminate in late 2028 at the COP33 climate summit.
The Addis Ababa meeting was the final IPCC plenary where countries would be able to agree on a stocktake-aligned timeline. In April, Skea told Carbon Brief that publishing reports by the end of 2028 would only be possible if a decision was taken before the end of 2026.
India, Kenya, Russia and Saudi Arabia have emerged as among the loudest voices calling for a timeline where the IPCC's latest assessment of climate impacts and mitigation are published after the stocktake. They have argued that developing countries need more time to prepare, review and approve working group reports.
A coalition of developed nations and small-island developing states, meanwhile, have argued in favour of all three reports being published in time for the stocktake, so that the latest climate science can inform future climate action.
(For more on the standoff around the reports and why it matters for climate action, read Carbon Brief's explainer.)
Ahead of the Addis Ababa meeting, the IPCC's secretariat, on behalf of Skea, published a document setting out three options for a timeline for the working group reports. These are summarised below.
Option 1Option 2Option 3
Proposal set out by working group co-chairs at IPCC-61 in Sofia.Revisited proposal presented by working-group co-chairs at IPCC-63 in Lima.Submissions by India and Saudi Arabia to a survey sent out by IPCC in 2026.
Report approvalPlenaryProposed month of approvalPlenary Proposed month of approvalPlenaryProposed month of approval
Working Group 1IPCC-69May 2028IPCC-69May 2028IPCC-69May 2028
Working Group 2IPCC-70June 2028IPCC-70July 2028IPCC-71April 2029
Working Group 3IPCC-71July 2028IPCC-71Sept 2028IPCC-72July 2029
Source: Table 1 and Appendix A in "Work plan of the IPCC seventh assessment report", IPCC.
.caption-fix{ font-size: 16px; font-family: 'PT Sans', sans-serif; font-weight: 400; text-align: start; color: #444444; max-width: min(765px, calc(100% - (2rem * 2))); margin: 0 auto }Over several days of fraught talks in Addis Ababa, the number of timeline options in contention ballooned to seven - before being reduced down to four.
How did the timeline discussions unfold?On Monday, Skea established a "contact group", chaired by Brazil and Ireland, to focus on the timeline issue.
By Friday morning, the group reported back to the plenary that they were still a "long way from consensus", according to the ENB.
By that afternoon, four options still remained - the three set out by the IPCC ahead of the meeting and a fourth, proposed by Haiti, which would see WG1 approval in April 2028, WG2 in July 2028 and WG3 in October 2028.
The IPCC's secretariat subsequently presented a "draft decision" for the timeline issue to plenary, informed by the contact group's work. The text did not establish a formal decision on the timeline, but presented a number of options for how the IPCC could move forward on the issue, as well as proposals for addressing inclusivity concerns.
#gform_wrapper_5[data-form-index="0"].gform-theme,[data-parent-form="5_0"]{--gf-color-primary: #204ce5;--gf-color-primary-rgb: 32, 76, 229;--gf-color-primary-contrast: #fff;--gf-color-primary-contrast-rgb: 255, 255, 255;--gf-color-primary-darker: #001AB3;--gf-color-primary-lighter: #527EFF;--gf-color-secondary: #fff;--gf-color-secondary-rgb: 255, 255, 255;--gf-color-secondary-contrast: #112337;--gf-color-secondary-contrast-rgb: 17, 35, 55;--gf-color-secondary-darker: #F5F5F5;--gf-color-secondary-lighter: #FFFFFF;--gf-color-out-ctrl-light: rgba(17, 35, 55, 0.1);--gf-color-out-ctrl-light-rgb: 17, 35, 55;--gf-color-out-ctrl-light-darker: rgba(104, 110, 119, 0.35);--gf-color-out-ctrl-light-lighter: #F5F5F5;--gf-color-out-ctrl-dark: #585e6a;--gf-color-out-ctrl-dark-rgb: 88, 94, 106;--gf-color-out-ctrl-dark-darker: #112337;--gf-color-out-ctrl-dark-lighter: rgba(17, 35, 55, 0.65);--gf-color-in-ctrl: #fff;--gf-color-in-ctrl-rgb: 255, 255, 255;--gf-color-in-ctrl-contrast: #112337;--gf-color-in-ctrl-contrast-rgb: 17, 35, 55;--gf-color-in-ctrl-darker: #F5F5F5;--gf-color-in-ctrl-lighter: #FFFFFF;--gf-color-in-ctrl-primary: #204ce5;--gf-color-in-ctrl-primary-rgb: 32, 76, 229;--gf-color-in-ctrl-primary-contrast: #fff;--gf-color-in-ctrl-primary-contrast-rgb: 255, 255, 255;--gf-color-in-ctrl-primary-darker: #001AB3;--gf-color-in-ctrl-primary-lighter: #527EFF;--gf-color-in-ctrl-light: rgba(17, 35, 55, 0.1);--gf-color-in-ctrl-light-rgb: 17, 35, 55;--gf-color-in-ctrl-light-darker: rgba(104, 110, 119, 0.35);--gf-color-in-ctrl-light-lighter: #F5F5F5;--gf-color-in-ctrl-dark: #585e6a;--gf-color-in-ctrl-dark-rgb: 88, 94, 106;--gf-color-in-ctrl-dark-darker: #112337;--gf-color-in-ctrl-dark-lighter: rgba(17, 35, 55, 0.65);--gf-radius: 3px;--gf-font-size-secondary: 14px;--gf-font-size-tertiary: 13px;--gf-icon-ctrl-number: url("data:image/svg+xml,%3Csvg width='8' height='14' viewBox='0 0 8 14' fill='none' xmlns='http://www.w3.org/2000/svg'%3E%3Cpath fill-rule='evenodd' clip-rule='evenodd' d='M4 0C4.26522 5.96046e-08 4.51957 0.105357 4.70711 0.292893L7.70711 3.29289C8.09763 3.68342 8.09763 4.31658 7.70711 4.70711C7.31658 5.09763 6.68342 5.09763 6.29289 4.70711L4 2.41421L1.70711 4.70711C1.31658 5.09763 0.683417 5.09763 0.292893 4.70711C-0.0976311 4.31658 -0.097631 3.68342 0.292893 3.29289L3.29289 0.292893C3.48043 0.105357 3.73478 0 4 0ZM0.292893 9.29289C0.683417 8.90237 1.31658 8.90237 1.70711 9.29289L4 11.5858L6.29289 9.29289C6.68342 8.90237 7.31658 8.90237 7.70711 9.29289C8.09763 9.68342 8.09763 10.3166 7.70711 10.7071L4.70711 13.7071C4.31658 14.0976 3.68342 14.0976 3.29289 13.7071L0.292893 10.7071C-0.0976311 10.3166 -0.0976311 9.68342 0.292893 9.29289Z' fill='rgba(17, 35, 55, 0.65)'/%3E%3C/svg%3E");--gf-icon-ctrl-select: url("data:image/svg+xml,%3Csvg width='10' height='6' viewBox='0 0 10 6' fill='none' xmlns='http://www.w3.org/2000/svg'%3E%3Cpath fill-rule='evenodd' clip-rule='evenodd' d='M0.292893 0.292893C0.683417 -0.097631 1.31658 -0.097631 1.70711 0.292893L5 3.58579L8.29289 0.292893C8.68342 -0.0976311 9.31658 -0.0976311 9.70711 0.292893C10.0976 0.683417 10.0976 1.31658 9.70711 1.70711L5.70711 5.70711C5.31658 6.09763 4.68342 6.09763 4.29289 5.70711L0.292893 1.70711C-0.0976311 1.31658 -0.0976311 0.683418 0.292893 0.292893Z' fill='rgba(17, 35, 55, 0.65)'/%3E%3C/svg%3E");--gf-icon-ctrl-search: url("data:image/svg+xml,%3Csvg width='640' height='640' xmlns='http://www.w3.org/2000/svg'%3E%3Cpath d='M256 128c-70.692 0-128 57.308-128 128 0 70.691 57.308 128 128 128 70.691 0 128-57.309 128-128 0-70.692-57.309-128-128-128zM64 256c0-106.039 85.961-192 192-192s192 85.961 192 192c0 41.466-13.146 79.863-35.498 111.248l154.125 154.125c12.496 12.496 12.496 32.758 0 45.254s-32.758 12.496-45.254 0L367.248 412.502C335.862 434.854 297.467 448 256 448c-106.039 0-192-85.962-192-192z' fill='rgba(17, 35, 55, 0.65)'/%3E%3C/svg%3E");--gf-label-space-y-secondary: var(--gf-label-space-y-md-secondary);--gf-ctrl-border-color: #686e77;--gf-ctrl-size: var(--gf-ctrl-size-md);--gf-ctrl-label-color-primary: #112337;--gf-ctrl-label-color-secondary: #112337;--gf-ctrl-choice-size: var(--gf-ctrl-choice-size-md);--gf-ctrl-checkbox-check-size: var(--gf-ctrl-checkbox-check-size-md);--gf-ctrl-radio-check-size: var(--gf-ctrl-radio-check-size-md);--gf-ctrl-btn-font-size: var(--gf-ctrl-btn-font-size-md);--gf-ctrl-btn-padding-x: var(--gf-ctrl-btn-padding-x-md);--gf-ctrl-btn-size: var(--gf-ctrl-btn-size-md);--gf-ctrl-btn-border-color-secondary: #686e77;--gf-ctrl-file-btn-bg-color-hover: #EBEBEB;--gf-field-img-choice-size: var(--gf-field-img-choice-size-md);--gf-field-img-choice-card-space: var(--gf-field-img-choice-card-space-md);--gf-field-img-choice-check-ind-size: var(--gf-field-img-choice-check-ind-size-md);--gf-field-img-choice-check-ind-icon-size: var(--gf-field-img-choice-check-ind-icon-size-md);--gf-field-pg-steps-number-color: rgba(17, 35, 55, 0.8);} X/TwitterThis field is for validation purposes and should be left unchanged.Free fortnightly newsletter
.preheader p{ margin-top: 0; font-family: 'PT Sans', sans-serif; font-weight: var(--type--3--font-weight--bold); color: var(--button--color); font-size: var(--button--font-size, inherit); }
.newsletter-inline{
display: flex;
border: solid 1px #333333;
padding: 1em;
background: #ffffff;
}
.inline-email{
display:inline-block;
margin-right:1em;
margin-top:0 !important;
margin-bottom:0.5em;
}
#field_submit{
display:inline-block;
margin-top:0 !important;
}
.gform_wrapper .gfield+.gfield{
margin-top:0
}
Email
gform.initializeOnLoaded( function() {gformInitSpinner( 5, 'https://www.carbonbrief.org/wp-content/plugins/gravityforms/images/spinner.svg', false );jQuery('#gform_ajax_frame_5').on('load',function(){var contents = jQuery(this).contents().find('*').html();var is_postback = contents.indexOf('GF_AJAX_POSTBACK') >= 0;if(!is_postback){return;}var form_content = jQuery(this).contents().find('#gform_wrapper_5');var is_confirmation = jQuery(this).contents().find('#gform_confirmation_wrapper_5').length > 0;var is_redirect = contents.indexOf('gformRedirect(){') >= 0;var is_form = form_content.length > 0 && ! is_redirect && ! is_confirmation;var mt = parseInt(jQuery('html').css('margin-top'), 10) + parseInt(jQuery('body').css('margin-top'), 10) + 100;if(is_form){jQuery('#gform_wrapper_5').html(form_content.html());if(form_content.hasClass('gform_validation_error')){jQuery('#gform_wrapper_5').addClass('gform_validation_error');} else {jQuery('#gform_wrapper_5').removeClass('gform_validation_error');}setTimeout( function() { /* delay the scroll by 50 milliseconds to fix a bug in chrome */ jQuery(document).scrollTop(jQuery('#gform_wrapper_5').offset().top - mt); }, 50 );if(window['gformInitDatepicker']) {gformInitDatepicker();}if(window['gformInitPriceFields']) {gformInitPriceFields();}var current_page = jQuery('#gform_source_page_number_5').val();gformInitSpinner( 5, 'https://www.carbonbrief.org/wp-content/plugins/gravityforms/images/spinner.svg', false );jQuery(document).trigger('gform_page_loaded', [5, current_page]);window['gf_submitting_5'] = false;}else if(!is_redirect){var confirmation_content = jQuery(this).contents().find('.GF_AJAX_POSTBACK').html();if(!confirmation_content){confirmation_content = contents;}jQuery('#gform_wrapper_5').replaceWith(confirmation_content);jQuery(document).scrollTop(jQuery('#gf_5').offset().top - mt);jQuery(document).trigger('gform_confirmation_loaded', [5]);window['gf_submitting_5'] = false;wp.a11y.speak(jQuery('#gform_confirmation_message_5').text());}else{jQuery('#gform_5').append(contents);if(window['gformRedirect']) {gformRedirect();}}jQuery(document).trigger("gform_pre_post_render", [{ formId: "5", currentPage: "current_page", abort: function() { this.preventDefault(); } }]); if (event && event.defaultPrevented) { return; } const gformWrapperDiv = document.getElementById( "gform_wrapper_5" ); if ( gformWrapperDiv ) { const visibilitySpan = document.createElement( "span" ); visibilitySpan.id = "gform_visibility_test_5"; gformWrapperDiv.insertAdjacentElement( "afterend", visibilitySpan ); } const visibilityTestDiv = document.getElementById( "gform_visibility_test_5" ); let postRenderFired = false; function triggerPostRender() { if ( postRenderFired ) { return; } postRenderFired = true; gform.core.triggerPostRenderEvents( 5, current_page ); if ( visibilityTestDiv ) { visibilityTestDiv.parentNode.removeChild( visibilityTestDiv ); } } function debounce( func, wait, immediate ) { var timeout; return function() { var context = this, args = arguments; var later = function() { timeout = null; if ( !immediate ) func.apply( context, args ); }; var callNow = immediate && !timeout; clearTimeout( timeout ); timeout = setTimeout( later, wait ); if ( callNow ) func.apply( context, args ); }; } const debouncedTriggerPostRender = debounce( function() { triggerPostRender(); }, 200 ); if ( visibilityTestDiv && visibilityTestDiv.offsetParent === null ) { const observer = new MutationObserver( ( mutations ) => { mutations.forEach( ( mutation ) => { if ( mutation.type === 'attributes' && visibilityTestDiv.offsetParent !== null ) { debouncedTriggerPostRender(); observer.disconnect(); } }); }); observer.observe( document.body, { attributes: true, childList: false, subtree: true, attributeFilter: [ 'style', 'class' ], }); } else { triggerPostRender(); } } );} );
Two out of three options suggested that IPCC co-chairs continue work on reports in 2027 "without prejudging the panel's agreement on the timing of the respective approval sessions" and for timeline discussions to be continued at a future session.
Another suggestion was that the IPCC fund a second delegate for developing countries and "economies in transition" for future approval sessions.
After one delegation said they were uncertain how to engage with the draft text, Skea clarified the text had three elements - a preamble, timeline and a section on inclusivity and avenues for providing input.
He said that "it was clear the panel would not be able to take a decision on the timeline at IPCC-65" and explained the idea was to include the four timeline options that emerged from the contact group in an annex "in order to capture progress made during IPCC-65".
After countries were not able to agree on the draft decision, Skea suspended the meeting at 8:29pm on Friday.
He noted that it would no longer be inclusive for the meeting to continue, given that a number of delegations from developing countries had left.
Earlier in the plenary, Antigua and Barbuda's delegation had emphasised that 6pm was its deadline and noted that representatives of other small-island developing states had departed. Nepal's negotiating team had also stated it was leaving.
What were the main points of disagreement?The ENB's report details how the five-day meet was beset by disagreements between country delegations on the timeline issue.
As proceedings kicked off on Monday, a significant number of countries set out their position on whether publication of the reports should occur before, or after, the global stocktake.
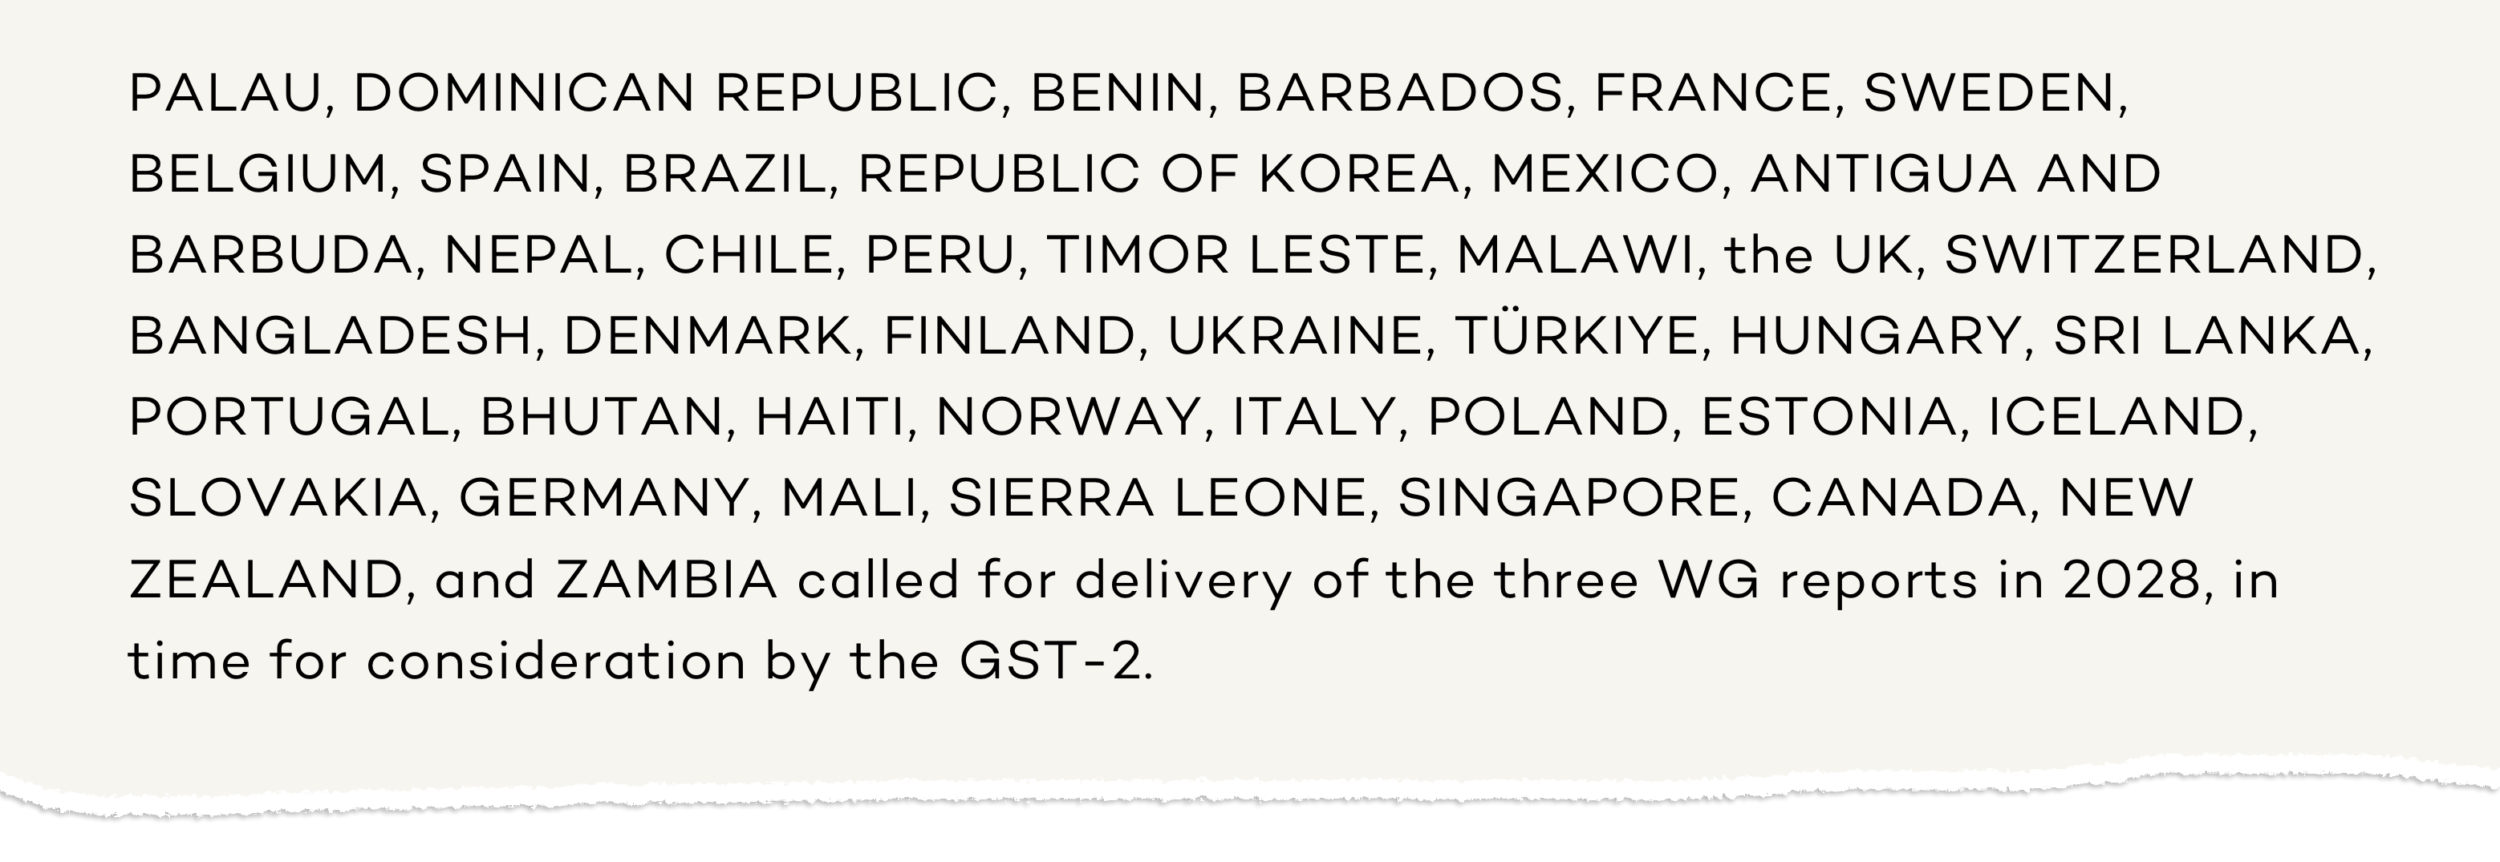
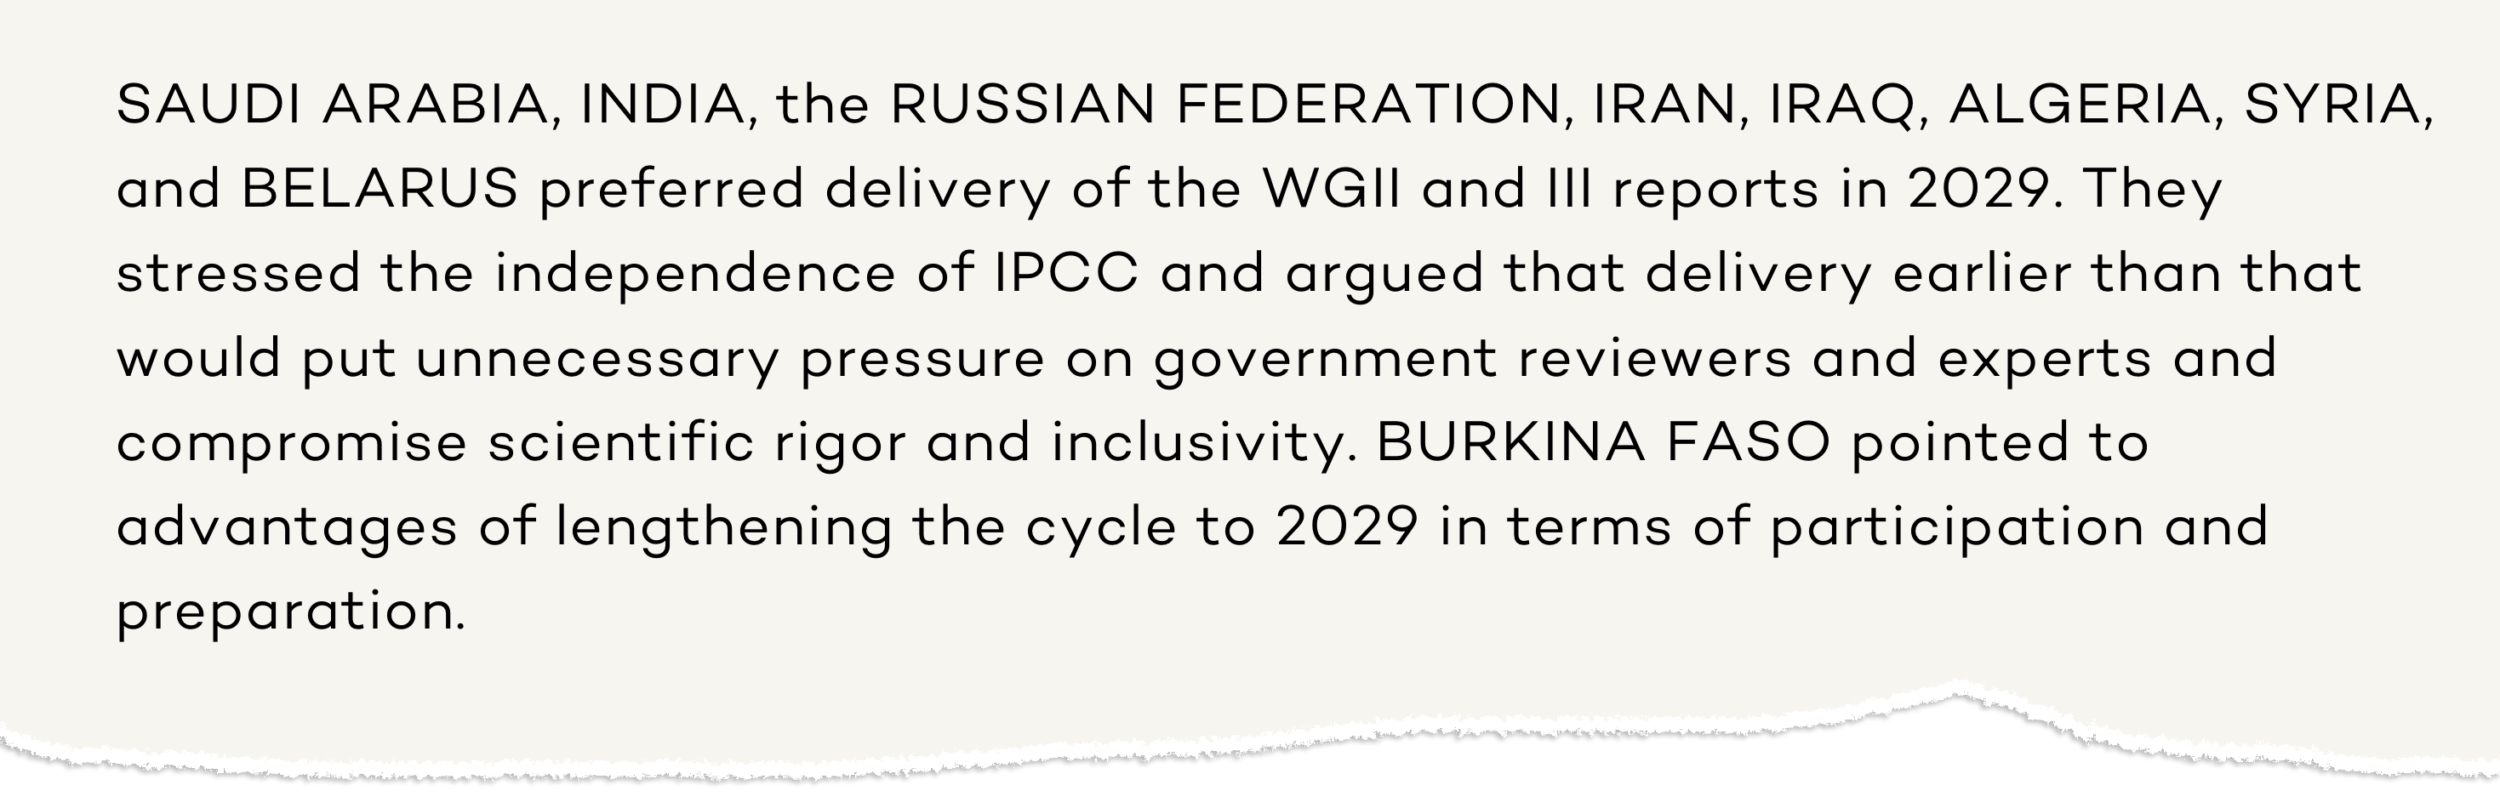 Credit: ENB
Both camps cited inclusivity concerns. Those in favour of a stocktake-aligned timeline said that "inclusivity is a priority and should be addressed, but said delaying delivery of the report would further disadvantage the countries most vulnerable to climate change", according to the ENB.
In discussions on Monday, the Pacific island nation of Vanuatu underscored that "every year of delay is a year in which communities on the frontlines bear losses that cannot be measured or claimed", the ENB says. The delegation pointed to the International Court of Justice's 2025 advisory opinion that countries have binding obligations to protect the climate.
The Netherlands delegation said it was "inconceivable" that two years before the conclusion of second global stocktake, the "body created to produce scientific advice accepts it will not deliver working group reports on mitigation and adaption, while the [IPCC co-chairs] say it is possible", according to the ENB.
But other countries emphasised that the global stocktake could draw from other sources of science if the reports were not ready in time, the ENB notes.
China's delegation opposed the IPCC holding more than three plenaries each year and said IPCC reports did not need to be linked to the global stocktake. Kenya said that publishing reports after the stocktake "did not mean science would not inform policy".
Also among those to argue for a longer timeline were Iran and Iraq, with the latter underscoring the importance of participating in IPCC processes on an "equal footing" with other governments, the ENB says.
There were also disagreements over the specific mandate of the contact group set up by Skea on Monday to advance the timeline question. This debate endured well into the end of the week and days after the contact group had started its work.
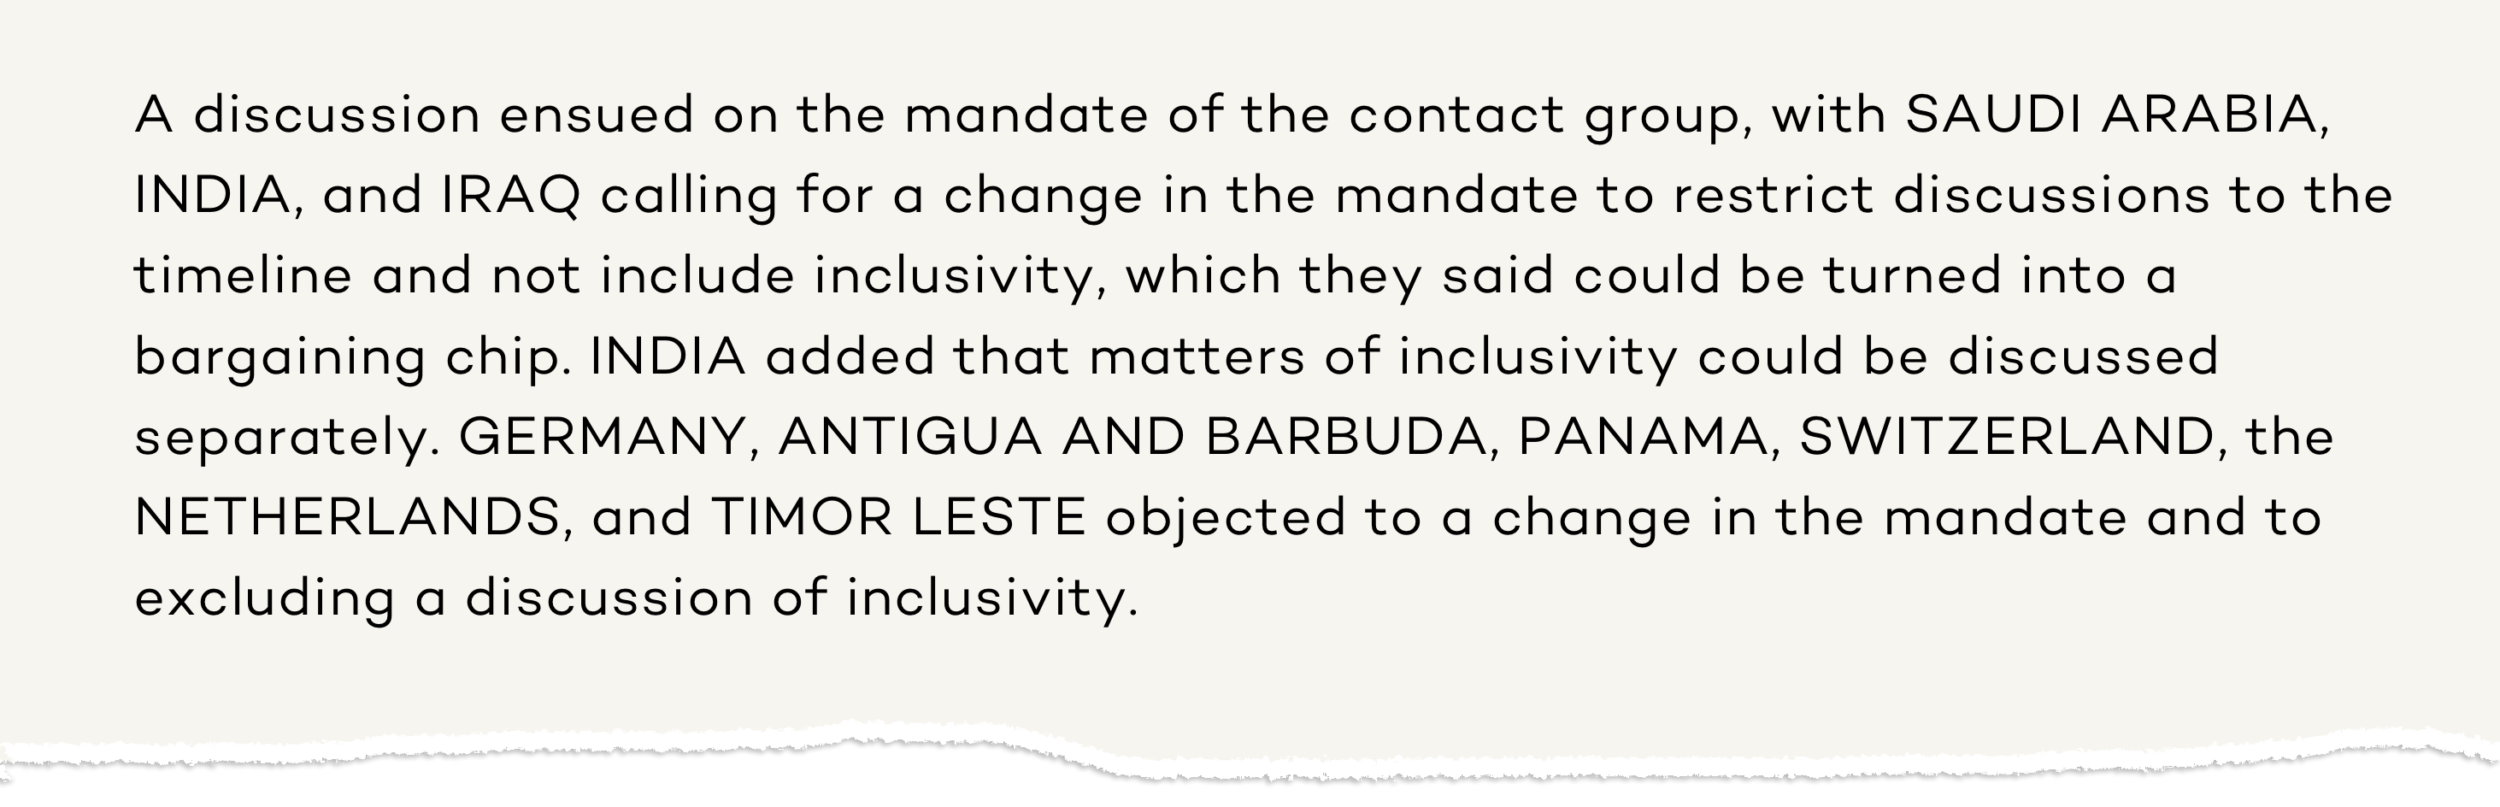 Credit: ENB
Countries pushed back on each others' characterisation of the different timeline options. Proponents for a longer timeline described plans where reports were published in 2028 as "rushed", whereas those who wanted all reports published in time for the stocktake referred to the longer timeline as "delayed" or "significantly extended", according to the ENB.
Countries also failed to reach consensus on the draft timeline decision presented to plenary on the last day of the meeting.
While some countries - including Antigua and Barbuda, Costa Rica, France, Germany, Hungary, Italy, Kiribati, Marshall Islands, Mexico, the UK and Uruguay - detailed their preference for particular passages of the IPCC secretariat's text, others rejected it outright.
For example, Algeria, India, Iraq and Saudi Arabia stated the draft text could not serve as a basis for work or decisions, according to ENB. India, meanwhile, argued that it could not engage in the decision as the contact group reached "no clear conclusion".
In an analysis of developments at IPCC-65, the ENB states that discussions in Ethiopia had revealed "room to compromise" between countries.
 Credit: ENB
It continues that "most countries" in attendance had stressed the importance of not deviating from a tradition where the IPCC follows the advice of working group co-chairs when it comes to the schedule for production of assessment reports.
In this case, that would mean agreeing to publish all three working group reports in 2028 "on a timeline that the co-chairs consider feasible and meets all the criteria for IPCC reports" (option one in table above).
In a statement shared with Carbon Brief after the meeting, Marshall Islands climate envoy Tina Stege said that it was a "travesty that a handful of countries continue to delay the IPCC's reports - the science we need back home to help us save lives and livelihoods". She continued:
"We were here to work, but found every proposal dismissed - on inclusivity, on the relevance of the science for our national planning, on the necessity of evidence to inform the next global stocktake. Progress was blocked, down to the end - a shameful play for time when there is no time to waste."
Why is the IPCC in a 'serious funding crisis'?Inextricably linked with the AR7 timeline is the IPCC's budget, which - among other things - allocates money for its author meetings and approval sessions, including support for experts from developing countries.
Throughout the meeting in Addis Ababa, governments and the IPCC leadership repeatedly emphasised that the IPCC is "facing a serious funding crisis", the ENB says.
At the start of the meeting, the IPCC's secretariat presented a proposed budget for 2026-29, which would cover the core work of AR7. This was submitted "against the backdrop of growing annual deficits and a progressively declining cash balance, raising significant concerns about the financial sustainability of the IPCC trust fund", the document says.
The trust fund is made up of ongoing contributions from its parent organisations, the World Meteorological Organization (WMO) and UN Environment Programme (UNEP), in addition to voluntary contributions from its member governments and the UNFCCC.
The budget proposal notes that an "insufficient level of voluntary contributions" now "risks the successful completion of the AR7 cycle".
Contributions in 2025 were 5.3m Swiss francs (£4.8m) lower than 2023, while costs have risen, the secretariat notes. As of the start of July, just 16 countries and organisations had contributed in 2026, totalling 2.8m Swiss francs (£2.6m).
These donors include the EU, UK, WMO, UNFCCC and UNEP, as well as Australia, Canada, Hungary, Luxembourg, New Zealand, Norway, Peru, South Africa, Sweden, Switzerland and Trinidad and Tobago.
Despite being its largest donor historically, the US has not contributed financially to the IPCC since 2024 - before the second term of US president Donald Trump.
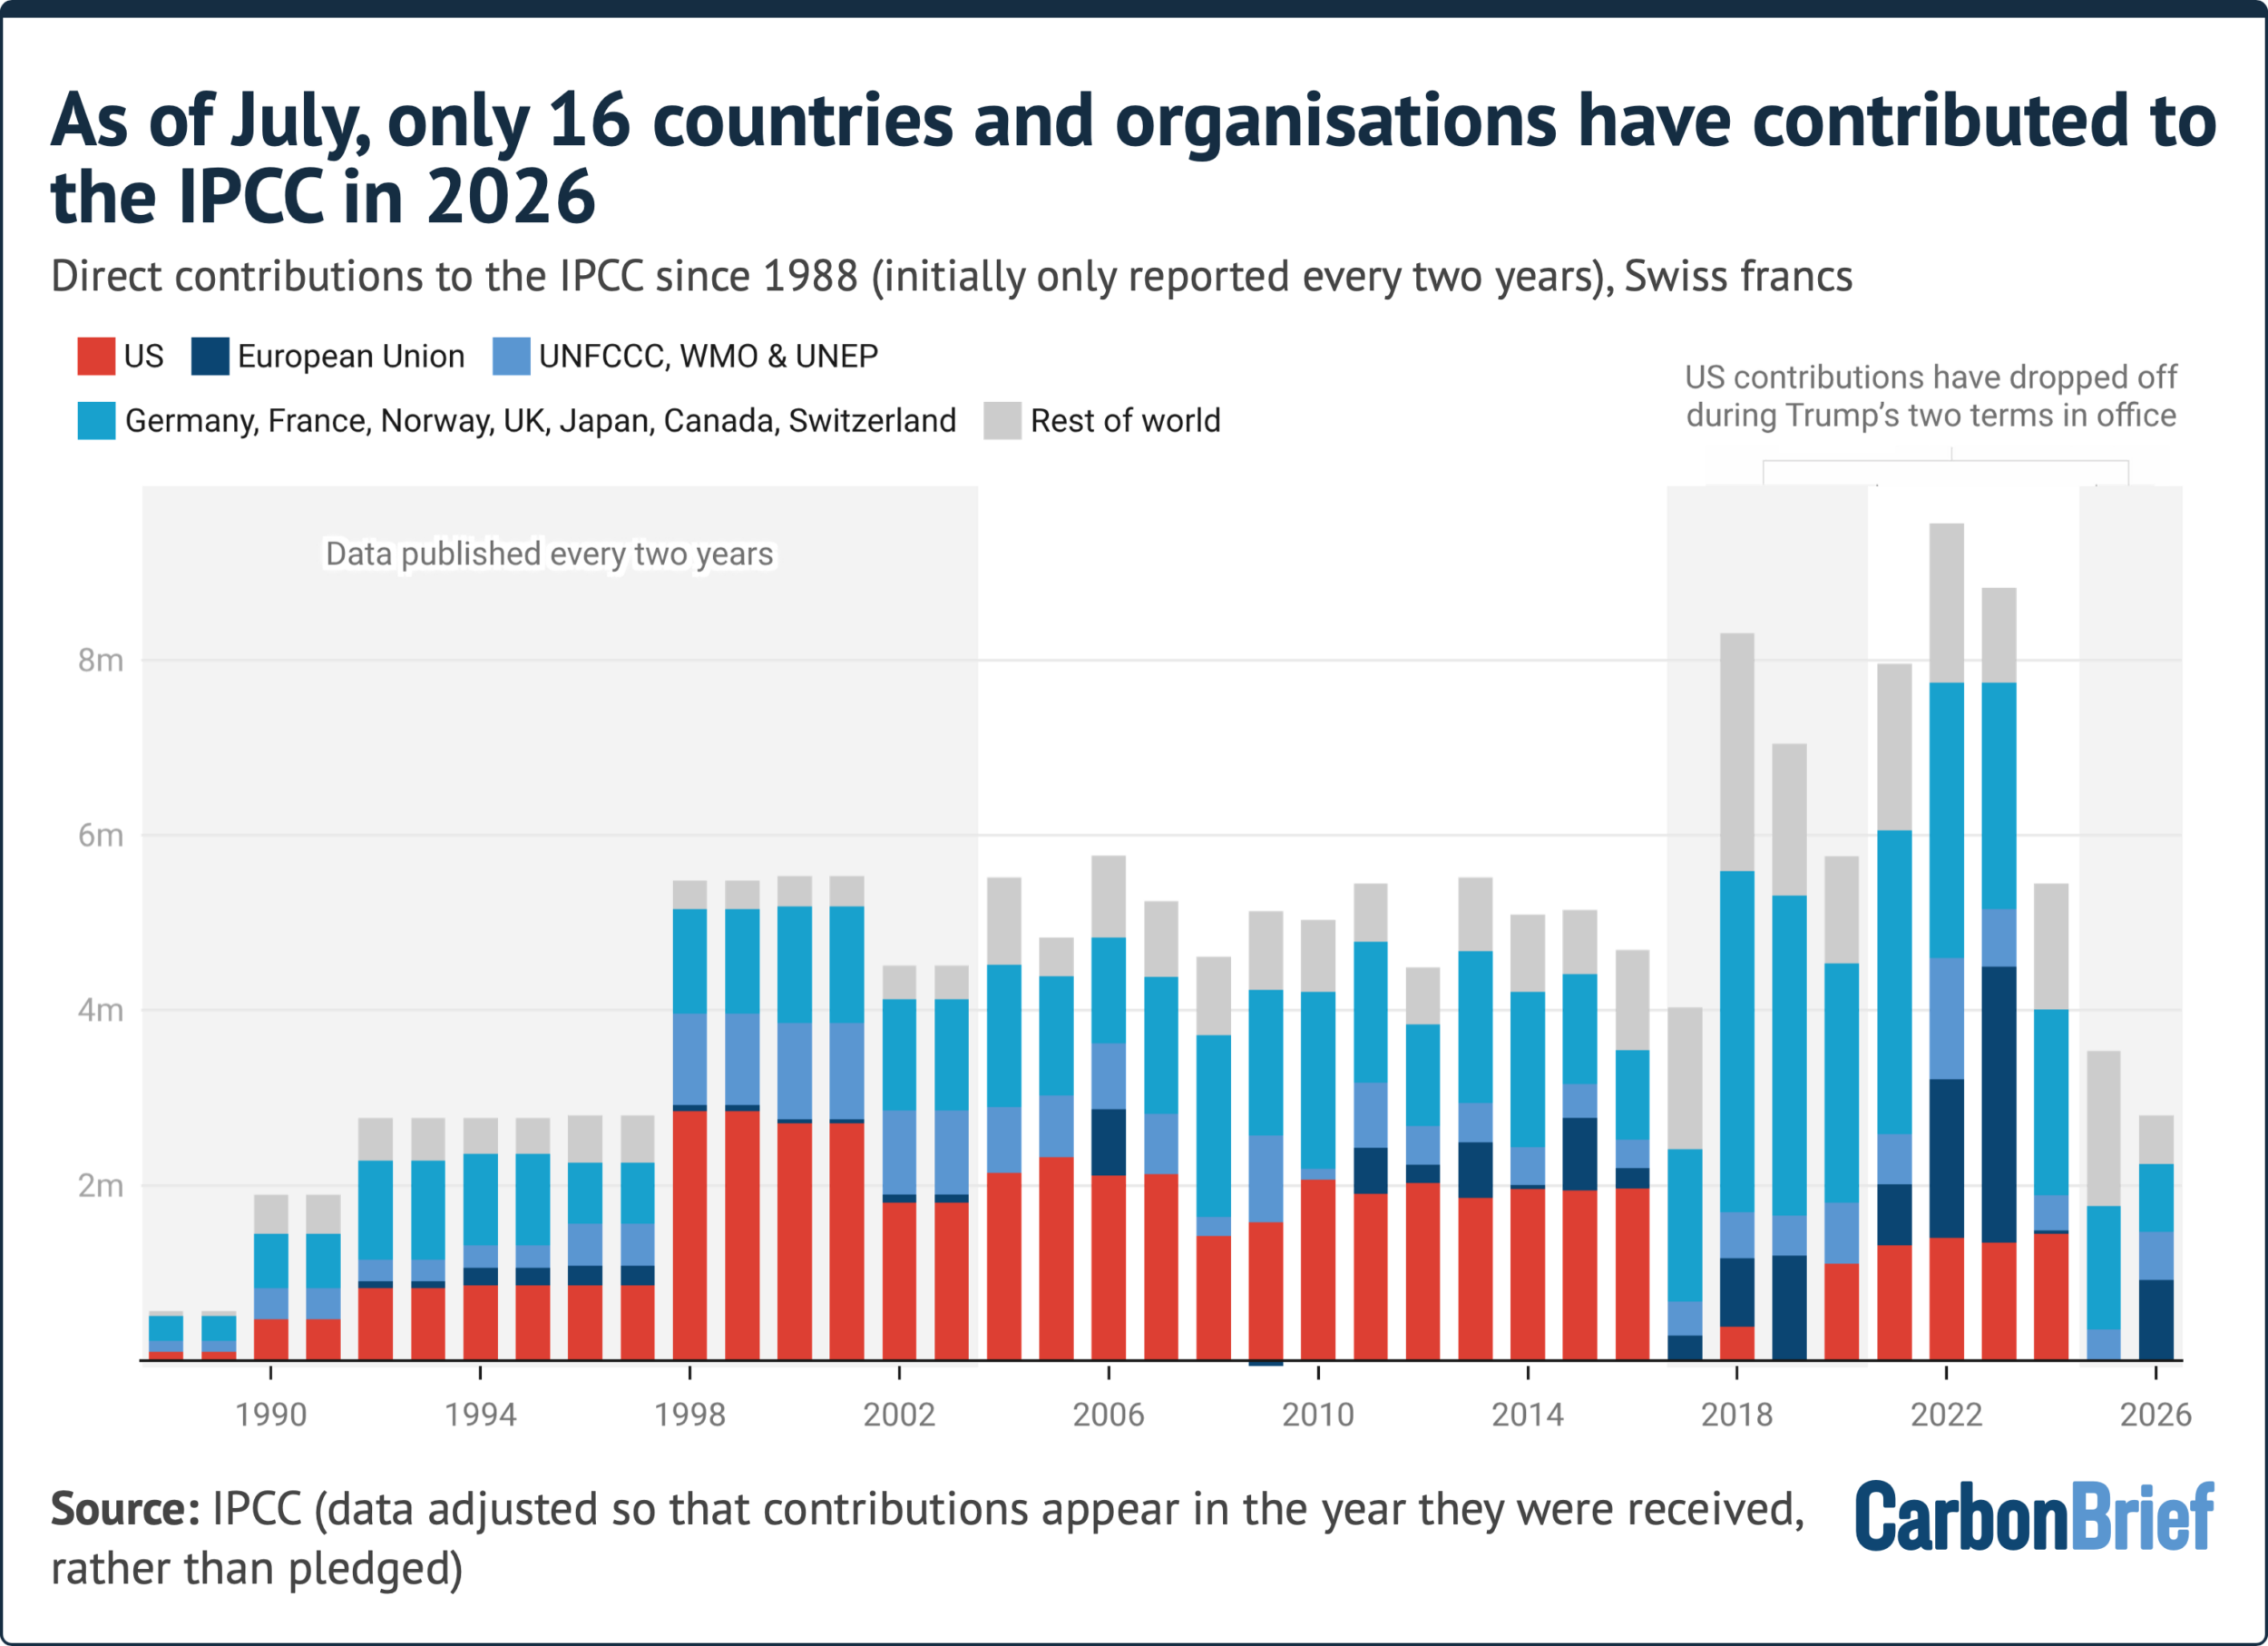 Chart showing the largest direct contributors to the IPCC since its inception in 1988, with the US (red bars), EU (dark blue) and UNFCCC/WMO/UNEP (mid blue) highlighted. Grey bars show all other contributors combined. Figures for 2026 are January to June inclusive. Figures for 1988-2003 are reported per two years, so these totals have been divided equally between each year. Source: IPCC (2025) and (2010). Contributions have been adjusted, as per IPCC footnotes, so they appear in the year they are received, rather than pledged.
According to its proposed budget, the secretariat says it needs approximately 33m Swiss francs (£30m) to complete AR7 - equivalent to just over 8m Swiss francs (£7.2m) per year. At the level of contributions received in 2025, the IPCC trust fund would be "depleted by the end of 2028, preventing the IPCC from delivering the AR7 reports", the document warns.
As a minimum, the IPCC needs 5.8m Swiss francs (£5.3m) per year in contributions to "enable the successful completion of the cycle", the secretariat adds, although this would leave "no financial buffer for unforeseen circumstances".
At the meeting, "many countries expressed concern" about the IPCC's financial situation and "called for existing donors to increase their contributions", says the ENB.
Iceland and Ireland said they "anticipated" making contributions soon, the ENB says, while others - including Azerbaijan, China, Finland and the EU - "assured" the IPCC of their continued support.
However, according to the ENB summary, the meeting struggled to agree on a number of points, including whether budget discussions should be paused until a timeline for AR7 had been agreed, and the work of the "Financial Task Team" (FiTT).
An FiTT is assembled for each assessment cycle for "reviewing income and expenditures, assisting in preparing the budget proposals and developing other recommendations related to finance for consideration by the panel", according to the IPCC.
The IPCC established the FiTT for AR7 at its 60th session in Istanbul in January 2024. It is co-chaired by Kenya and Australia, with core team members from the Bahamas, Norway, Saudi Arabia and the US. Other government representatives can also participate.
Midway through the meeting, FiTT co-chair Patricia Nying'uro from Kenya reported to the plenary that they had been "unable to advance" on reviewing the budgets beyond 2026, with disagreements on whether "budget lines should remain or be deleted", reports the ENB.
The attempts to remove whole budget lines drew expressions of "deep concern and disappointment" from other countries, the ENB says, with many noting that the work of the FiTT is "purely technical and has never been controversial".
 Credit: ENB
Belize, France, Germany, Panama and the Netherlands specified that "two delegations have threatened to have no budget if their conditions are not met", the ENB says, with even budget lines for activities already agreed being "taken hostage".
The ENB notes that both Saudi Arabia and India expressed concern that certain lines in the 2027 budget "favoured one option" for the AR7 timeline. Both countries opposed using the proposed budget as a basis for discussion in the FiTT, the ENB says.
The ENB quotes Prof Skea, who noted that most of the budget lines apply to all options for the timeline and was puzzled that members seemed to "disagree about things they don't disagree about".
A way forward was found for the FiTT to continue its discussions - despite Saudi Arabia's accusing the secretariat of "blatant bias", says the ENB. However, further disagreements arose over budget lines for approval meetings in 2027 to extend financial support for developing countries to bring two representatives rather than one.
 Credit: ENB
Skea noted that despite "almost universal" support for increased participation of developing countries in IPCC sessions, the plenary discussions had continued for two and a half hours without agreement. He asked the timeline contact group to take up the issue.
Discussions on the rest of the budget continued in the FiTT, but "there were no further reports to plenary" before the meeting was suspended, the ENB says.
In the evening of the meeting's final day, with no agreement on the timeline, Skea asked delegates to consider approving the proposed budgets for 2026 and 2027 to allow work on AR7 to continue. According to the ENB, Saudi Arabia, India and Russia objected.
The Democratic Republic of the Congo warned that the delay to agreeing the budgets was an "immediate danger to the viability" of the panel.
 Credit: ENB
How have scientists reacted?
According to the ENB, Skea said in his closing address that if there were stronger words than "profound disappointment," he would use them.
He noted that recent months had been "some of the most turbulent for the panel" and characterised IPCC-65 as "among the most difficult IPCC meetings", it says.
It remains to be seen when discussions on the AR7 timeline and budget will restart.
A statement from Skea released after the meeting detailed plans to reconvene the plenary "at the earliest opportunity so the panel can effectively conclude its business".
The IPCC declined Carbon Brief's request for an interview with Skea, with a spokesperson noting it could not "discuss a plenary that had not yet finished its work".
On Monday, nearly 120 scientists currently drafting the AR7 reports had signed an open letter where they pledged to "keep working" on the reports.
The report authors said they remained committed to delivering the assessments "in a manner that is rigorous, timely and inclusive". The letter also stresses the "world should not have to face" the second global stocktake without the IPCC's latest reports.
In a statement, Dr Bill Hare, CEO of Climate Analytics, called for discussions to be resumed this year. He said:
"Urgent agreement is now needed to give planning security to the voluntary [report] authors, more than half of which are from developing countries and to safeguard a timeline that sees all WG reports published in 2028, in time to inform the second global stocktake.
"A resumed IPCC-65 session still this year, whichever way possible, is essential to at the very least agree to the IPCC's 2027 budget to allow work to continue."
Prof Fabrice Lambert, a contributing author of WG1 and Chilean government delegate, wrote on LinkedIn that there was now a "clear need for professional negotiators and experienced facilitators" from UN bodies to help organise and run panel sessions. He continued:
"Discussions have moved too far beyond the scientific questions that should be the IPCC's mainstay. Bringing in that expertise could facilitate breakthroughs that have eluded us for so many sessions during AR7."
The IPCC has also not yet confirmed the date and location of its next plenary session, IPCC-66.
What other issues remain unresolved?After every IPCC meeting, the organisation writes a report summarising the discussion. However, the IPCC has failed to sign off on the reports for its past four sessions.
The first item on the agenda for last week's IPCC meeting was the approval of these four draft reports. To open the discussion on Monday, Skea proposed developing guidelines for producing these meeting reports, the ENB says.
Belgium, France and the Netherlands suggested publishing full transcripts of the meetings in addition to the meeting reports. Panama supported the idea, "emphasising the need for transparency", the ENB says. However, it adds that Saudi Arabia opposed the suggestion.
Saudi Arabia said it objected to the "highly selective manner" in which the draft meeting reports outlined certain topics in more detail than others, arguing that this "distorted [their] balance".
Meanwhile, Belgium and Germany opposed the use of the passive voice in the meeting reports, arguing this gave an impression that all opinions are "equally supported". They said that this resulted in a "skewed way of presenting discussions", the ENB says.
IPCC vice-chair Prof Diana Ürge-Vorsatz led a huddle to continue the discussion. She reported back at the end of the week that the group had reached a "preliminary agreement" for the "principles for producing meeting reports", the ENB notes:
"She said the discussion focused on how to record diverging views, as some panel members felt separating out two or three countries invited unwelcome attention or misinterpretation.
"Ürge-Vorsatz said the huddle agreed to group arguments, first identifying countries representing one perspective and elaborating on their argument, then identifying countries representing the other side of arguments. The secretariat will decide on the granularity of reporting."
The panel requested that the IPCC secretariat prepare revised draft meeting notes in accordance with the new guidance. It decided to "submit the revised draft reports for consideration by the panel at its next working session".
The IPCC also agreed to defer consideration of a review of its principles and procedures to a future meeting, after India, Iran, Russia and Saudi Arabia argued that there was not enough time to discuss the issue thoroughly, the ENB reports.
These documents are typically reviewed every five years. However, the last review was delayed due to the Covid pandemic.
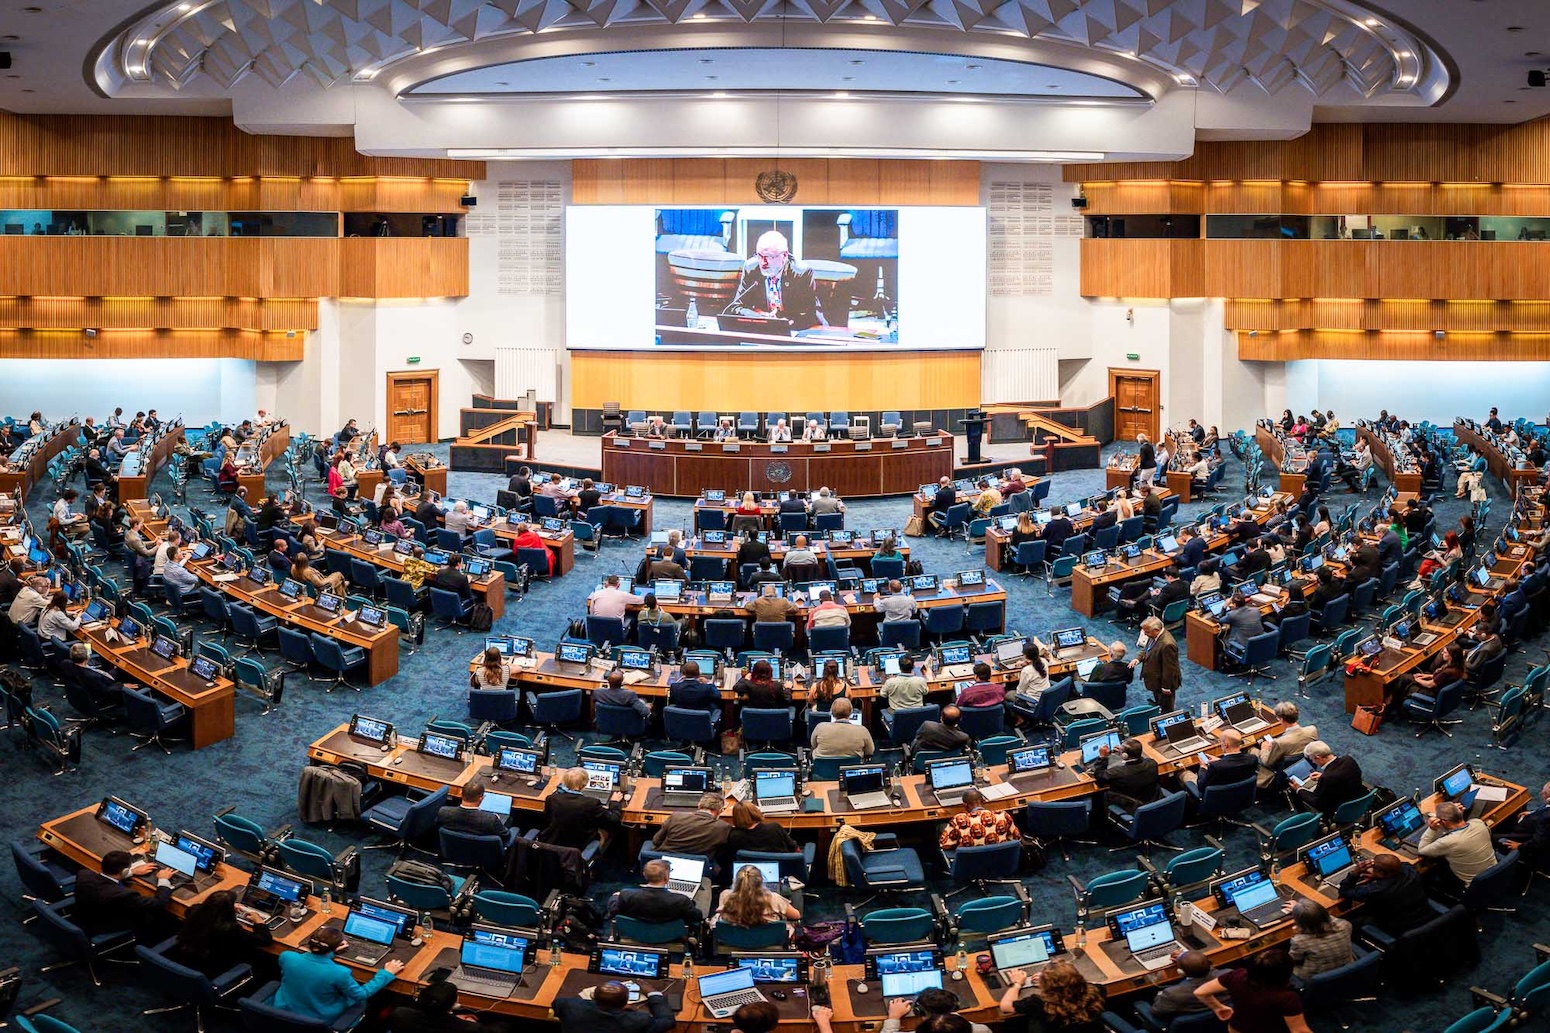 Credit: IISD/ENB | Danny Skilton
How are the IPCC AR7 reports progressing?
The co-chairs of each AR7 working group updated governments on how the reports themselves were progressing.
All co-chairs highlighted their working group's contribution to the special report on climate change and cities, scheduled to be published in 2027.
WG2 co-chairs Prof Winston Chow and Prof Bart van den Hurk explained to the conference floor that the second order draft of the special report was circulated for review earlier this year and received more than 25,000 comments. They added that the fourth lead author meeting was held in India in August and a final draft version is currently being prepared.
In his closing address on Friday, Skea said the progress reports presented by working-group chairs were evidence of the "ongoing achievements" of the IPCC, according to the ENB.
Noting that the IPCC's scientific work was progressing, Skea reportedly stated that, despite challenges on the timeline issue, "the engine room of the IPCC is working - and it's healthy".
The sentiment was echoed by WG1 co-chair Dr Robert Vautard, who wrote on LinkedIn after the meeting that disagreements across country delegations on the AR7 timeline were "so disconnected from the actual collaborative spirit across authors in the report making".
Nevertheless, the ENB's meeting summary cautions that the ongoing inability of governments to reach agreement on "critical issues" was now "spilling over to authors", with "serious potential consequences both for the IPCC and for the science the world depends on".
It continues that, "while the work of scientists and governments is separate, the friction that has characterised AR7 plenary sessions is now directly affecting the ability of the scientists to carry out their work".
How might the IPCC use AI and enhance gender inclusivity?On Tuesday afternoon, Mxolisi Shongwe, programme officer at the IPCC secretariat, told the plenary that a workshop on IPCC "methods of assessment" was held in February 2026, which featured discussions on artificial intelligence (AI).
He added that the IPCC bureau - made up managerial roles including the IPCC chair, vice-chair and co-chairs of working groups - decided to establish an "informal group" on AI that would provide advice on the "responsible use of AI and emerging digital technologies in IPCC processes".
India and Russia "expressed concerns about lack of transparency in [the] use of AI in scientific research", according to the ENB. Burundi and Iran highlighted the need for disclosure and human oversight in AI-produced material, while Congo asked how AI has so far been used by the IPCC.
After discussions about the terms of reference for the informal group on AI, the panel agreed that any guidance or recommendations that it produced will be "subject to subsequent confirmation by the panel".
Separately, vice-chair Ürge-Vorsatz reported on the progress of the IPCC's gender action team, explaining that the group had finalised the report of the IPCC expert meeting on gender, diversity, equity and inclusivity.
The gender action team "aims to enhance gender equality in IPCC processes through monitoring, accounting for gender in decisions, including diversity in nominations and appointment", according to the IPCC website.
Dozens of countries commented on the update. Luxembourg, supported by nine other countries, invited the panel to consider expanding the mandate of the gender action team to include "gender diversity, equity and inclusion".
However, Saudi Arabia opposed expanding the mandate of the gender action team, arguing it risked "diluting" the team's work.
To close the discussion on Tuesday, Skea suggested the gender action team consider expanding its mandate and bring suggestions to IPCC-66.
Related Factcheck: Trump's false claims about the IPCC and 'RCP8.5' climate scenario
19.05.2026
AR7
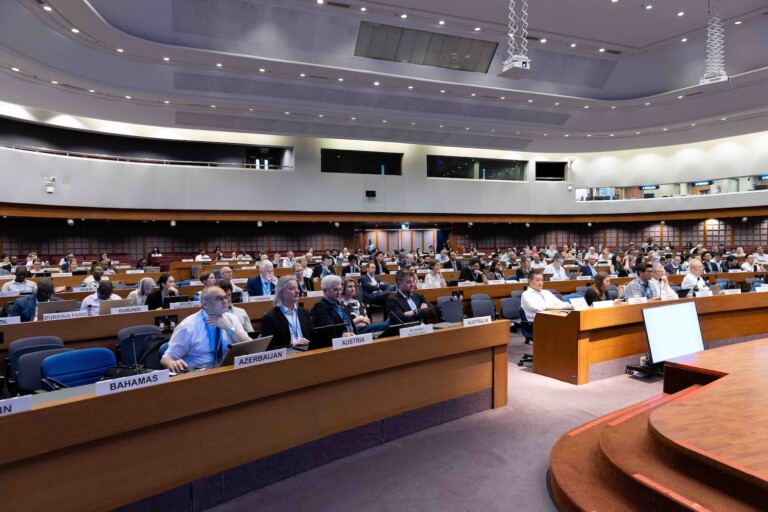 Q&A: Why the standoff between nations over the next IPCC reports matters
02.04.2026
AR7
 IPCC: 'Frustrating and disappointing' meeting leaves AR7 timeline in deadlock
01.04.2026
AR7
 Q&A: What Trump's US exit from UNFCCC and IPCC could mean for climate action
09.01.2026
AR7
The pos
Some 58% of countries have met a UN call to submit new pledges on addressing nature loss - two years after the original deadline - according to Carbon Brief analysis.
Countries were asked to submit new pledges, known as national biodiversity strategies and action plans (NBSAPs), by the start of the COP16 biodiversity summit in October 2024.
After only 15% of nations met the original deadline, countries agreed at the summit to a new text that "urges" countries to release their NBSAPs "as soon as possible".
Carbon Brief analysis shows that 113 countries have now come forward with new NBSAPs - up from 55 nations a year ago.
Countries will gather in Yerevan, Armenia, next week for COP17.
COP17 marks the halfway point of the Kunming-Montreal Global Biodiversity Framework (GBF), a landmark agreement made in 2022 to reverse nature decline by 2030.
The summit will provide the stage for the first global review of countries' progress towards meeting the targets of the GBF.
Global reviewIn Montreal, Canada, in 2022, nearly every country in the world agreed to the GBF. The overall "mission" of the framework is to "halt and reverse" biodiversity loss by 2030.
The GBF includes a list of 23 targets for 2030. They cover an expansive range of topics, including restoring ecosystems, addressing climate change and providing developing nations with finance to help cover the costs of protecting nature.
As part of the GBF and its underlying documents, countries agreed to a schedule for monitoring their progress towards achieving the 2030 targets.
This included the preparation of a "global report" of progress coordinated by the UN, which will inform a "global review" undertaken by countries at COP17.
The global report draws on countries' NBSAPs and national targets. It also draws on countries' seventh national reports, which were due to be submitted to the UN in February of this year.
Carbon Brief analysis shows that 113 out of 196 parties (58%) have now met the call to produce a new NBSAP - up from 55 nations just a year ago.
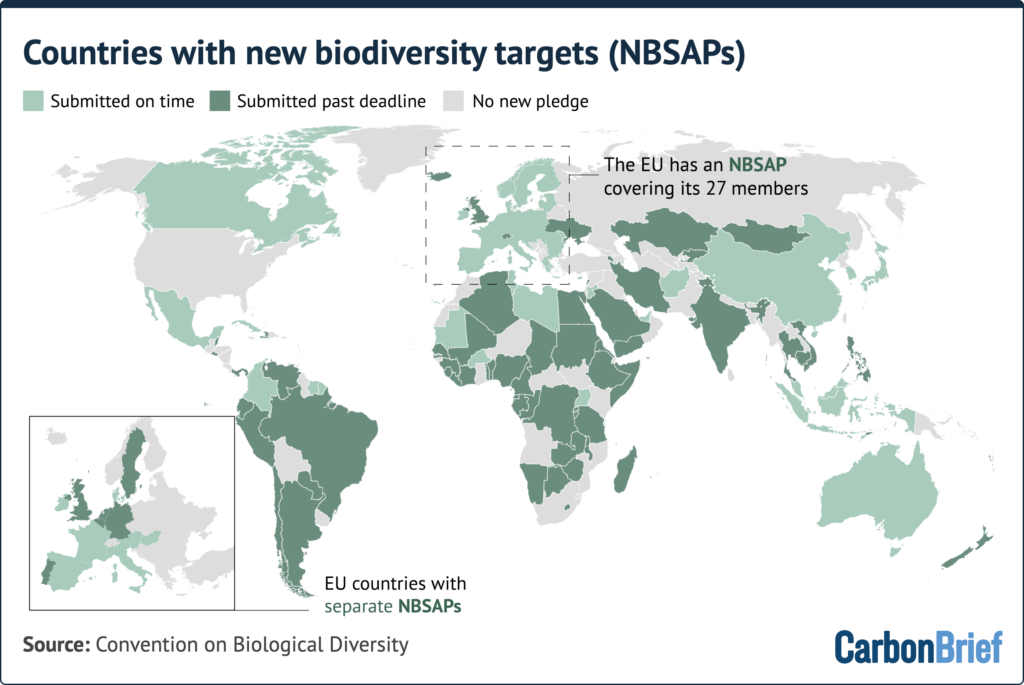 Map by Carbon Brief.
Since last year, many African nations have now published new NBSAPs.
African countries that have released new plans in the last year include: Algeria, Benin, Botswana, Cameroon, Comoros, Congo, Côte d'Ivoire, the Democratic Republic of Congo, Egypt, Equatorial Guinea, Eritrea, Ethiopia, Gabon, Gambia, Guinea, Lesotho, Liberia, Madagascar, Malawi, Mali, Namibia, Rwanda, Senegal, Sierra Leone, Somalia, Sudan, Zambia and Zimbabwe.
More South American nations have also published new NBSAPs. This includes Brazil - the world's most biodiverse nation - as well as Belize and Chile.
COP17 host nation Armenia published its new NBSAP in April.
According to the GBF and its underlying documents, countries that were "not in a position" to meet the deadline to submit NBSAPs ahead of COP16 were requested to instead submit national targets.
Unlike NBSAPs, national targets simply list biodiversity goals that countries will aim for, without an accompanying plan for how they will be achieved.
Four of the world's megadiverse nations - countries that account for the majority of Earth's species - have not yet published new NBSAPs. These countries are Papua New Guinea, Peru, South Africa and the US.
The US is the only UN member country that is not a signatory to the UN Convention on Biological Diversity.
The country with the most land on Earth, Russia, has also not produced a new NBSAP.
By the end of COP16, some 119 parties had produced at least one national target. Two years later, this figure has risen to 175, or 89% of countries.
In addition, around half of countries met the deadline to produce their seventh national reports by February of this year. This figure has now risen to 73% of countries.
Over the past two years, many developing countries have expressed concerns that a lack of available funding has prevented them from publishing their NBSAPs.
A spokesperson for the Global Environment Facility (GEF), the multilateral fund that provides funding to help with the preparation of NBSAPs, told Carbon Brief in 2025 that 120 out of 139 countries that had requested financial support since COP16 had been able to access it.
The spokesperson added that the UN Environment Programme was "working to resolve outstanding issues" to allow the remaining 19 countries to access financial assistance.
Related
COP17: Tracking progress towards the UN's 2030 nature targets
15.10.2026
COP17 Yerevan
COP17: Developed countries 'fall far short' of UN targets for nature finance
15.10.2026
COP17 Yerevan
 Interactive: Tracking negotiating texts at the COP17 biodiversity summit
12.10.2026
COP17 Yerevan
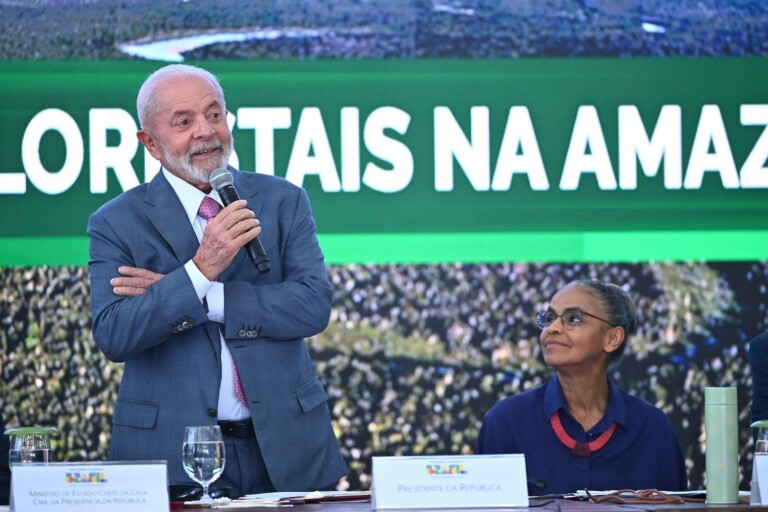 Analysis: Lula presidency saved at least 20,000km2 of Brazilian Amazon since 2022
28.09.2026
International policy
The post COP17: Which countries have released new pledges to tackle nature loss? appeared first on Carbon Brief.
Countries will meet in Armenia this month to carry out the first global review of progress towards meeting key nature targets by 2030.
These targets - and the wider ambition to halt and reverse biodiversity loss around the world - were agreed in the landmark Kunming-Montreal Global Biodiversity Framework in 2022.
But the ambitions will not be achieved in time for the 2030 deadline unless action "accelerates rapidly", a key UN report found.
It noted that nations are falling short on 22 of 23 nature targets, which focus on restoring ecosystems, increasing nature finance and reducing harmful subsidies.
This report and other findings will inform the global progress review taking place at the COP17 biodiversity summit in Armenia over 19-30 October.
The sections below summarise the report's findings on where progress has - and has not - been made on each of the 23 targets.
They also rank the extent to which countries have addressed elements of each target on a national basis. Click on each target for more information. Key terms are defined throughout each section and in a glossary below.
The post COP17: Tracking progress towards the UN's 2030 nature targets appeared first on Carbon Brief.
The amount of finance for nature delivered to date "falls far short" of what is needed to meet the UN's global goals, according to a report released ahead of the COP17 biodiversity summit.
The global stocktaking report, prepared by the UN Convention on Biological Diversity (UN CBD) ahead of this month's summit in Armenia, finds that developed nations are failing to close the $200bn "biodiversity finance gap".
Initiatives designed to support this goal are also stumbling, with a special "framework" fund for biodiversity receiving less than $140m from developed countries in the past two years and the "landmark" Cali Fund receiving only $6,000 from private companies.
The availability of finance - or lack thereof - is likely to be a key point of contention in negotiations at COP17 in Yerevan, Armenia, which begin on 19 October.
Target for 2025 'not achieved'At COP15 in 2022, 196 countries agreed to an ambitious global deal to reverse biodiversity loss by 2030, dubbed the Kunming-Montreal Global Biodiversity Framework (GBF).
Goal D of the agreement, shown below, states that countries must "close" a $700bn "biodiversity finance gap" by 2030.
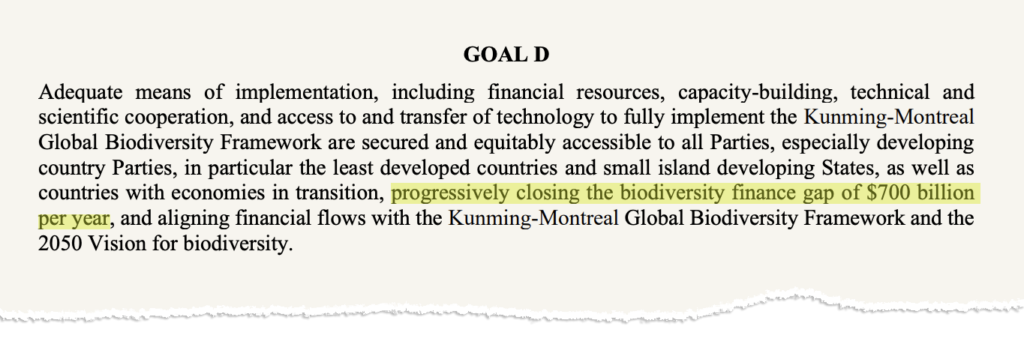 Goal D of the Kunming-Montreal Global Biodiversity Framework.
This overall $700bn is made up of two parts: changes to nature-harming subsidies; and raising financial resources to support biodiversity.
Target 18 within the text calls for countries to "identify by 2025, and eliminate, phase out or reform incentives, including subsidies, harmful for biodiversity…progressively reducing them by at least $500bn per year by 2030".
The remaining $200bn should be met by "mobilising" resources, according to target 19 of the GBF. It states that countries should "substantially and progressively increase the level of financial resources from all sources" to "at least" $200bn per year by 2030.
The overarching $200bn can be from national budgets, multilateral development banks or money "mobilised" from the private sector.
However, the target also specifically states that "at least $20bn per year by 2025 and…at least $30bn per year by 2030" should be public biodiversity funding provided to developing countries by developed countries - or others that "voluntarily assume" their obligations.
According to the global stocktaking report prepared by the CBD, between 2020 and 2023, countries mobilised a cumulative total of just $186.4bn. This is equivalent to an average of less than $50bn per year.
While the report - published on 10 September 2026 - cautions that it is "still too early to draw any conclusions", it adds that this total "falls far short" of what is needed to close the $200bn-per-year biodiversity finance gap.
It continues to specify that the milestone of raising "at least $20bn per year by 2025" in public finance was also "likely not achieved".
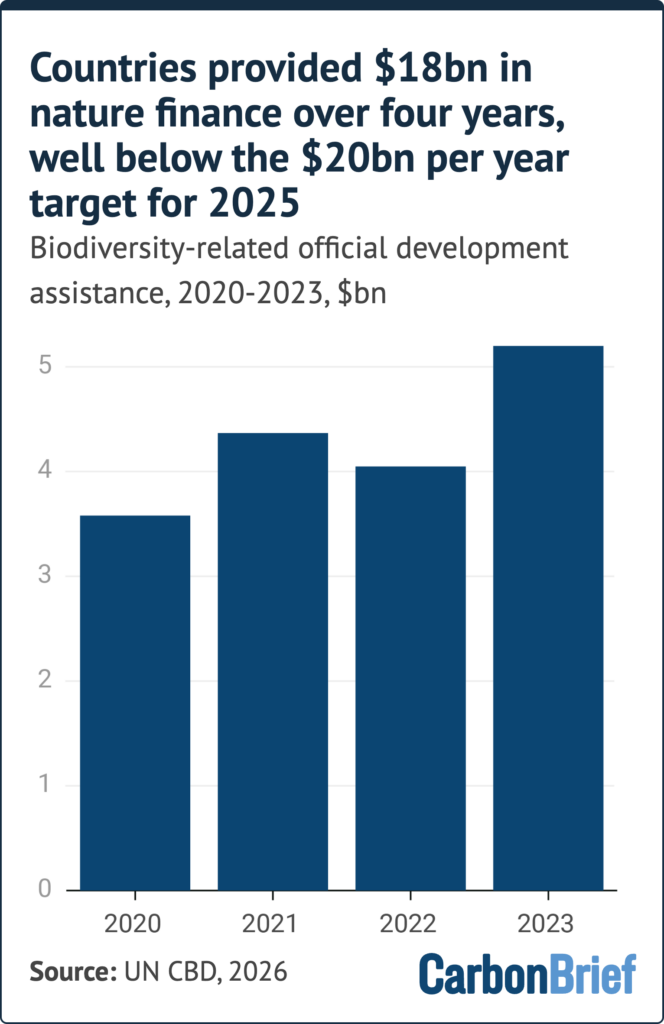
The report states that reporting countries raised a cumulative total of just $17.7bn in international public funding for biodiversity, across four years from 2020-23, as shown in the figure below. This amounts to an average of just $4.4bn per year.
These figures are supported by a report from the Organisation for Economic Co-operation and Development (OECD), which suggests that global biodiversity finance reached $74.9-92.4bn per year between 2023 and 2025.
It adds that, of this, international public finance contributed around $16.1bn per year on average - nearly $4bn below the 2025 goal.
Moreover, the OECD report says that only $7.9bn in 2023 to $8.5bn in 2024 was "biodiversity-specific" funding, with another $5.7bn and $6.5bn, respectively, coming in the form of funds for other priorities, in which support for biodiversity was a secondary aim.
While the GBF sets targets for nature finance in 2025 and 2030, developed countries should be making similar contributions every year, according to thinktank Third World Network.
Faltering initiativesThere are two main channels of international public finance that developed countries can use to meet their biodiversity finance commitments under the GBF. These are official development finance (ODF) and the Global Biodiversity Framework Fund (GBFF).
Separate figures for these channels also show financing falling behind the subtargets set out in the GBF.
This includes the Global Biodiversity Framework Fund (GBFF), which was established at COP15 in 2022.
It is currently housed under the Global Environment Facility (GEF) and reports directly to the biodiversity COP.
Despite an initial flurry of pledges for the initiative, developed nations had contributed less than $400m to the fund, as of July this year, according to data shared with Carbon Brief by the GEF.
Between August 2023 and 30 June 2026, the GBFF has received only $387.2m in signed commitments from 11 countries and one subnational government (Quebec in Canada).
The figure below shows that, after the initial pledges ahead of COP16 in 2024, there have only been a handful of new contributions to the fund.
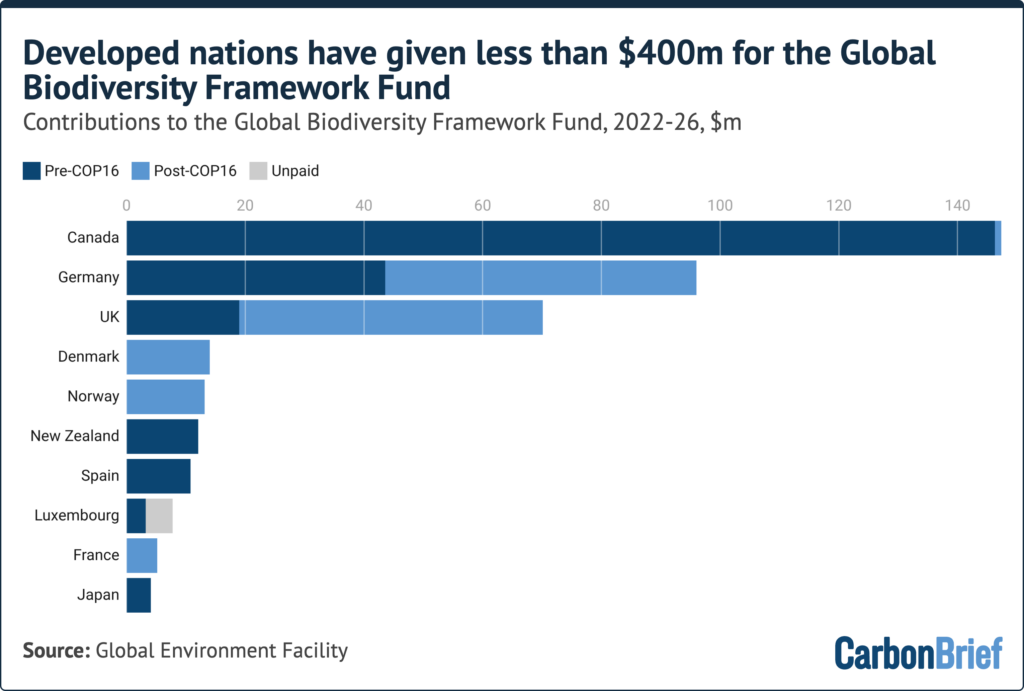
Elsewhere, the Cali fund was created at the COP16 nature negotiations in Colombia in 2024.
It is the first-ever global fund for companies profiting from genetic data to contribute to conservation goals.
According to a working paper from the Grantham Research Institute at the London School of Economics, if all 21,690 eligible firms shared their profits according to the fund's rules, they could raise $3.6bn for nature annually. The paper adds that, under a realistic uptake from companies, this could generate $929m annually for nature.
To date, however, the fund has received only two contributions, totalling $6,000.
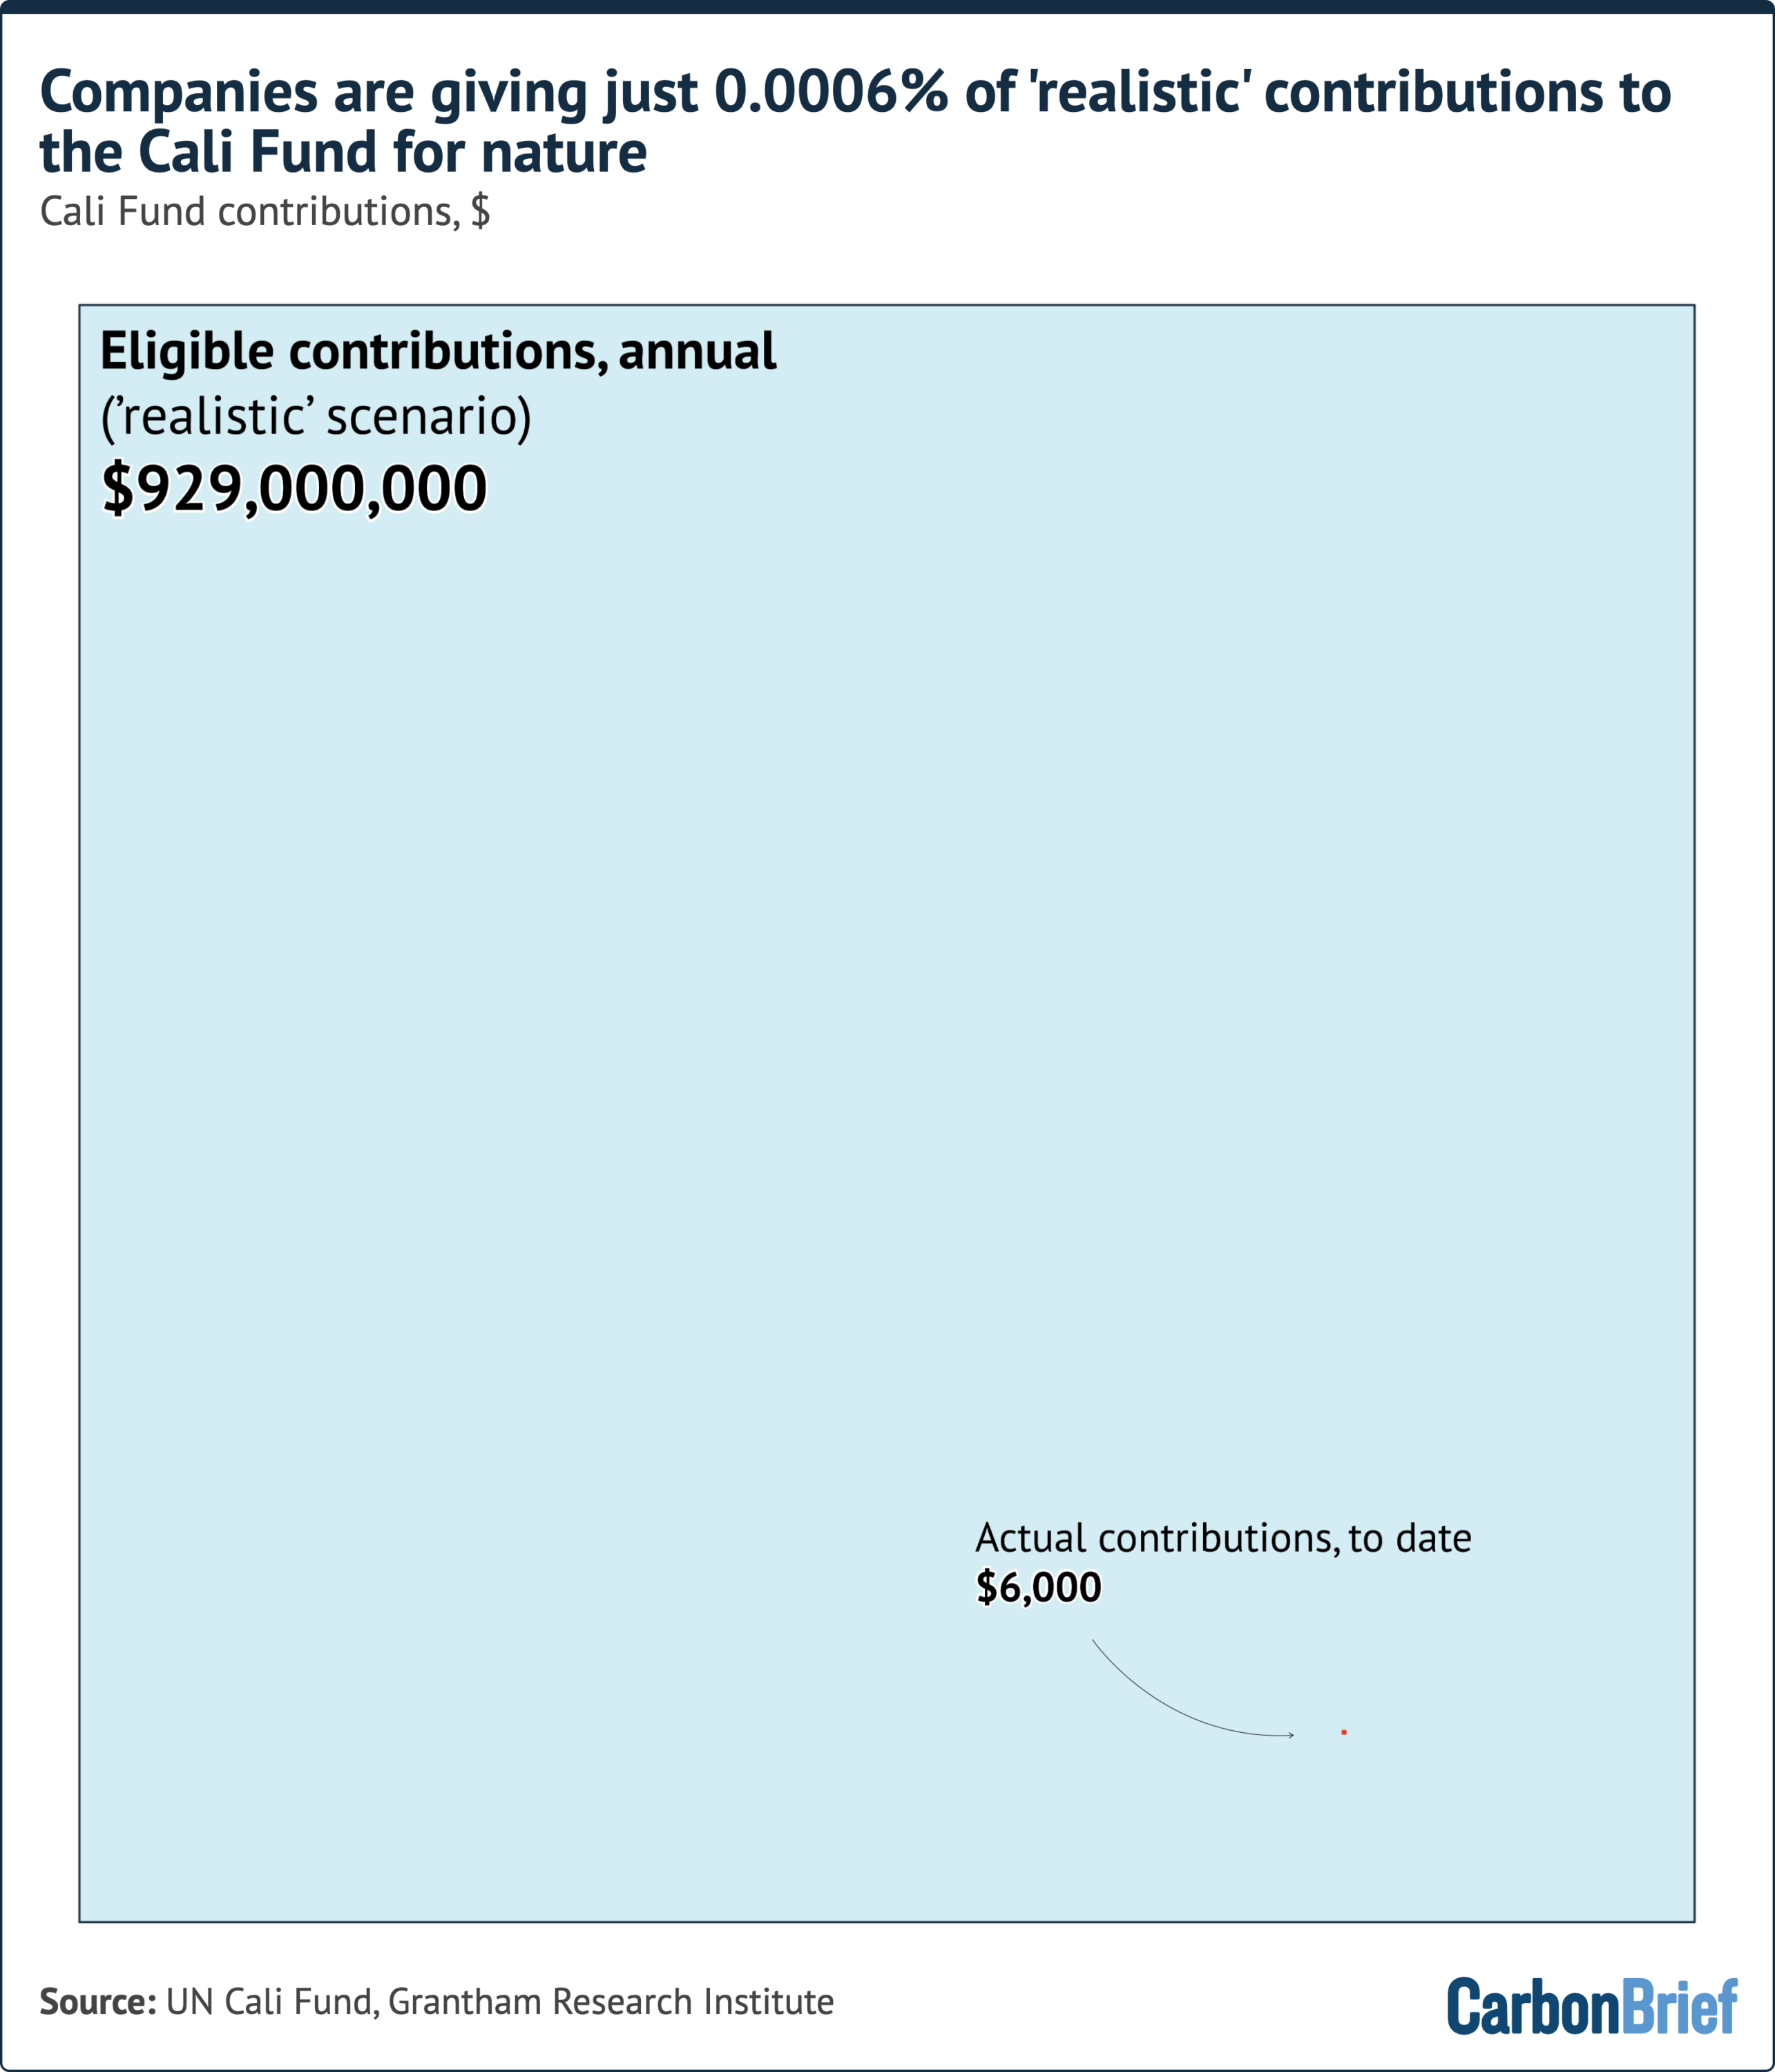 Finance gap 'fight'
Ahead of COP17 in Armenia, experts tell Carbon Brief that finance will be the most closely watched element of the stocktake of progress.
For developing countries that "hold most of the world's biodiversity and bear the greater burden of implementation" of nature targets, the need for this financing is "very real", says Lim Li Ching of the Third World Network speaking to Carbon Brief. She adds:
"These amounts fall far short of the GBF's target 19. Developed countries have regrettably not met their legal obligations…[T]his failure should not be used as an excuse to pivot to the private sector or market-based mechanisms, which struggle to raise finance at scale and often deepen social and ecological harm."
Options for private and "innovative" finance include debt-for-nature swaps, biodiversity offsets and carbon credits, but these are harder to monitor and have often faced criticism.
The Cali Fund is one avenue for companies to contribute directly to the CBD's goals, with dedicated, transparent allocations for conservation projects and Indigenous peoples.
Dr Siva Thambisetty, associate professor of law at the London School of Economics, tells Carbon Brief that the fund is still a voluntary measure and it is up to countries "to create a constructive, ethical obligation" for companies to contribute. She adds:
"The private sector is doing what it always does: minimising outgoings and liability and maximising freedom to operate. I don't believe the shift we need can be generated internally by businesses alone without outside pressure. States with jurisdiction over business need to take action."
A non-profit initiative called the Cali Watch finds that "not a single government" has passed a law requiring companies to contribute to the fund. It estimates that eight companies alone should contribute more than $2bn, as part of what it calls their "Cali debt".
Dr June Rubis, the Indigenous peoples and local communities lead on the Cali Fund's steering committee, tells Carbon Brief that she is "worried about the pace" at which biodiversity finance is moving. Rubis continues:
"Each part of the finance architecture needs to start sending credible signals at the same time: developed countries on the $20bn commitment; donors on predictable finance for the GBFF; companies on Cali Fund contributions; and the Cali Fund itself on allocation and access. If one part moves while the others are repeatedly deferred, confidence in the wider biodiversity bargain becomes harder to sustain."
She points out that for Indigenous peoples and local communities, "success also depends on whether finance can actually be accessed" to support communities' priorities. She concludes:
"[H]eadline commitments matter, but so do the pathways through which money reaches people."
Related
COP17: Which countries have released new pledges to tackle nature loss?
16.10.2026
COP17 Yerevan
COP17: Tracking progress towards the UN's 2030 nature targets
15.10.2026
COP17 Yerevan
Interactive: Tracking negotiating texts at the COP17 biodiversity summit
12.10.2026
COP17 Yerevan
Analysis: Lula presidency saved at least 20,000km2 of Brazilian Amazon since 2022
28.09.2026
International policy
The post COP17: Developed countries 'fall far short' of UN targets for nature finance appeared first on Carbon Brief.
Next week, diplomats from around the world will descend on Yerevan, Armenia, to negotiate a series of decisions under the UN Convention on Biological Diversity (CBD).
Between 19 and 30 October, 196 parties will gather to hammer out the precise wording of the dozens of legal texts that make up the decisions under the Conference of the Parties (COP) to the CBD.
This year's summit is particularly significant, as it marks the halfway point between the agreement of the Kunming-Montreal Global Biodiversity Framework and the deadline for achieving its targets.
The CBD has found that countries are currently not on track to meet 22 out of the framework's 23 targets.
During the fortnight, delegates will also be negotiating decisions relating to the two supplemental protocols to the CBD: the Cartagena Protocol, which covers biosafety; and the Nagoya Protocol, which covers access and benefit-sharing for the use of genetic resources.
(The Cartagena and Nagoya Protocols, which are each governed by a "meeting of the parties", or "MOP", have fewer parties than the CBD as a whole, with 173 and 141, respectively.)
Carbon Brief is tracking the progress of countries towards consensus on dozens of negotiating texts using the interactive table below.
The tracker includes texts from the COP, as well as the MOPs for the Cartagena and Nagoya protocols. It also includes draft decisions from the most recent subsidiary body meetings, as these form the starting point for the negotiations in Yerevan.
The CBD has three subsidiary bodies: the subsidiary body on scientific, technical and technological advice (SBSTTA), the subsidiary body on implementation (SBI) and the subsidiary body on article 8(j) and other provisions (SB8J).
SB8J focuses on issues related to the Indigenous peoples and local communities. It was established at COP16 in Cali, Colombia, in 2024.
The first two columns of the interactive tracker list the topic of each agenda item and the relevant body, with subsequent columns including dates, page counts and links to the original documents.
The table is searchable and can be sorted using the arrows in the header.
@media screen and (max-width: 895px){ .editorial-iframe{ height: 1100px !important } } @media screen and (max-width: 459px){ .editorial-iframe{ height: 1170px !important } } @media screen and (max-width: 370px){ #tableIframe.b-wide-image{ padding:0px !important } }Areas of disagreement in UN draft texts are denoted by square brackets. Counting the brackets in a particular iteration of a text therefore gives a sense of how far parties are from reaching consensus.
The bracket column is colour-coded, with dark green indicating a low number of brackets and red indicating a high number of brackets remaining.
Texts can also present parties with choices using "options" or alternatives ("alt"), which are counted together in the sixth column of the table.
The key discussions in Yerevan will centre around two agenda items in particular. The first is the global review, which will assess progress towards the GBF and make recommendations for accelerating action.
The second is finance, which can be separated into two parts: resource mobilisation and the financial mechanism. On resource mobilisation, biodiverse global south countries are likely to push for an increased amount of international finance for conservation.
Disagreement over the creation of the financial mechanism led to the suspension of COP16 in Cali in October 2024, as parties failed to find agreement on the mobilisation of finance before the end of the summit.
Global south countries want the establishment of a separate financial mechanism under the control of the CBD; global north countries largely prefer to maintain the existing mechanism, which sits under the Global Environment Facility.
At the resumed session of COP16 in Rome in early 2025, countries agreed on a roadmap that would lead to the establishment of a permanent mechanism.
related
Analysis: Lula presidency saved at least 20,000km2 of Brazilian Amazon since 2022
28.09.2026
International policy
Why land-use emissions have fallen by a third this century - in six charts
17.08.2026
Climate pollutants
 Analysis: 84% of nations miss deadline to identify 'nature-harming' subsidies by 2025
28.07.2026
International policy
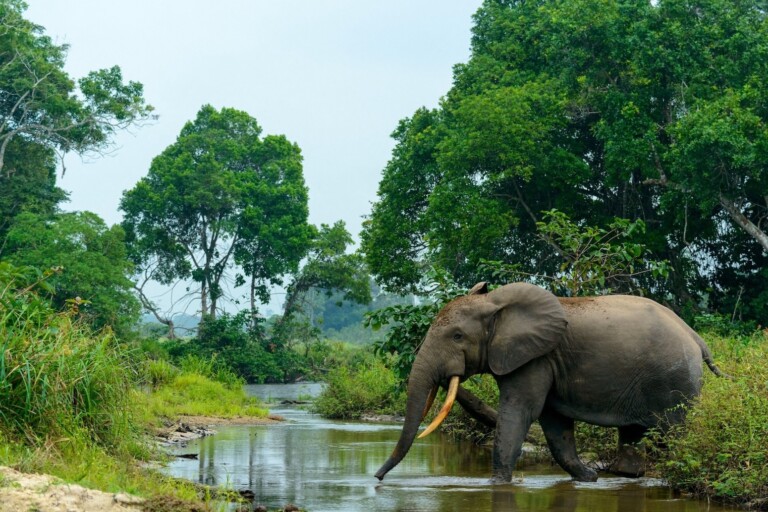 UK withdraws millions in funding from world's second-largest rainforest in Congo
15.07.2026
Nature
The post Interactive: Tracking negotiating texts at the COP17 biodiversity summit appeared first on Carbon Brief.
A booklet published by the UK's opposition Conservative party includes a "cost of net-zero" that appears to have been doubled by a spreadsheet error.
The "common sense" policy document argues that "what people ultimately want is a government competent enough to solve the problems for which it takes responsibility".
In a section that says "sophisticat[ed]…modelling" should not be a substitute for "political judgement", the "Right Way" document disparages various estimates of the cost of net-zero.
The Conservative document then claims - incorrectly - that the government's official adviser, the Climate Change Committee (CCC), had put the cost of net-zero at close to £1tn. It says:
"In 2020, the CCC estimated that its route to net-zero would cost £957bn."
In fact, the CCC's 2020 estimate was exactly half this amount - £478bn - and last year it published a revised figure of £108bn, largely as a result of the falling cost of electric vehicles (EVs).
Spreadsheet errorThe Conservative party's erroneous claim appears to stem from another report that had accidentally added up numbers twice, using a spreadsheet published by the CCC in 2020.
The 2020 spreadsheet contains a table listing the additional investments that would be needed to build a net-zero economy, from low-carbon electricity generation through to heat pumps and EVs.
These extra capital expenditures, listed as "CAPEX", add up to a total of £1.38tn over the 30 years of 2020-50. They are set against operational savings, listed as "OPEX", of £0.90tn.
Added up over 2020-50, the combined CAPEX and OPEX figures come to a total of £478bn.
In addition to the annual sectoral CAPEX and OPEX figures, the CCC's 2020 spreadsheet also has a line giving combined totals for each year. It appears that someone has added all of these numbers together, resulting in the savings and costs being counted twice.
This double-counted total for the cost of net-zero amounts to £957bn - as shown in the image below - and it appears to be the source of the claim in the Conservative booklet.
At the time of publication in 2020, the CCC said that the £478bn net cost of net-zero amounted to less than 1% of GDP over 30 years - and that the large investment needed would not only result in savings due to lower fossil-fuel imports, but that it would boost GDP overall, by around 2%.
In 2025, the CCC revised its estimates for investment costs and operating savings to £670bn and £562bn respectively, giving a net total of £108bn over 2025-50, or less than 0.2% of GDP.
Earlier this year, the committee said that cutting emissions to net-zero would cost less than a single fossil-fuel price shock and that doing so would have benefits worth £110bn per year.
Paper trailThe erroneous claim in the Conservative document is referenced to the CCC's 2020 advice on the UK's sixth "carbon budget", which, as explained, does not contain the £957bn figure.
The earliest online use of the £957bn figure found by Carbon Brief is a 12 January 2026 article in the Spectator, by retired engineer and self-described "accidental energy analyst" David Turver.
A day later, Turver repeated the mistaken number in a report for the free-market Institute of Economic Affairs. His report cites figure 5.3 of the CCC's 2020 advice.
However, as set out above, the CCC spreadsheet containing the data for figure 5.3 only adds up to £478bn, half the figure claimed by Turver.
It appears that Turver accidentally added up all of the numbers in the CCC spreadsheet, without noting that it already included a line for the annual total. This results in double-counting the cost.
(Turver's report also triggered a slew of inaccurate headlines stating that net-zero would cost £7.6tn - or even £9tn. These figures, which came from Turver's report, were based, among other things, on the implicit assumption that fossil fuels and the cars, boilers and power plants that use them are all free.)
After Turver's report and article in January 2026, the erroneous £957bn figure was repeated in March by the Great British Think Tank. The organisation has the tagline "data, not vibes" and says of its work: "Every figure [is] sourced from official public bodies."
The £957bn figure then appeared in the Conservative "Right Way" document in October 2026.
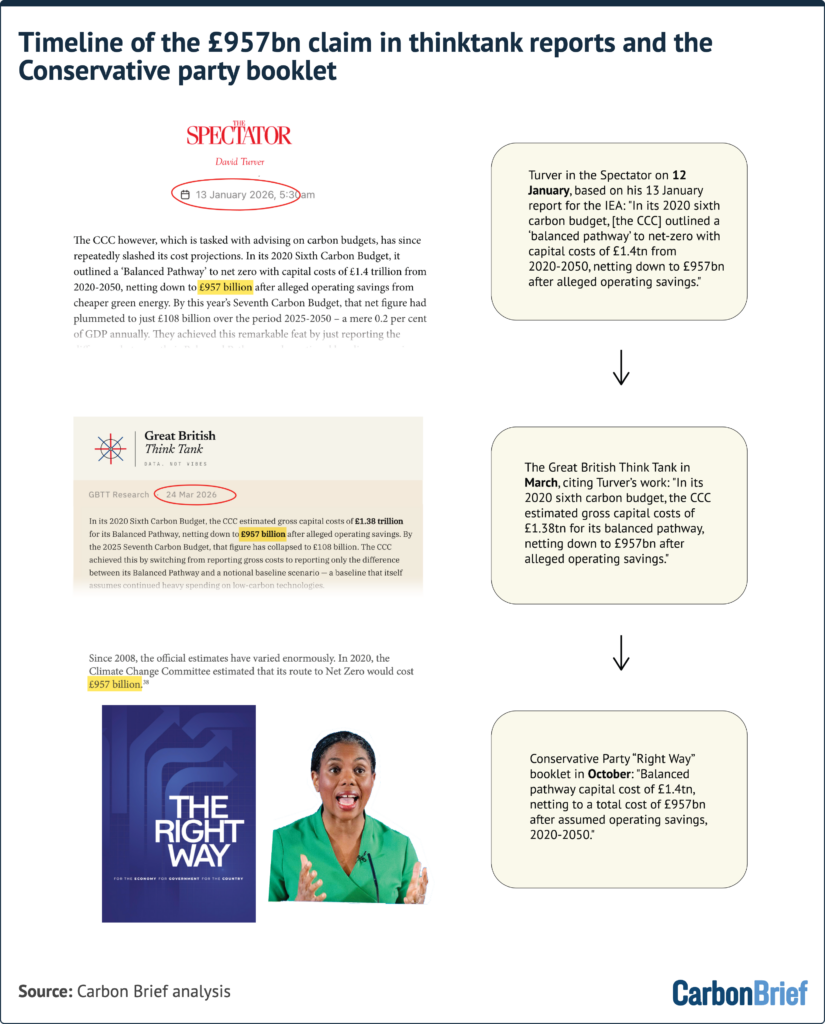 related
Analysis: EVs are now nine times cheaper than petrol or diesel to drive in the UK
24.09.2026
Oil and gas
CCC: Heathrow expansion could push flights to '80% of UK emissions by 2050'
16.09.2026
Emissions
 Revealed: England's June 2026 heatwave sparked record demand for ambulances
14.09.2026
Health and society
 Factcheck: Reform UK's 45 false or misleading claims about climate and energy
11.09.2026
UK policy
The post Factcheck: UK Conservatives double the 'cost of net-zero' after spreadsheet blunder appeared first on Carbon Brief.


