
This report belongs to a weekly series summarising the Covid situation across the UK's home nations and other countries.
Thanks for reading Seeing The Forest for the Trees! Subscribe for free to receive new posts and support my work.
This week's report highlights the latest trends in respiratory illness activity across England, Scotland, Wales, and Northern Ireland. It also shares provides details on recent Covid activity for selected countries in Europe, North America, and Asia.
Charts for the USA will be updated on Friday, Nov 6 to reflect the latest published data.
Summary.
This week, Covid trends in the UK again showed a mixed picture. In England, most indicators fell slightly, suggesting the risk stays low and isn't growing. In Scotland, most indicators increased marginally, with overall activity now at a medium level. Wales remained stable, with levels sitting at moderate. In Northern Ireland, the data shows levels falling slightly with activity remaining low.
In England, most key indicators for Covid fell slightly this week indicating a lower risk of Covid. Positivity rates for all tests carried are falling at a national level as well as in most regions. After rising earlier than previous years, Flu test positivity in England has stabilised and has now returned to a more normal seasonal pattern.
All key Covid indicators in Scotland increased slightly this week and overall are now at medium levels of activity. Flu levels are rising earlier than previous years,
This week, Covid hospital admissions in Wales remained stable at moderate levels, while Flu admissions increased slightly.
In Northern Ireland, all Covid indicators fell slightly with activity remaining low. All indicators for Flu again increased but remained at low levels of activity.
Covid levels in wastewater continue to increase slowly this week across most European countries still reporting data, but overall they are still relatively low apart from France which has moderate levels.
For the week ending Oct 24, Covid activity in the USA appears to be on the rise, even though some hospital indicators are trending downward. Wastewater levels increased slightly, staying at a moderate level, with most states seeing increases. At the same time, Flu activity continues to climb earlier than previous years.
Covid levels remain low in Hong Kong and Singapore, but Flu levels are still relatively high although falling. Covid and Flu activity in New Zealand remains very low.
The UK's Autumn 2026 Covid Booster campaign started on Oct 1 and details of who is is eligible and how to arrange a vaccination can be found at the following links - England, Scotland, Wales, and Northern Ireland.
By week five of the campaign, vaccine coverage in England had climbed to 47% for people aged 75 and above, and 21% for those under the age of 75 years who are immunosuppressed. At present, coverage remains lower across the other home nations.
Free Flu vaccinations for those eligible are also available from Oct 1, 2026. Further details can be found at the following links - England, Scotland (invitation letter required), Wales, and Northern Ireland.
As always, it's important to remember that the risk of hospitalisation from Covid increases significantly with age and for the clinically vulnerable. Therefore, it is important to take appropriate measures such as self-isolating when experiencing Covid symptoms and enhancing ventilation or wearing masks whenever possible.
Status of main respiratory diseases in England.
UKHSA have moved to publishing the Flu and COVID-19 surveillance reports fortnightly over the summer so data is only available from the Covid Dashboard this week.
This section starts with the latest data on test positivity rates for Covid in England. It's important to note that positivity is different from prevalence, which reflects the overall percentage of Covid cases in the general population. Appendix 1 offers a more detailed explanation of the distinction.
The following chart shows the test positivity rate for all Covid tests taken mapped against the UKHSA activity thresholds. The thresholds are based on the historical trend for Covid test positivity and, consequently, represent a relative risk. More details on this approach can be found in the Guide to Covid Surveillance Metrics.
The chart shows that the test positivity rate has continued to fall, but is still at a low activity level. The rate remains highest at 11.1% for those aged 85 and above, then falls to just 1.9% for individuals aged 5 to 14 years.
The next chart shows that positivity rates for all tests carried out differ between regions. Most regions experienced a fall in test positivity rates, with the West Midlands and East Midlands approaching baseline levels. The East of England and Yorkshire and the Humberside remained stable but had the highest rates.
The following chart highlights the key indicators of Covid in hospitals: weekly visits to Emergency Departments, test positivity rates among patients with respiratory issues, hospital admission and intensive care rates.
This week, hospital indicators for Covid activity again showed a mixed picture but remained relatively low. While test positivity remained remained broadly unchanged, Emergency Department visits, hospital and intensive care admissions fell slightly.
The next chart in this section compares the positivity rate for hospital patients for the main respiratory viruses. Covid positivity rates fell slightly, while Flu rates started to increase with both still at low activity levels. The Rhinovirus rate fell but stayed at the medium activity level. Meanwhile, RSV rates are starting to increase although remain within baseline levels.
The final chart in this section shows that although Flu rates for this year started rising earlier than in previous years they are now returning to a more normal seasonal pattern.
Scotland weekly hospital admissions and test positivity
Public Health Scotland has now returned to publishing the Viral Respiratory Diseases in Scotland surveillance report weekly.
The latest edition, published on Nov 5, again reported that indicators of respiratory infections are rising slowly, typical for this time in the season.
Flu activity has increased slightly this week, but laboratory confirmed cases activity level remained low overall. Flu hospital admissions increased by 16% to 207 this week and were higher than at the same point in the previous five seasons.
Covid activity has increased marginally across laboratory surveillance, but remains at medium activity overall. There has been a slight increase in the number of Covid hospital admissions.
The following panel chart presents the latest data for Covid levels in wastewater in blue, weekly Covid test positivity shown in red, Covid hospital admissions depicted in orange, and beds occupied by Covid patients in brown.
All hospital Covid indicators in Scotland increased slightly this week and are at medium levels of activity. However, wastewater levels fell slightly and remain very low indicating that that this wave may be smaller than earlier ones.
The next chart in this section compares the test positivity rates for hospital patients with respiratory symptoms for Covid, Flu, and RSV. Covid positivity rates increased to 7.5% from 6.5% in the previous week, while RSV rates remained below baseline levels. Flu rates rose once again and remain higher than for Covid.
The final chart in this section confirms that hospital admissions for Flu are higher than at the same time in previous years, indicating an early start to the Flu season this year.
Wales Covid hospital admissions.
The following chart provides the latest trend for weekly hospital admissions for the main respiratory viruses in Wales up to week ending Nov 1, 2026.
Hospital admissions for Covid have increased over the past few weeks but remain at moderate levels.
The weekly Weekly Surveillance Report showed that test positivity increased to 11.6% in hospitals and GP practices for week ending Oct 25, 2026. Finally, the report confirmed that Flu circulation remains at low levels, while Respiratory Syncytial Virus (RSV) is holding steady at baseline intensity.
Status of main respiratory diseases in Northern Ireland.
Public Health Northern Ireland's respiratory surveillance report covering Covid activity has now returned to being published weekly. The latest report covers data through to the week ending Nov 1, 2026 and the chart below highlights the test positivity rates for Covid, Flu, and RSV.
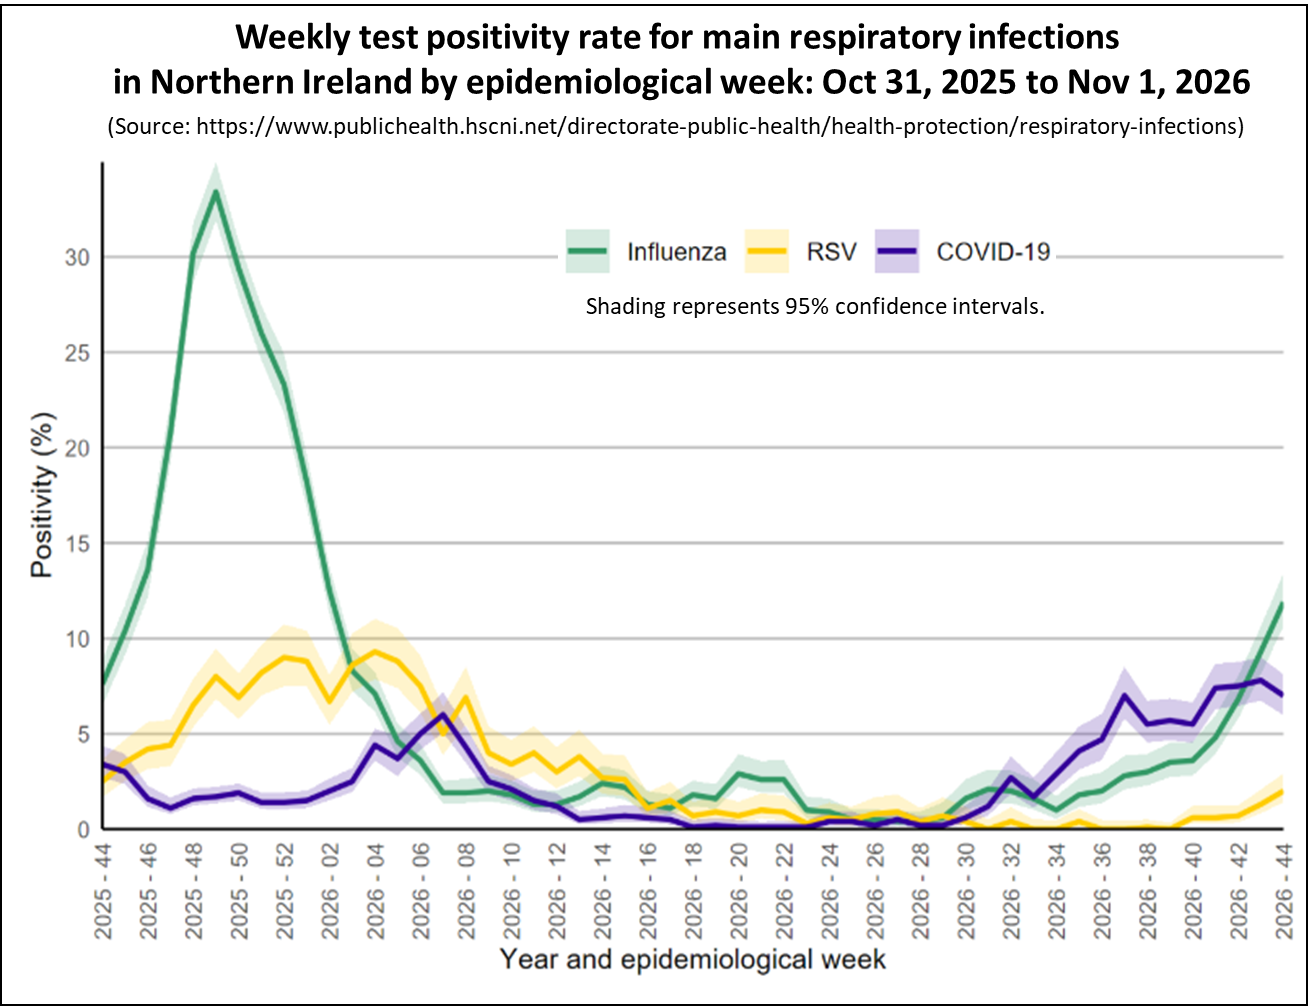
Test positivity was highest among the 5-14 age group for Flu (21.7%), the 0-4 age group for RSV (12.6%), and the 75+ age group for Covid (8.9%).
Overall, Flu activity has increased across all surveillance indicators but still remains low. Covid activity has likely decreased and remains low with most surveillance indicators falling. RSV activity also remained at baseline levels although the majority of surveillance indicators have increased.
Covid Activity in Europe.
This section looks at the latest Covid trends in Europe and examines how wastewater patterns align with prevalence and hospital data in selected countries.
The following chart shows the latest levels of Covid up to week ending Oct 29, 2026 as measured by monitoring wastewater in a number of European countries that still publish this information.
This week, Covid levels in wastewater increased in most European countries still sharing this data but remained relatively low apart from in France and Denmark which are at moderate levels.
Wastewater levels are not the only measures of Covid activity published by these countries and it is valuable to see how well the wastewater trends compare to the other key indicators.
Wastewater levels in Germany and France, when compared with hospital trends, show similar patterns. Interestingly, the Netherlands stands out as the only country in Europe that shares data on Covid prevalence in the population through a weekly survey, which also aligns closely with wastewater trends.
The two charts on the left show Germany's wastewater trends compared to their Covid hospital admissions, while the charts in the middle display France's wastewater levels against the percentage of Emergency Department visits due to Covid. The two charts on the right show waste water levels in the Netherland and the estimated prevalence of Covid in the population based on the weekly survey.
The latest data shows that Covid activity continues to rise slowly in Germany, France and the Netherlands across both sets of measures, confirming that Covid wastewater trends are a reliable indicator of Covid activity.
Covid Activity in North America.
This section provides details of Covid activity in USA and Canada.
Charts for the USA will be updated on Friday, Nov 6 to reflect the latest information.
As of the week ending Oct 24, 2026, Covid indictors of activity in the USA present a mixed picture. While hospital indicators show falling levels of activity that are low, wastewater activity levels remained at moderate levels. While the risk remains low in most states, those in the Northeast and West are showing higher levels of activity.
The following chart shows the weekly trend for the national key Covid indicators covering wastewater activity levels, percent of emergency department visits due to Covid, test positivity, and the hospital admission rate in the USA.
The panel chart shows that the hospital indicators of Covid activity have continued to fall in the week ending Oct 24, 2026, and are at relatively low levels. However, Covid levels in wastewater increased but remained at moderate levels. Overall, it is likely that Covid activity is increasing slowly.
Flu activity is also increasing and earlier than in past years, though it remains at low levels, as illustrated in the following chart.
The next chart shows the Covid trends by state as estimated for Oct 27, 2026. Most states are showing a growing or likely growing trend, marked in red or orange, while those with no change are highlighted in yellow. This week, 22 states are reporting a likely growing or growing trend, up from 10 last week. Despite this, all states continue to report low or very low levels of Emergency Department visits for Covid.
A reminder that the trend represents the direction of activity only and does not indicate the level of activity. Consequently, this map should be used in conjunction with other data like the percent of Emergency Department visits due to Covid.
States marked with vertical bars have low percent of visits to Emergency Departments (ED) for Covid and those marked with horizontal bars have very low percent of visits. More details information is available by hovering your cursor over any State.
The final map for the USA shows wastewater analysis for week ending Oct 24, 2026. While Wastewater activity levels for Covid are low in many States, activity is increasing in most states and many are showing high activity levels. Activity levels are higher in States in the West and Northeast regions.
Each State is coloured based on activity levels, ranging from very high (dark red) to very low (light green), with grey indicating no data available. States with increasing activity levels are marked with cross-hatching. It is important to understand that the wastewater activity level is relative to the lowest levels seen in the past two years. Consequently, it is not a fixed absolute scale across all years. It is primarily a measure of how current wastewater viral levels compare with recent low levels in that State.
In Canada, data for the week ending Oct 24, 2026, shows that Covid wastewater levels stayed at moderate levels, although levels in the western provinces are higher. Flu A activity is starting to rise and is now at a moderate level.
The weekly Canadian respiratory virus surveillance report provides further details on the activity of respiratory viruses. The latest report, covering data through the week ending Oct 24, 2026, indicates that Flu activity has continued to rise earlier than normally expected. Flu test positivity has has continued to increase to 7.6%, surpassing the seasonal threshold of 5%, marking the official start of the Flu season earlier than usual. Test positivity for Covid also increased to 5.1% but remains relatively low while RSV remains stable and at low activity levels.
Status of main respiratory diseases in Asia and Oceania.
This section provides the latest information on Covid and Flu activity levels in Hong Kong, Singapore, and New Zealand.
The following chart displays the key Covid indicators for Hong Kong up to the week ending Oct 31, 2026. Although Covid levels in wastewater samples increased in July, the latest hospital surveillance data shows that the overall local activity of Covid has fallen to very low levels and the summer wave is over.
However, Flu presents a different picture. The following chart shows that although Flu levels in Hong Kong are falling and the Flu season is coming to an end they remain relatively high.
The next chart presents the weekly Covid positivity rate for tests carried out on patients with respiratory symptoms in Singapore up to week ending Oct 17, 2026. It shows that Covid activity peaked in May, consistent with the previous two years, and has now fallen to low levels.
However, although Flu activity is falling in Singapore it remains moderately high, similar to Hong Kong.
Meanwhile New Zealand shows a different picture for Covid activity which has remained very low for several months and did not have the peaks seen in Hong Kong.
However, there was a severe Flu season that peaked at the end of August. The latest Respiratory Illness Dashboard for New Zealand confirms that the Flu season is now over with activity returning to the low levels seen at the same period last year.
Spring 2026 Covid Booster campaign.
The NHS Autumn Covid booster campaign started on October 1, 2026. People aged 75 years and older, residents in care homes for older people, and those aged 6 months and over with a weakened immune system will be offered a dose of the Covid vaccine this spring. These are same criteria used for the Spring 2026 and Autumn 2025 booster campaigns.
Full details of eligibility and the vaccines being used for the Spring campaign can be found in the UK Governments Green Book published here.
The following chart shows the number of Covid vaccinations given by week for each of the booster campaigns in England.
During the first five weeks of the Autumn 2026 campaign in England, 3,438,273 booster doses were given, providing 47% coverage for people aged 75 and older and 21% coverage for those under the age of 75 years who are immunosuppressed. This is slightly higher than the first five weeks of the Spring 2026 campaign but 451,166 fewer than the Autumn 2025 campaign, which had the same group of people eligible.
The final chart in this section shows the Autumn 2026 Covid booster coverage for each of the eligible cohorts by home nation. Coverage is generally highest in England, but coverage for the immunosuppressed group is lowest in all four home nations.
In conclusion
Although the amount of data currently being published is reduced, the information available for all home nations show that Covid activity is low in England. However, Scotland is seeing increases and is now at medium activity levels. Wales and Northern Ireland are seeing slow increases but remain relatively low.
Covid levels in wastewater are low but rising slowly across most European countries, particularly in France. In the USA, Covid activity is rising slowly and is at moderate levels,.
Flu levels are starting to rise earlier than in previous years in some countries.
As always, if you have any comments on this Covid Situation Report or suggestions for topics to cover, please post a message below.
Thanks for reading Seeing The Forest for the Trees! Subscribe for free to receive new posts and support my work.
Appendix 1. Test positivity rates and prevalence
Positivity rates are derived from the results of hospital laboratory tests conducted on patients exhibiting symptoms of respiratory diseases. Test positivity is the percentage of patients who test positive for Covid of the total number of patients tested. Since the individuals tested for this measure are not a representative sample of the general population it differs from prevalence, which is derived from a representative sample of the population.
This report belongs to a weekly series summarising the Covid situation across the UK's home nations and other countries.
Thanks for reading Seeing The Forest for the Trees! Subscribe for free to receive new posts and support my work.
This week's report highlights the latest trends in respiratory illness activity across England, Scotland, Wales, and Northern Ireland. It also shares provides details on recent Covid activity for selected countries in Europe, North America, and Asia.
Charts for the USA will be updated on Friday, Oct 30 to reflect the latest published data.
Summary.
This week, Covid trends in the UK show a mixed picture. In England, most indicators fell slightly, suggesting the risk stays low and isn't growing. In Scotland, all indicators increased slightly, with overall activity now at a medium level. Wales continues to see slow increases, with levels sitting at moderate. In Northern Ireland, the data is mixed, but activity remains low.
In England, most key indicators for Covid fell slightly this week indicating a lower risk of Covid. Positivity rates for all tests carried are falling at a national level as well as in most regions. After rising earlier than previous years, Flu test positivity in England has stabilised and is returning to a more normal seasonal pattern.
All key Covid indicators in Scotland increased slightly this week and overall are now at medium levels of activity. Flu levels are rising earlier than previous years,
This week, Covid admissions in Wales again increased and are now at moderate levels, while Flu and RSV hospitalisations remained stable and low.
In Northern Ireland, Covid indicators presented a mixed picture but activity remained low. All indicators for Flu increased but remained at low levels of activity.
Covid levels in wastewater continue to increase slowly this week across most European countries still reporting data, but overall they are still relatively low apart from France which has moderate levels.
For the week ending Oct 17, Covid activity in the USA is likely falling slowly with hospital indicators falling. While wastewater levels remaining unchanged at a moderate level, most states are still seeing low levels overall. Meanwhile, Flu activity continues to rise.
Covid levels remain low in Hong Kong and Singapore, but Flu levels are still high.
The UK's Autumn 2026 Covid Booster campaign started on Oct 1 and details of who is is eligible and how to arrange a vaccination can be found at the following links - England, Scotland, Wales, and Northern Ireland.
By week four of the campaign, vaccine coverage in England had climbed to 42% for people aged 75 and above, and 18% for those who are immunosuppressed. At present, coverage remains lower across the other home nations.
Free Flu vaccinations for those eligible are also available from Oct 1, 2026. Further details can be found at the following links - England, Scotland (invitation letter required), Wales, and Northern Ireland.
As always, it's important to remember that the risk of hospitalisation from Covid increases significantly with age and for the clinically vulnerable. Therefore, it is important to take appropriate measures such as self-isolating when experiencing Covid symptoms and enhancing ventilation or wearing masks whenever possible.
Status of main respiratory diseases in England.
UKHSA have moved to publishing the Flu and COVID-19 surveillance reports fortnightly over the summer so data is only available from the Covid Dashboard this week.
This section starts with the latest data on test positivity rates for Covid in England. It's important to note that positivity is different from prevalence, which reflects the overall percentage of Covid cases in the general population. Appendix 1 offers a more detailed explanation of the distinction.
The following chart shows the test positivity rate for all Covid tests taken mapped against the UKHSA activity thresholds. The thresholds are based on the historical trend for Covid test positivity and, consequently, represent a relative risk. More details on this approach can be found in the Guide to Covid Surveillance Metrics.
The chart shows that the test positivity rate has started to fall, but is still at a low activity level. The rate remains highest at 11.1% for those aged 85 and above, then falls to just 1.9% for individuals aged 5 to 14 years.
The next chart shows that positivity rates for all tests carried out differ between regions. While most regions experienced a fall in test positivity rates, the North East continues to rise fast. Nevertheless, all regions stayed at a low level of activity apart from London which is now has the lowest rate, just within the baseline level of activity. Rates are holding steady in the North West, East Midlands, and Yorkshire and the Humberside.
The following chart highlights the key indicators of Covid in hospitals: weekly visits to Emergency Departments, test positivity rates among patients with respiratory issues, hospital admission and intensive care rates.
This week, hospital indicators for Covid activity again showed a mixed picture but remained relatively low. While test positivity and Emergency Department visits remained broadly unchanged, hospital and intensive care admissions continued to rise slowly.
The next chart in this section compares the positivity rate for hospital patients for the main respiratory viruses. Covid positivity rates fell slightly, while Flu rates stayed the same, with both still at low activity levels. The Rhinovirus rate fell slightly but stayed at the medium activity level. Meanwhile, RSV remains at out of season levels but is starting to increase.
However, the final chart in this section shows that although Flu rates for this year started rising earlier than in previous years they are now returning to a more normal seasonal pattern.
Scotland weekly hospital admissions and test positivity
Public Health Scotland has now returned to publishing the Viral Respiratory Diseases in Scotland surveillance report weekly.
The latest edition, published on Oct 29, reported that indicators of respiratory infections are rising slowly, typical for this time in the season.
Flu activity has increased slightly this week, with laboratory confirmed cases activity level moving from baseline to low overall. This increase is reflected by a 40% increase in the number of influenza hospital admissions, which are higher than at the same period in previous seasons.
Covid activity has increased marginally across laboratory surveillance, moving from low to medium activity overall. Increased activity for Covid has also been observed at GPs for a second week. There has been a slight increase in the number of Covid hospital admissions.
The following panel chart presents the latest data for Covid levels in wastewater in blue, weekly Covid test positivity shown in red, Covid hospital admissions depicted in orange, and beds occupied by Covid patients in brown.
All key Covid indicators in Scotland increased slightly this week and overall are now at medium levels of activity. However it remains likely that this wave may be smaller than earlier ones.
The next chart in this section compares the test positivity rates for hospital patients with respiratory symptoms for Covid, Flu, and RSV. Covid positivity rates increased to 6.5% from 5.5% in the previous week, while RSV rates remained below baseline levels. Flu rates rose slightly and remain higher than for Covid.
The final chart in this section shows that hospital admissions for Flu are higher than at the same time in previous years, indicating an early start to the Flu season this year.
Wales Covid hospital admissions.
The following chart provides the latest trend for weekly hospital admissions for the main respiratory viruses in Wales up to week ending Oct 25, 2026.
Hospital admissions for Covid have increased over the past few weeks but remain at moderate levels.
The weekly Weekly Surveillance Report showed that test positivity increased to 11.6% in hospitals and GP practices for week ending Oct 25, 2026. Finally, the report confirmed that Flu circulation remains at low levels, while Respiratory Syncytial Virus (RSV) is holding steady at baseline intensity.
Status of main respiratory diseases in Northern Ireland.
Public Health Northern Ireland's respiratory surveillance report covering Covid activity has now returned to being published weekly. The latest report covers data through to the week ending Oct 25, 2026 and the chart below highlights the test positivity rates for Covid, Flu, and RSV.
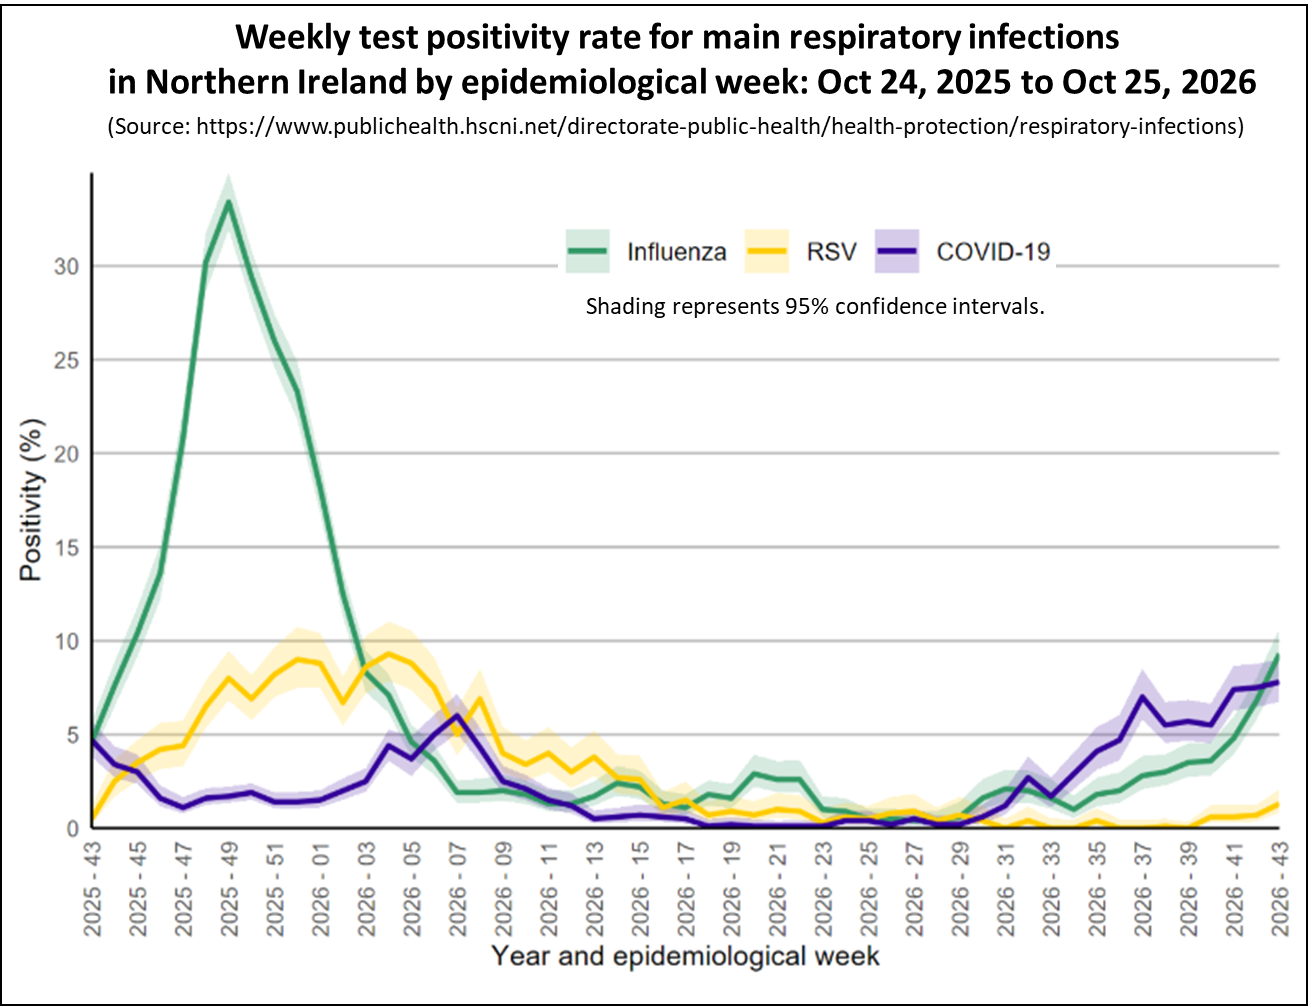
Test positivity was highest among the 5-14 age group for Flu (22.5%), the 0-4 age group for RSV (7.8%), and the 75+ age group for Covid (9.3%).
Overall, Flu activity has increased across all surveillance indicators but still remains low. Covid activity showed a more mixed trend across surveillance indicators and remains low. RSV activity also remained at baseline levels although some surveillance indicators have increased.
Covid Activity in Europe.
This section looks at the latest Covid trends in Europe and examines how wastewater patterns align with prevalence and hospital data in selected countries.
The following chart shows the latest levels of Covid up to week ending Oct 22, 2026 as measured by monitoring wastewater in a number of European countries that still publish this information.
This week, Covid levels in wastewater increased in most European countries still sharing this data but remained relatively low apart from in France which is at moderate levels.
Wastewater levels are not the only measures of Covid activity published by these countries and it is valuable to see how well the wastewater trends compare to the other key indicators.
Wastewater levels in Germany and France, when compared with hospital trends, show similar patterns. Interestingly, the Netherlands stands out as the only country in Europe that shares data on Covid prevalence in the population through a weekly survey, which also aligns closely with wastewater trends.
The two charts on the left show Germany's wastewater trends compared to their Covid hospital admissions, while the charts in the middle display France's wastewater levels against the percentage of Emergency Department visits due to Covid. The two charts on the right show waste water levels in the Netherland and the estimated prevalence of Covid in the population based on the weekly survey.
The latest data shows that Covid activity continues to rise slowly in Germany, France and the Netherlands across both sets of measures, confirming that Covid wastewater trends are a reliable indicator of Covid activity.
Covid Activity in North America.
This section provides details of Covid activity in USA and Canada.
Charts for the USA will be updated on Friday, Oct 30 to reflect the latest information.
As of the week ending Oct 17, 2026, Covid indictors of activity in the USA present a mixed picture. While hospital indicators show falling levels of activity that are low, wastewater activity levels remained at moderate levels. While the risk remains low in most states, those in the Southeast and West are showing higher levels of activity.
The following chart shows the weekly trend for the national key Covid indicators covering wastewater activity levels, percent of emergency department visits due to Covid, test positivity, and the hospital admission rate in the USA.
The panel chart shows that the hospital indicators of Covid activity have continued to fall in the week ending Oct 17, 2026, and are at relatively low levels. However, although Covid levels in wastewater were stable they remained at moderate levels although this may be due to the addition of new testing sites.
While Covid levels are likely falling, Flu activity is increasing earlier than in past years, though it remains at low levels, as illustrated in the following chart.
The next chart shows the Covid trends by state as estimated by the CDC for Oct 20, 2026. Most States are showing a declining trend, depicted in green, or no change as highlighted in grey. This week, only 10 states are showing a likely growing or growing trend, marked in orange or red, just like last week. All states have low or very low levels of Emergency Department visits for Covid.
A reminder that the trend represents the direction of activity only and does not indicate the level of activity. Consequently, this map should be used in conjunction with other data like the percent of Emergency Department visits due to Covid.
States marked with vertical bars have low percent of visits to Emergency Departments (ED) for Covid and those marked with horizontal bars have very low percent of visits. More details information is available by hovering your cursor over any State.
The final map for the USA presents wastewater analysis for week ending Oct 17, 2026 presents a contrasting picture. While Wastewater activity levels for Covid are low in many States, several are showing high or very high activity levels. For example, wastewater activity levels in Florida remain very high, whereas Emergency Department visits for Florida are low and falling.
Each State is coloured based on activity levels, ranging from very high (dark red) to very low (light green), with grey indicating no data available. States with increasing activity levels are marked with cross-hatching. It is important to understand that the wastewater activity level is relative to the lowest levels seen in the past two years. Consequently, it is not a fixed absolute scale across all years. It is primarily a measure of how current wastewater viral levels compare with recent low levels in that State.
Activity levels are low in most States but are higher in some States in the West and Southeast regions.
In Canada, data for the week ending Oct 10, 2026, shows that Covid wastewater levels stayed at moderate levels, although levels in the western provinces are higher. Flu A activity is starting to rise and is now at a moderate level.
The weekly Canadian respiratory virus surveillance report provides further details on the activity of respiratory viruses. The latest report, covering data through the week ending Oct 17, 2026, indicates that Flu activity has continued to rise earlier than normally expected. Flu test positivity has reached 6.5%, surpassing the seasonal threshold of 5%, marking the official start of the Flu season. Meanwhile, test positivity for Covid and RSV remains stable and at low activity levels.
Status of main respiratory diseases in Asia.
This section provides the latest information on Covid and Flu activity levels in Hong Kong and Singapore.
The following chart displays the key Covid indicators for Hong Kong up to the week ending Oct 24, 2026. Although Covid levels in wastewater samples increased in July, the latest hospital surveillance data shows that the overall local activity of Covid has fallen to very low levels and the recent wave is over.
However, Flu presents a very different picture and the following chart shows that the Flu levels in Hong Kong are presently very high.
The next chart presents the weekly Covid positivity rate for tests carried out on patients with respiratory symptoms in Singapore up to week ending Oct 10, 2026. It shows that Covid activity peaked in May, consistent with the previous two years, and has now fallen to low levels.
However, although Flu activity is falling in Singapore it remains moderately high, similar to Hong Kong.
Spring 2026 Covid Booster campaign.
The NHS Autumn Covid booster campaign started on October 1, 2026. People aged 75 years and older, residents in care homes for older people, and those aged 6 months and over with a weakened immune system will be offered a dose of the Covid vaccine this spring. These are same criteria used for the Spring 2026 and Autumn 2025 booster campaigns.
Full details of eligibility and the vaccines being used for the Spring campaign can be found in the UK Governments Green Book published here.
The following chart shows the number of Covid vaccinations given by week for each of the booster campaigns in England.
During the first four weeks of the Autumn 2026 campaign in England, 3,063,101 booster doses were given, providing 42% coverage for people aged 75 and older and 18% coverage for those who are immunosuppressed. This is slightly higher than the first four weeks of the Spring 2026 campaign but 497,908 fewer than the Autumn 2025 campaign, which had the same group of people eligible.
The final chart in this section shows the Autumn 2026 Covid booster coverage for each of the eligible cohorts by home nation. Coverage is generally highest in England, but coverage for the immunosuppressed group is lowest in all four home nations,
In conclusion
Although the amount of data currently being published is reduced, the information available for all home nations show that Covid activity is low in England. However, Scotland is seeing increases and is now at medium activity levels. Wales and Northern Ireland are seeing slow increases but remain relatively low.
Covid levels in wastewater are low but rising slowly across most European countries, particularly in France. In the USA, Covid activity is staring to fall and is at low levels, except in a few states.
Flu levels are starting to rise earlier than in previous years in some countries.
As always, if you have any comments on this Covid Situation Report or suggestions for topics to cover, please post a message below.
Thanks for reading Seeing The Forest for the Trees! Subscribe for free to receive new posts and support my work.
Appendix 1. Test positivity rates and prevalence
Positivity rates are derived from the results of hospital laboratory tests conducted on patients exhibiting symptoms of respiratory diseases. Test positivity is the percentage of patients who test positive for Covid of the total number of patients tested. Since the individuals tested for this measure are not a representative sample of the general population it differs from prevalence, which is derived from a representative sample of the population.
This report belongs to a weekly series summarising the Covid situation across the UK's home nations and other countries.
Thanks for reading Seeing The Forest for the Trees! Subscribe for free to receive new posts and support my work.
This week's report highlights the latest trends in respiratory illness activity across England, Scotland, Wales, and Northern Ireland. It also shares provides details on recent Covid activity for selected countries in Europe, North America, and Asia.
Charts for the USA will be updated on Friday, Oct 23 to reflect the latest published data.
Summary.
This week, Covid trends in the UK again present a mixed picture. In England, all Covid indicators fell slightly, indicating that the risk remains low and is likely not increasing. In Scotland, Covid indicators fell slightly and activity may have plateaued. Data from Wales and Northern Ireland shows Covid levels are likely rising slowly but remain moderately low.
In England, most key indicators for Covid fell slightly this week indicating a low risk of Covid. Positivity rates for all tests carried out have stopped rising and are now falling in some regions that previously had the highest rates. After rising earlier than previous years, Flu test positivity in England has stabilised and is returning to a more normal seasonal pattern.
This week, Covid activity indicators in Scotland fell slightly and remain relatively low overall. Flu activity, which had started rising earlier than usual, has now settled back into normal seasonal patterns and is at baseline levels.
This week, Covid admissions in Wales increased and are now at moderate levels, while Flu and RSV hospitalisations remained stable and low.
In Northern Ireland, all surveillance indicators for Flu increased but remained at low levels of activity. Covid indicators presented a mixed picture but activity remained low.
Covid levels in wastewater increased slowly this week across most European countries still reporting data, but overall they are still relatively low apart from France which has moderate levels.
For the week ending Oct 10, Covid activity in the USA presents a mixed picture, with hospital indicators falling and wastewater levels rising slightly. However, most states are still seeing low levels overall. Meanwhile, Flu activity is starting to rise.
Covid levels remain low in Hong Kong but Flu levels are still high. In New Zealand, both Covid and Flu levels are low.
The UK's Autumn 2026 Covid Booster campaign started on Oct 1 and details of who is is eligible and how to arrange a vaccination can be found at the following links - England, Scotland, Wales, and Northern Ireland.
By the third week of the campaign in England, vaccine coverage had reached 34% for people aged 75 and older, and 15% for those who are immunosuppressed.
Free Flu vaccinations for those eligible are also available from Oct 1, 2026. Further details can be found at the following links - England, Scotland (invitation letter required), Wales, and Northern Ireland.
As always, it's important to remember that the risk of hospitalisation from Covid increases significantly with age and for the clinically vulnerable. Therefore, it is important to take appropriate measures such as self-isolating when experiencing Covid symptoms and enhancing ventilation or wearing masks whenever possible.
Status of main respiratory diseases in England.
UKHSA have moved to publishing the Flu and COVID-19 surveillance reports fortnightly over the summer so data is only available from the Covid Dashboard this week.
This section starts with the latest data on test positivity rates for Covid in England. It's important to note that positivity is different from prevalence, which reflects the overall percentage of Covid cases in the general population. Appendix 1 offers a more detailed explanation of the distinction.
The following chart shows the test positivity rate for all Covid tests taken mapped against the UKHSA activity thresholds. The thresholds are based on the historical trend for Covid test positivity and, consequently, represent a relative risk. More details on this approach can be found in the Guide to Covid Surveillance Metrics.
The chart shows that the test positivity rate has plateaued and remains at a low activity level. The rate remains highest at 13.4% for those aged 85 and above, then falls to just 2.8% for individuals aged 5 to 14 years.
The next chart shows that positivity rates for all tests carried out differ between regions. While many regions experienced increases in test positivity rates, some saw slight falls. Nevertheless, all regions stayed at a low level of activity. Rates are climbing fastest in the North West, which now holds the second highest rate . In contrast, London, West Midlands and the South West rates are starting to fall. Rates remain lowest in the South West.
The following chart highlights the key indicators of Covid in hospitals: weekly visits to Emergency Departments, test positivity rates among patients with respiratory issues, hospital admission and intensive care rates.
This week, hospital indicators for Covid activity again showed a mixed picture but remained relatively low. While test positivity and intensive care admissions are now falling, hospital admissions and Emergency Department visits continued to rise slowly.
The next chart in this section compares the positivity rate for hospital patients for the main respiratory viruses. Covid positivity rates fell slightly, while Flu rates stayed the same, with both still at low activity levels.The Rhinovirus rate fell slightly but stayed at the medium activity level. Meanwhile, RSV remains at out of season levels.
However, the final chart in this section shows that although Flu rates for this year started rising earlier than in previous years they are now returning to a more normal seasonal pattern.
Scotland weekly hospital admissions and test positivity
Public Health Scotland has now returned to publishing the Viral Respiratory Diseases in Scotland surveillance report weekly.
The latest edition, published on Oct 22, reported that indicators of respiratory infections remain at baseline activity, typical for this time in the season.
Flu activity has stayed stable and at baseline levels across systems this week. However, a slight pre-season rise has pushed numbers just above the usual for this time of year. The highest activity and admissions are seen in adults aged 65 and older.
Covid activity has been stable through laboratory surveillance, remaining at low activity for the fifth consecutive week. Activity was highest in adults aged between 45-74 years. However, increases were observed in both primary care test positivity and in hospital admission data.
The following panel chart presents the latest data for Covid levels in wastewater in blue, weekly Covid test positivity shown in red, Covid hospital admissions depicted in orange, and beds occupied by Covid patients in brown.
All key Covid indicators in Scotland fell slightly this week and remain relatively low compared to previous waves, indicating that this wave may be smaller than earlier ones.
The final chart in this section compares the test positivity rates for hospital patients with respiratory symptoms for Covid, Flu, and RSV. Covid positivity rates broadly stable at 5.5%, while RSV rates remained below baseline levels. Flu rates rose slightly and are now higher than for Covid.
Wales Covid hospital admissions.
The following chart provides the latest trend for weekly hospital admissions for the main respiratory viruses in Wales up to week ending Oct 18, 2026.
Hospital admissions for Covid have increased over the past few weeks and are now at moderate levels.
The weekly Weekly Surveillance Report showed that test positivity remained stable at 6.3% in hospitals and GP practices for week ending Oct 11, 2026. However, consultations with GPs for Covid had increased in recent weeks.
Finally, the report confirmed that Flu circulation remains at low levels, while Respiratory Syncytial Virus (RSV) is holding steady at baseline intensity.
Status of main respiratory diseases in Northern Ireland.
Public Health Northern Ireland's respiratory surveillance report covering Covid activity has now returned to being published weekly. The latest report covers data through to the week ending Oct 18, 2026 and the chart below highlights the test positivity rates for Covid, Flu, and RSV.
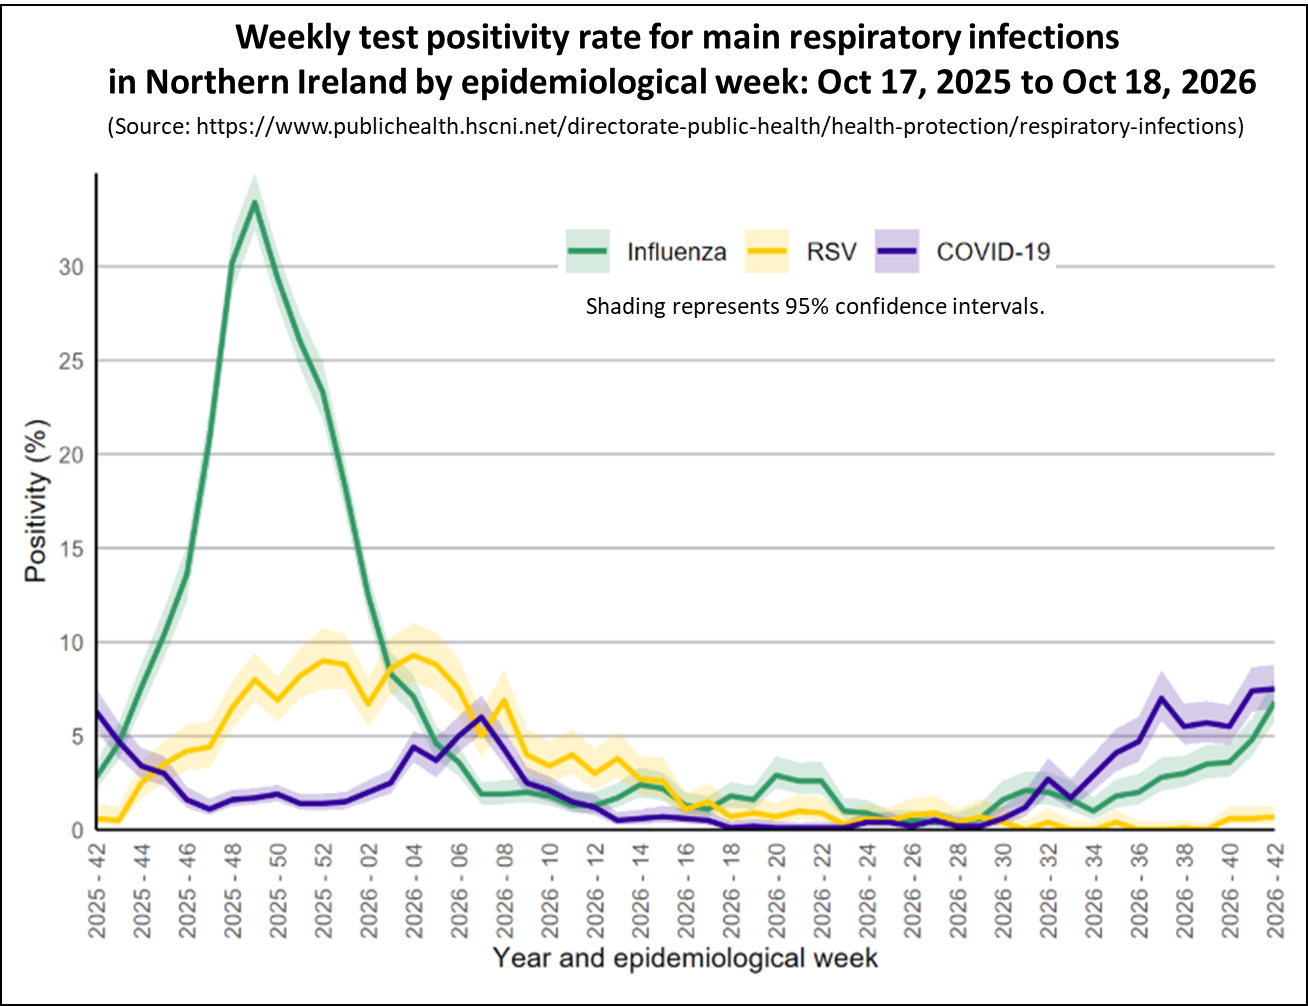
Test positivity was highest among the 5-14 age group for Flu (17.0%), the 0-4 age group for RSV (3.5%), and the 75+ age group for Covid (10.4%).
Influenza activity has increased across the majority of surveillance indicators.
RSV activity remained low and stable across surveillance indicators.
COVID-19 activity showed mixed trends across surveillance indicators.
Overall, Flu activity has increased across the majority of surveillance indicators but still remains low. Covid activity showed a more mixed trend across surveillance indicators and remains low. RSV activity also remained low and is stable across all surveillance indicators.
Covid Activity in Europe.
This section looks at the latest Covid trends in Europe and examines how wastewater patterns align with prevalence and hospital data in selected countries.
The following chart shows the latest levels of Covid up to week ending Oct 15, 2026 as measured by monitoring wastewater in a number of European countries that still publish this information.
This week, Covid levels in wastewater increased in most European countries still sharing this data but remained relatively low apart from in France which appears which is at moderate levels.
Wastewater levels are not the only measures of Covid activity published by these countries and it is valuable to see how well the wastewater trends compare to the other key indicators.
Comparing wastewater levels in Germany and France alongside hospital trends reveals similar patterns. The two charts on the left show Germany's wastewater trends compared to their Covid hospital admissions, while the charts on the right display France's wastewater levels against the percentage of Emergency Department visits due to Covid.
The latest data shows that Covid activity continues to rise slowly in both Germany and France.
In summary, Covid wastewater trends are a reliable indicator of Covid activity in both the community and hospital settings.
Covid Activity in North America.
This section provides details of Covid activity in USA and Canada.
Charts for the USA were updated on Friday, Oct 16 to reflect the latest information.
As of the week ending Oct 10, 2026, Covid indictors of activity in the USA present a mixed picture. While hospital indicators show falling levels of activity, wastewater activity levels increased slightly. While the risk remains low in most states, those in the Southeast and West are showing higher levels of activity.
The following chart shows the weekly trend for the national key Covid indicators covering wastewater activity levels, percent of emergency department visits due to Covid, test positivity, and the hospital admission rate in the USA.
The panel chart shows that the hospital indicators of Covid activity have continued to fall in the week ending Oct 10, 2026, and for most measures are at low levels although test positivity remained moderately high. However, Covid levels in wastewater increased slightly and are now at moderate levels although this may be due to the addition of new testing sites.
While Covid levels are most likely falling, Flu activity is continuing to rise, though still starting from low levels as shown in the following chart.
The next chart shows the Covid trends by state as estimated by the CDC for Oct 13, 2026. Most States are showing a declining trend, depicted in green, or no change as highlighted in grey. This week there are just 10 states showing a likely growing trend, highlighted in orange, compared to 11 in the previous week.
A reminder that the trend represents the direction of activity only and does not indicate the level of activity. Consequently, this map should be used in conjunction with other data like the percent of Emergency Department visits due to Covid.
States marked with vertical bars have low percent of visits to Emergency Departments (ED) for Covid and those marked with horizontal bars have very low percent of visits. More details information is available by hovering your cursor over any State.
The final map for the USA presents wastewater analysis for week ending Oct 10, 2026 presents a contrasting picture. While Wastewater activity levels for Covid are low in many States, several are showing high or very high activity levels. For example, wastewater activity levels in Florida are very high, whereas Emergency Department visits for Florida are low and falling.
Each State is coloured based on activity levels, ranging from very high (dark red) to very low (light green), with grey indicating no data available. States with increasing activity levels are marked with cross-hatching. It is important to understand that the wastewater activity level is relative to the lowest levels seen in the past two years. Consequently, it is not a fixed absolute scale across all years. It is primarily a measure of how current wastewater viral levels compare with recent low levels in that State.
Activity levels are low in most States but are higher in some States in the West and Southeast regions.
In Canada, data for the week ending Oct 10, 2026, shows that Covid wastewater levels stayed at moderate levels, although levels in the western provinces are higher. Flu A activity is starting to rise and is now at a moderate level.
The weekly Canadian respiratory virus surveillance report provides further details on the activity of respiratory viruses. The latest report, covering data through the week ending Oct 10, 2026, indicates that Flu activity has been steadily rising in recent weeks and has surpassed the seasonal threshold of 5% test positivity. If test positivity remains above this threshold next week, the start of the Flu season will be declared. Meanwhile, test positivity for Covid and RSV remains stable and at low activity levels.
Status of main respiratory diseases in Asia and Oceania.
This section provides the latest information on Covid and Flu activity levels in Hong Kong and New Zealand. Unfortunately, there was no update from Singapore published this week.
The following chart displays the key Covid indicators for Hong Kong up to the week ending Oct 17, 2026. Although Covid levels in wastewater samples increased in July, the latest hospital surveillance data shows that the overall local activity of Covid has fallen to very low levels and the recent wave is over.
However, Flu presents a very different picture and the following chart shows that the Flu levels in Hong Kong are presently very high.
Meanwhile New Zealand shows a different picture as Covid activity has remained very low for several months and did not have the peaks seen in Hong Kong,
However, there was a severe flu season that peaked at the end of August but has since declined to low activity, similar to the same period last year.
Spring 2026 Covid Booster campaign.
The NHS Autumn Covid booster campaign started on October 1, 2026. People aged 75 years and older, residents in care homes for older people, and those aged 6 months and over with a weakened immune system will be offered a dose of the Covid vaccine this spring. These are same criteria used for the Spring 2026 and Autumn 2025 booster campaigns.
Full details of eligibility and the vaccines being used for the Spring campaign can be found in the UK Governments Green Book published here.
The following chart shows the number of Covid vaccinations given by week for each of the booster campaigns in England.
During the first three weeks of the Autumn 2026 campaign in England, 2,453,170 booster doses were given, providing 34% coverage for people aged 75 and older and 15% coverage for those who are immunosuppressed. This is slightly lower than the first three weeks of the Spring 2026 campaign and 588,760 fewer than the Autumn 2025 campaign, which had the same group of people eligible.
In conclusion
Although the amount of data currently being published is reduced, the information available for all home nations show that Covid activity is low but rising slowly in England. However, Scotland presented a mixed picture and may have peaked. Flu levels are starting to rise earlier than in previous years.
Covid levels in wastewater is also low but rising across European countries. In the USA, Covid activity is staring to fall and is at low levels, except in a few states. Flu A activity in both the USA and Canada is staring to rise.
As always, if you have any comments on this Covid Situation Report or suggestions for topics to cover, please post a message below.
Thanks for reading Seeing The Forest for the Trees! Subscribe for free to receive new posts and support my work.
Appendix 1. Test positivity rates and prevalence
Positivity rates are derived from the results of hospital laboratory tests conducted on patients exhibiting symptoms of respiratory diseases. Test positivity is the percentage of patients who test positive for Covid of the total number of patients tested. Since the individuals tested for this measure are not a representative sample of the general population it differs from prevalence, which is derived from a representative sample of the population.
This report belongs to a weekly series summarising the Covid situation across the UK's home nations and other countries.
Thanks for reading Seeing The Forest for the Trees! Subscribe for free to receive new posts and support my work.
This week's report highlights the latest trends in respiratory illness activity across England, Scotland, Wales, and Northern Ireland. It also shares provides details on recent Covid activity for selected countries in Europe, North America, and Asia.
Charts for the USA will be updated on Friday, Oct 16 to reflect the latest published data.
Summary.
This week, Covid trends in the UK present a mixed picture. In England, some Covid indicators have risen again, though from low levels, indicating that while the risk remains low, it may be increasing. In Scotland Covid indicators are going in different directions, but Covid levels may have peaked. Data from Wales and Northern Ireland shows Covid levels are stable and remain moderately low.
In England, key hospital indicators for Covid showed a mixed picture this week indicating a low risk of Covid. Positivity rates for all tests carried out have stopped rising and are now falling in some regions that previously had the highest rates. While Flu activity is still low it is rising earlier than previous years.
This week, Covid activity indicators in Scotland again showed a mixed picture but remain relatively low overall. Flu activity, which had started rising earlier than usual, has now settled back into normal seasonal patterns and is at baseline levels.
This week, Covid admissions in Wales remained stable and at moderately low levels ,while Flu and RSV hospitalisations remained stable and low.
In Northern Ireland, all surveillance indicators for Covid and Flu increased slowly but remained at low levels of activity.
Covid levels in wastewater increased slowly this week across most European countries still reporting data, but overall they are still relatively low apart from France which has moderate levels.
For the week ending Oct 3, Covid activity in the USA has continued to fall slowly , with most States now experiencing low levels. Meanwhile Flu activity is starting to rise.
Covid levels remain low in Hong Kong and Singapore, but Flu levels are high.
The UK's Autumn 2026 Covid Booster campaign started on Oct 1 and details of who is is eligible and how to arrange a vaccination can be found at the following links - England, Scotland, Wales, and Northern Ireland.
In the second week of the campaign in England vaccine coverage reached 23% for people aged 75 and over, and 10% for those who are immunosuppressed.
Free Flu vaccinations for those eligible are also available from Oct 1, 2026. Further details can be found at the following links - England, Scotland (invitation letter required), Wales, and Northern Ireland.
As always, it's important to remember that the risk of hospitalisation from Covid increases significantly with age and for the clinically vulnerable. Therefore, it is important to take appropriate measures such as self-isolating when experiencing Covid symptoms and enhancing ventilation or wearing masks whenever possible.
Status of main respiratory diseases in England.
UKHSA have moved to publishing the Flu and COVID-19 surveillance reports fortnightly over the summer so data is only available from the Covid Dashboard this week.
This section starts with the latest data on test positivity rates for Covid in England. It's important to note that positivity is different from prevalence, which reflects the overall percentage of Covid cases in the general population. Appendix 1 offers a more detailed explanation of the distinction.
The following chart shows the test positivity rate for all Covid tests taken mapped against the UKHSA activity thresholds. The thresholds are based on the historical trend for Covid test positivity and, consequently, represent a relative risk. More details on this approach can be found in the Guide to Covid Surveillance Metrics.
The chart shows that the test positivity rate has stopped rising this week and remains at a low activity level. The rate remains highest at 13.5% for those aged 85 and above, then falls to just 1.0% for individuals aged 5 to 14 years.
The next chart shows that positivity rates for all tests carried out differ between regions. While many regions experienced increases in test positivity rates, some saw slight falls. Nevertheless, all regions stayed at a low level of activity. Rates are climbing fastest in the East of England, which now holds the highest rate and is nearing medium activity levels. In contrast, London, West Midlands and Yorkshire & Humberside rates are starting to fall. Meanwhile rates are lowest in the South West and East Midlands.
The following chart highlights the key indicators of Covid in hospitals: weekly visits to Emergency Departments, test positivity rates among patients with respiratory issues, hospital admission and intensive care rates.
This week, hospital indicators for Covid activity showed a mixed picture but remained relatively low. While test positivity and hospital admissions continued to rise slowly, Emergency Department visits and intensive care admissions stayed steady.
The next chart in this section compares the positivity rate for hospital patients for the main respiratory viruses, with Covid and Flu positivity rates remain at low activity levels even with slight increases. The Rhinovirus rate is also rising and is at medium activity level. Meanwhile, RSV remains at out of season levels.
However, the final chart in this section shows that Flu rates for this year have started rising earlier than in previous years indicating an early start to this years Flu season.
Scotland weekly hospital admissions and test positivity
Public Health Scotland has now returned to publishing the Viral Respiratory Diseases in Scotland surveillance report weekly.
The latest edition, published on Oct 15, reported that indicators of respiratory infections remain at baseline activity, typical for this time in the season.
Following an earlier than expected rise in Flu last week, laboratory surveillance has seen falls in test positivity and incidence rates this week. Activity levels among laboratory confirmed cases remained low in adults aged 65-74 years but was baseline for all other ages. Hospital admissions for any Flu have also decreased. Adults 65 years and older represent more than half of admissions, as is typical.
The following panel chart presents the latest data for Covid levels in wastewater in blue, weekly Covid test positivity shown in red, Covid hospital admissions depicted in orange, and beds occupied by Covid patients in brown.
Although wastewater increased slightly this week, hospital admissions and test positivity fell fell a little, presenting a mixed picture. However, all indicators remained relatively low compared to previous waves, suggesting that this will be smaller than earlier ones.
The final chart in this section compares the test positivity rates for hospital patients with respiratory symptoms for Covid, Flu, and RSV. Covid positivity rates stayed at 5.6%, while RSV rates remained stable and below baseline levels. Flu rates fell slightly and are no longer increasing earlier than in previous years.
Wales Covid hospital admissions.
The following chart provides the latest trend for weekly hospital admissions for the main respiratory viruses in Wales up to week ending Oct 11, 2026.
Hospital admissions for Covid have increased over the past few weeks, but appear to have stabilised this week.
The weekly Weekly Surveillance Report covering data up to for Oct 4, 2024 confirms that although overall Covid admissions fell slightly, Covid activity in the community increased by a small amount.
Finally, the infection report confirmed that Flu circulation remains at low levels, while Respiratory Syncytial Virus (RSV) is holding steady at baseline intensity.
Status of main respiratory diseases in Northern Ireland.
Public Health Northern Ireland's respiratory surveillance report covering Covid activity has now returned to being published weekly. The latest report covers data through to the week ending Oct 11, 2026 and the chart below highlights the test positivity rates for Covid, Flu, and RSV.
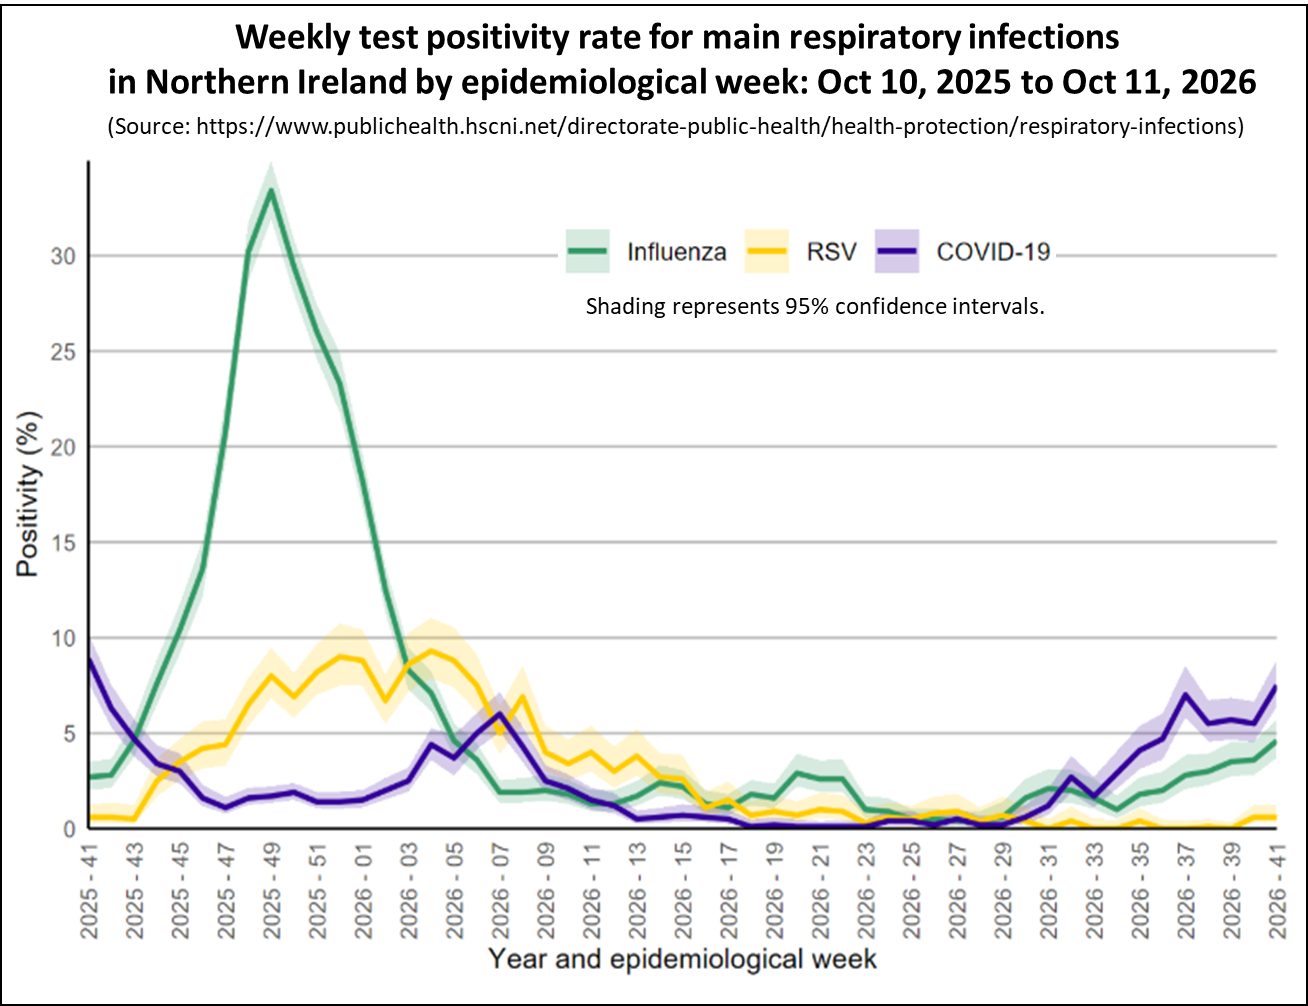
Covid and Flu activity has increased across most surveillance indicators but remains low. RSV activity remained low and stable across surveillance indicators.
Covid Activity in Europe.
This section looks at the latest Covid trends in Europe and examines how wastewater patterns align with prevalence and hospital data in selected countries.
The following chart shows the latest levels of Covid up to week ending Oct 8, 2026 as measured by monitoring wastewater in a number of European countries that still publish this information.
This week, Covid levels in wastewater increased in most European countries still sharing this data but remained relatively low apart from in France which appears to have now peaked at moderate levels.
Wastewater levels are not the only measures of Covid activity published by these countries and it is valuable to see how well the wastewater trends compare to the other key indicators.
The Netherlands is the only country in Europe still publishing prevalence data. Estimates of the percentage of the population with Covid are based on a weekly survey of volunteers. Since this isn't a random survey, statistical adjustments are made to reflect the demographics of the Netherlands.
The following chart displays the latest Covid wastewater trend in orange, the estimated prevalence in red, and the percentage of detections from laboratory surveillance in green, all for the Netherlands.
The chart shows how closely the trend for Covid wastewater follows the trend for prevalence and the percent of Covid detected in laboratory surveillance. All of these indicators of Covid activity in the Netherlands again increased slowly this week, but remain historically low.
Comparing wastewater levels in Germany and France alongside hospital trends reveals a similar pattern. The two charts on the left show Germany's wastewater trends compared to their Covid hospital admissions, while the charts on the right display France's wastewater levels against the percentage of Emergency Department visits due to Covid.
The latest data shows that Covid activity continues to rise slowly in Germany. While in France Covid levels in wastewater appear to have peaked, although visits to Emergency Departments continue to rise slowly.
In summary, Covid wastewater trends are a reliable indicator of Covid activity in both the community and hospital settings.
Covid Activity in North America.
This section provides details of Covid activity in USA and Canada.
Charts for the USA will be updated on Friday, Oct 16 to reflect the latest information.
As of the week ending Oct 3, 2026, Covid activity in the USA is staring to fall, indicating that the risk remains low in most states, and those states in the South and West which previously had higher levels of activity are starting to see falling levels.
The following chart shows the weekly trend for the national key Covid indicators covering wastewater activity levels, percent of emergency department visits due to Covid, test positivity, and the hospital admission rate in the USA.
The panel chart shows that the hospital indicators of Covid activity have continued to fall in the week ending Oct 3, 2026, and for most measures are at low levels although test positivity remained moderately high. Although Covid levels in wastewater are unchanged, this may be due to the addition of new testing sites.
While Covid levels are falling, Flu activity is beginning to increase, though still starting from low levels as shown in the following chart.
The next chart shows the Covid trends by state as estimated by the CDC for Oct 6, 2026. Most States are showing a declining trend or no change. This week there are just 11 states showing a growing trend compared to 19 in the previous week.
A reminder that the trend represents the direction of activity only and does not indicate the level of activity. Consequently, this map should be used in conjunction with other data like the percent of Emergency Department visits due to Covid. This information is available by hovering your cursor over any State even if the trend is not estimated.
The final map for the USA presents wastewater analysis for week ending Oct 3, 2026 and shows that Covid levels are low in many States as illustrated in the following map.
Each State is coloured based on activity levels, ranging from very high (dark red) to very low (light green), with grey indicating no data available. States with increasing activity levels are marked with cross-hatching. It is important to understand that the wastewater activity level is relative to the lowest levels seen in the past two years. Consequently, it is not a fixed absolute scale across all years. It is primarily a measure of how current wastewater viral levels compare with recent low levels in that State.
Activity is at a moderate level in States in the West regions. However, Florida wastewater activity levels has risen to very high this week, even though the estimated trend shown in the previous map indicates that activity levels based on other measures are falling.
In Canada, data for the week ending Oct 3, 2026, shows that Covid wastewater levels stayed at moderate levels, although levels in the western provinces are higher. Flu A activity is starting to rise and is now at a moderate level.
Status of main respiratory diseases in Asia.
This section provides the latest information on Covid and Flu activity levels in Hong Kong and Singapore.
The following chart displays the key Covid indicators for Hong Kong up to the week ending Oct 10, 2026. Although Covid levels in wastewater samples increased in July, the latest hospital surveillance data shows that the overall local activity of Covid has fallen to very low levels and the recent wave is over.
However, Flu presents a very different picture and the following chart shows that the Flu levels in Hong Kong is presently very high.
The final chart in this section presents the weekly Covid positivity rate for tests carried out on patients with respiratory symptoms in Singapore up to week ending Sep 26, 2026. It shows that Covid activity peaked in May, consistent with the previous two years, and has now fallen to low levels.
However, Flu activity is high in Singapore, similar to Hong Kong.
Spring 2026 Covid Booster campaign.
The NHS Autumn Covid booster campaign started on October 1, 2026. People aged 75 years and older, residents in care homes for older people, and those aged 6 months and over with a weakened immune system will be offered a dose of the Covid vaccine this spring. These are same criteria used for the Spring 2026 and Autumn 2025 booster campaigns.
Full details of eligibility and the vaccines being used for the Spring campaign can be found in the UK Governments Green Book published here.
The following chart shows the number of Covid vaccinations given by week for each of the booster campaigns in England.
During the first two weeks of the Autumn 2026 campaign in England, 1,667,056 booster doses were given, providing 23% coverage for people aged 75 and older and 10% coverage for those who are immunosuppressed. This is lower than the first two weeks of the Spring 2026 campaign and 583,127 fewer than the Autumn 2025 campaign, which had the same group of people eligible.
In conclusion
Although the amount of data currently being published is reduced, the information available for all home nations show that Covid activity is low but rising slowly in England. However, Scotland presented a mixed picture and may have peaked. Flu levels are starting to rise earlier than in previous years.
Covid levels in wastewater is also low but rising across European countries. In the USA, Covid activity is staring to fall and is at low levels, except in a few states. Flu A activity in both the USA and Canada is staring to rise.
As always, if you have any comments on this Covid Situation Report or suggestions for topics to cover, please post a message below.
Thanks for reading Seeing The Forest for the Trees! Subscribe for free to receive new posts and support my work.
Appendix 1. Test positivity rates and prevalence
Positivity rates are derived from the results of hospital laboratory tests conducted on patients exhibiting symptoms of respiratory diseases. Test positivity is the percentage of patients who test positive for Covid of the total number of patients tested. Since the individuals tested for this measure are not a representative sample of the general population it differs from prevalence, which is derived from a representative sample of the population.
This report belongs to a weekly series summarising the Covid situation across the UK's home nations and other countries.
Thanks for reading Seeing The Forest for the Trees! Subscribe for free to receive new posts and support my work.
This week's report highlights the latest trends in respiratory illness activity across England and Wales only. It also shares recent Covid levels in selected countries in Europe, North America and Asia.
Charts for the USA were updated on Friday, Oct 9 to reflect the latest published data.
Public Health Scotland have resumed publishing Covid data as last weeks technical issues are now resolved.
Summary.
This week, Covid trends in the UK present a mixed picture. In England, Covid indicators have risen again, though from low levels, indicating that while the risk remains low, it is increasing. In Scotland Covid indicators are going in different directions, but Covid levels may have peaked. Data from Wales and Northern Ireland shows Covid levels are stable and remain moderately low.
In England, all key indicators increased this week indicating a low but increasing risk of Covid. Test positivity rates are now low across all regions but continue to remain highest in London, the West Midlands, and Yorkshire & Humberside. Whilst Flu activity is low it is rising earlier than previous years.
Although there was no data available at the time of publishing, Public Health Scotland did report "that there is no unusual activity identified from the data that have been received this week".
This week, Covid admissions in Wales remained stable and at moderately low levels ,while Flu and RSV hospitalisations remained stable and low.
In Northern Ireland, Covid activity showed a mixed picture, but remained relatively stable and low across most surveillance indicators.
Covid levels in wastewater increased slowly this week across most European countries still reporting data, but overall they are still relatively low apart from France which has moderate levels.
For the week ending Oct 3, Covid activity in the USA has continued to fall slowly , with most States now experiencing low levels. Meanwhile Flu activity is starting to rise.
Covid levels remain low in Hong Kong and Singapore, but Flu activity is currently high.
With the UK Flu season likely starting a bit earlier this year, now's the time to get vaccinated. Free Flu vaccinations for those eligible will be available from Oct 1, 2026. Further details can be found at the following links - England, Scotland (invitation letter required), Wales, and Northern Ireland.
The UK's Autumn 2026 Covid Booster campaign also starts on Oct 1 and details of who is is eligible and how to arrange a vaccination can be found at the following links - England, Scotland, Wales, and Northern Ireland (not presently available).
As always, it's important to remember that the risk of hospitalisation from Covid increases significantly with age and for the clinically vulnerable. Therefore, it is important to take appropriate measures such as self-isolating when experiencing Covid symptoms and enhancing ventilation or wearing masks whenever possible.
Status of main respiratory diseases in England.
UKHSA have moved to publishing the Flu and COVID-19 surveillance reports fortnightly over the summer so data is only available from the Covid Dashboard this week.
This section starts with the latest data on test positivity rates for Covid in England. It's important to note that positivity is different from prevalence, which reflects the overall percentage of Covid cases in the general population. Appendix 1 offers a more detailed explanation of the distinction.
The following chart shows the test positivity rate for all Covid tests taken mapped against the UKHSA activity thresholds. The thresholds are based on the historical trend for Covid test positivity and, consequently, represent a relative risk. More details on this approach can be found in the Guide to Covid Surveillance Metrics.
The chart shows that the test positivity rate is steadily rising and, though still at a low activity level, signals a growing level of risk. The rate remains highest at 13.1% for those aged 85 and above and at 10.7% for people between 15 and 24 years old, then falls to just 1.2% for individuals aged 5 to 14 years.
The next chart shows that positivity rates for all tests carried out differ between regions. All regions saw increased test positivity rates and are now at a low level of activity. In particular, rates are rising fast in the London which has the highest rate and is close to medium activity levels. West Midland and Yorkshire & Humberside rates are relatively high. Meanwhile rates are lowest in the South West and East of England.
The following chart highlights the key indicators of Covid in hospitals: weekly visits to Emergency Departments, test positivity rates among patients with respiratory issues, hospital admission and intensive care rates.
All of these hospital indicators for Covid activity increased, indicating a low but rising risk.
The final chart in this section compares the positivity rate for hospital patients for the main respiratory viruses, with Covid and Flu positivity rates remain at low activity levels even with slight increases. However, Flu rates have started rising earlier than in previous years. The Rhinovirus rate is also rising and has now moved to medium activity level. Meanwhile, RSV remains at out of season levels.
Scotland weekly hospital admissions and test positivity
Public Health Scotland has now returned to publishing the Viral Respiratory Diseases in Scotland surveillance report weekly.
The latest edition, published on Oct 8, reported that indicators of respiratory infections remain at baseline activity, typical for this time in the season.
However, pre-season increases in Flu have been detected in both laboratory and community acute respiratory infection surveillance. Flu activity is noticeably higher this week compared to past seasons, especially among adults aged 65 and older, who make up more than half of all flu hospitalisations.
The following panel chart presents the latest data for Covid levels in wastewater in blue, weekly Covid test positivity shown in red, Covid hospital admissions depicted in orange, and beds occupied by Covid patients in brown.
Although wastewater and test positivity fell slightly this week, hospital admissions increased a little, presenting a mixed picture. However, all indicators remained relatively low compared to previous waves, suggesting that this will be smaller than earlier ones.
The final chart in this section compares the test positivity rates for hospital patients with respiratory symptoms for Covid, Flu, and RSV. Covid positivity rates fell to 5.6% from 7.1% in the previous week, while RSV rates remained stable and below baseline levels. Flu rates continue to increase and earlier than in previous years, suggesting the Flu season is starting early.
Wales Covid hospital admissions.
The following chart provides the latest trend for weekly hospital admissions for the main respiratory viruses in Wales up to week ending Oct 4, 2026.
Hospital admissions for Covid have increased over the past few weeks, but appear to have stabilised this week.
The weekly Weekly Surveillance Report for Oct 2, 2024 confirms that Covid activity is increasing. While the overall proportion of samples testing positive stayed steady at 7.3% in hospitals and GP practices, GP consultations for Covid have increased in recent weeks.
Finally, the infection report confirmed that Flu circulation is at low levels, while Respiratory Syncytial Virus (RSV) is holding steady at baseline intensity.
Status of main respiratory diseases in Northern Ireland.
Public Health Northern Ireland's respiratory surveillance report covering Covid activity has now returned to being published weekly. The latest report covers data through to the week ending Oct 4, 2026 and the chart below highlights the test positivity rates for Covid, Flu, and RSV.
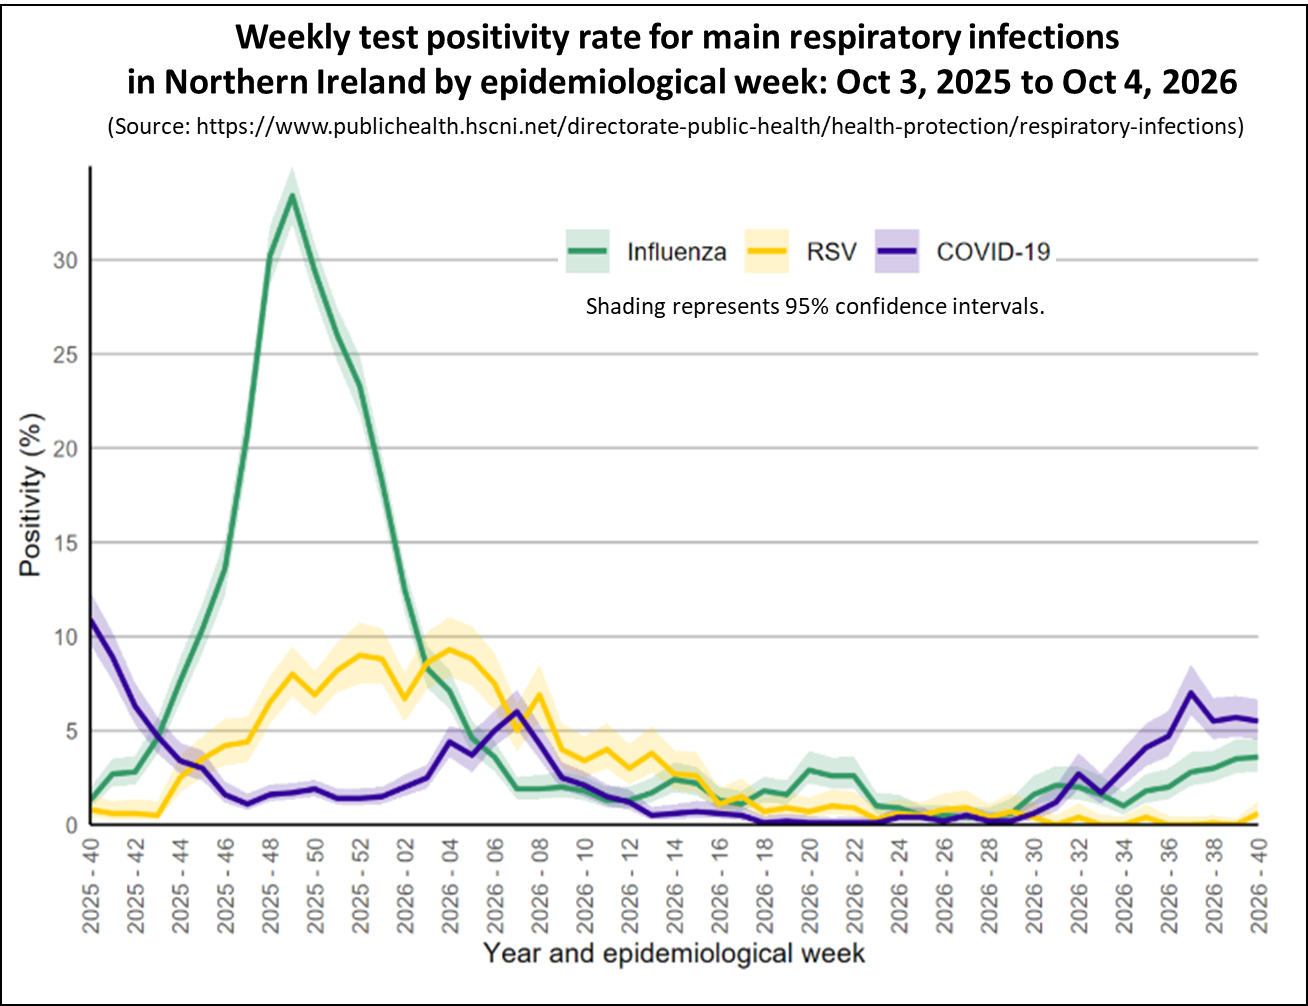
Covid activity showed mixed trends, with increases seen in some surveillance indicators, but remained at low levels. Flu and RSV activity remained low and stable across all surveillance indicators.
Covid Activity in Europe.
This section looks at the latest Covid trends in Europe and examines how wastewater patterns align with prevalence and hospital data in selected countries.
The following chart shows the latest levels of Covid up to week ending Oct 1, 2026 as measured by monitoring wastewater in a number of European countries that still publish this information.
This week, Covid levels in wastewater increased in most European countries still sharing this data but remained relatively low apart from in France which now at moderate levels.
Wastewater levels are not the only measures of Covid activity published by these countries and it is valuable to see how well the wastewater trends compare to the other key indicators.
The Netherlands is the only country in Europe still publishing prevalence data. Estimates of the percentage of the population with Covid are based on a weekly survey of volunteers. Since this isn't a random survey, statistical adjustments are made to reflect the demographics of the Netherlands.
The following chart displays the latest Covid wastewater trend in orange, the estimated prevalence in red, and the percentage of detections from laboratory surveillance in green, all for the Netherlands.
The chart clearly shows how closely the trend for Covid wastewater follows the trend for prevalence and the percent of Covid detected in laboratory surveillance. All of these indicators of Covid activity in the Netherlands again increased this week, but remain relatively low.
Comparing wastewater levels in Germany and France alongside hospital trends reveals a similar pattern. The two charts on the left show Germany's wastewater trends compared to their Covid hospital admissions, while the charts on the right display France's wastewater levels against the percentage of Emergency Department visits due to Covid.
The latest data shows that Covid activity is rising in both countries, with levels in France now approaching moderately low levels.
In summary, Covid wastewater trends are a reliable indicator of Covid activity in both the community and hospital settings.
Covid Activity in North America.
This section provides details of Covid activity in USA and Canada.
Charts for the USA were updated on Friday, Oct 9 to reflect the latest information.
As of the week ending Oct 3, 2026, Covid activity in the USA is staring to fall, indicating that the risk remains low in most states, and those states in the South and West which previously had higher levels of activity are starting to see falling levels.
The following chart shows the weekly trend for the national key Covid indicators covering wastewater activity levels, percent of emergency department visits due to Covid, test positivity, and the hospital admission rate in the USA.
The panel chart shows that the hospital indicators of Covid activity have continued to fall in the week ending Oct 3, 2026, and for most measures are at low levels although test positivity remained moderately high. Although Covid levels in wastewater are unchanged, this may be due to the addition of new testing sites.
While Covid levels are falling, Flu activity is beginning to increase, though still starting from low levels as shown in the following chart.
The next chart shows the Covid trends by state as estimated by the CDC for Oct 6, 2026. Most States are showing a declining trend or no change. This week there are just 11 states showing a growing trend compared to 19 in the previous week.
A reminder that the trend represents the direction of activity only and does not indicate the level of activity. Consequently, this map should be used in conjunction with other data like the percent of Emergency Department visits due to Covid. This information is available by hovering your cursor over any State even if the trend is not estimated.
The final map for the USA presents wastewater analysis for week ending Oct 3, 2026 and shows that Covid levels are low in many States as illustrated in the following map.
Each State is coloured based on activity levels, ranging from very high (dark red) to very low (light green), with grey indicating no data available. States with increasing activity levels are marked with cross-hatching. It is important to understand that the wastewater activity level is relative to the lowest levels seen in the past two years. Consequently, it is not a fixed absolute scale across all years. It is primarily a measure of how current wastewater viral levels compare with recent low levels in that State.
Activity is at a moderate level in States in the West regions. However, Florida wastewater activity levels has risen to very high this week, even though the estimated trend shown in the previous map indicates that activity levels based on other measures are falling.
In Canada, data for the week ending Sep 26, 2026, shows that Covid wastewater levels stayed at moderate levels, although levels in the western provinces are higher. Flu A activity is starting to rise and is now at a moderate level.
Status of main respiratory diseases in Asia.
This section provides the latest information on Covid and Flu activity levels in Hong Kong and Singapore.
The following chart displays the key Covid indicators for Hong Kong up to the week ending Oct 3, 2026. Although Covid levels in wastewater samples increased in July, the latest hospital surveillance data shows that the overall local activity of Covid has fallen to very low levels and the recent wave is over.
However, Flu presents a very different picture and the following chart shows that the Flu levels in Hong Kong is presently very high.
The next chart presents the weekly Covid positivity rate for tests carried out on patients with respiratory symptoms in Singapore up to week ending Sep 19, 2026. It shows that Covid activity peaked in May, consistent with the previous two years, and has now fallen to low levels.
However, Flu activity is high in Singapore, similar to Hong Kong.
In conclusion
Although the amount of data currently being published is reduced, the information available for all home nations show that Covid activity is low but rising slowly in England. However, Scotland presented a mixed picture and may have peaked.
Covid levels in wastewater is also low but rising across European countries. In the USA, Covid activity is staring to fall and is at low levels, except in a few states. Flu A activity in both the USA and Canada is staring to rise.
As always, if you have any comments on this Covid Situation Report or suggestions for topics to cover, please post a message below.
Thanks for reading Seeing The Forest for the Trees! Subscribe for free to receive new posts and support my work.
Appendix 1. Test positivity rates and prevalence
Positivity rates are derived from the results of hospital laboratory tests conducted on patients exhibiting symptoms of respiratory diseases. Test positivity is the percentage of patients who test positive for Covid of the total number of patients tested. Since the individuals tested for this measure are not a representative sample of the general population it differs from prevalence, which is derived from a representative sample of the population.
This report belongs to a weekly series summarising the Covid situation across the UK's home nations and other countries.
Thanks for reading Seeing The Forest for the Trees! Subscribe for free to receive new posts and support my work.
This week's report highlights the latest trends in respiratory illness activity across England and Wales only. It also shares recent Covid levels in selected countries in Europe, North America and Asia.
Charts for the USA and Canada will be updated on Friday, Oct 2 to reflect the latest published data.
Public Health Scotland have not yet published Covid data due to technical issues. The section on Scotland will be updated as soon as this data is available.
Summary.
This week, Covid activity in the UK presents a mixed picture. In England, Covid indicators have risen again, though from low levels, indicating that while the risk remains low, it is starting to increase. Revised data from Wales shows Covid levels are rising but remain moderately low.
In England, all key indicators increased this week indicating a low but increasing risk of Covid. Test positivity rates are climbing fastest in the West Midlands, London, and Yorkshire & Humberside, highlighting notable regional differences.
Although there was no data available at the time of publishing, Public Health Scotland did report "that there is no unusual activity identified from the data that have been received this week".
This week, Public Health Wales revised their data on Covid hospital admissions to fix a reporting error. The corrected data now shows that Covid admissions in Wales are rising, indicating an increasing level of risk. Flu and RSV hospitalisations remained stable and very low.
There was no update for Northern Ireland this week. The previous week showed mixed trends in Covid activity, with some surveillance indicators increasing, but overall levels remaining low.
Covid levels in wastewater increased slowly this week across all European countries still reporting data, but overall they are still relatively low apart from France which has moderate levels.
For the week ending Sep 19, Covid activity in the USA has been slowly falling, with most States now experiencing low levels. Many areas that previously had higher activity, especially in the West and South, are seeing drops. Texas still shows relatively high wastewater activity, but it's trending downward.
Hong Kong and Singapore remain at low levels of Covid activity.
With the UK Flu season likely starting a bit earlier this year, now's the time to get vaccinated. Free Flu vaccinations for those eligible will be available from Oct 1, 2026. Further details can be found at the following links - England, Scotland (invitation letter required), Wales, and Northern Ireland.
The UK's Autumn 2026 Covid Booster campaign also starts on Oct 1 and details of who is is eligible and how to arrange a vaccination can be found at the following links - England, Scotland, Wales, and Northern Ireland (not presently available).
As always, it's important to remember that the risk of hospitalisation from Covid increases significantly with age and for the clinically vulnerable. Therefore, it is important to take appropriate measures such as self-isolating when experiencing Covid symptoms and enhancing ventilation or wearing masks whenever possible.
Status of main respiratory diseases in England.
UKHSA have moved to publishing the Flu and COVID-19 surveillance reports fortnightly over the summer so data is only available from the Covid Dashboard this week.
This section starts with the latest data on test positivity rates for Covid in England. It's important to note that positivity is different from prevalence, which reflects the overall percentage of Covid cases in the general population. Appendix 1 offers a more detailed explanation of the distinction.
This chart displays the test positivity rate from the UK's Covid dashboard for all Covid tests, compared against the UKHSA activity thresholds. The thresholds are based on the historical trend for Covid test positivity and, consequently, represent a relative risk. More details on this approach can be found in the Guide to Covid Surveillance Metrics.
The chart shows that the test positivity rate continues to increase and is well within the low level of activity, indicating a low but increasing level of risk.
The next chart shows that positivity rates for all tests carried out differ between regions. All regions saw increased test positivity rates and are now at a low level of activity apart from the North East. In particular, rates are rising fast in the West Midland which has the highest rate and is very close to medium activity levels. London rates are also rising quickly and are their highest level for two years. Yorkshire & Humberside rates are also rising fast. Meanwhile rates are lowest in the north East and South West.
Scotland weekly hospital admissions and test positivity
Public Health Scotland reported that due to technical issues there was no release of Covid data or the weekly viral respiratory diseases surveillance report on Thursday 1 October.
This section will be update when data becomes available.
However, they did advise that there is no unusual activity identified from the data that have been received this week.
The latest edition of the report published on Sep 17, confirms that during the reporting period Aug 10 to Sep 6 , 2026 all respiratory disease indicators for Covid, Flu and RSV remained at baseline activity. However, Covid test positivity increased to an average of 3.7% across this period in community surveillance, up from 1.3%. In laboratory surveillance, activity remained at baseline despite case numbers doubling from 65 to 128. This shows a similar trend to the same time last year, but at lower levels overall. The XFG variant accounted for the majority (61%) of detections in the most recent sequencing data available.
The following panel chart presents last weeks data for Covid levels in wastewater in blue, weekly Covid test positivity shown in red, Covid hospital admissions depicted in orange, and beds occupied by Covid patients in brown.
After a drop the previous week, all key indicators of Covid activity increased slightly this week, suggesting the wave isn't over yet but will likely be smaller than earlier ones.
The final chart in this section compares the test positivity rates for hospital patients with respiratory symptoms for Covid, Flu, and RSV for last week. Covid positivity rates rose to 5.6% from 3,9% in the previous week, while RSV rates remained stable and below baseline levels. Flu rates continue to increase slowly and earlier than in previous years, suggesting the Flu season may be starting early.
Wales Covid hospital admissions.
The following chart provides the latest trend for weekly hospital admissions for the main respiratory viruses in Wales up to week ending Sep 27, 2026.
Hospital admissions for Covid have increased over the past few weeks. Unfortunately, data published for the past few weeks has under-reported Covid admissions. Public Health Wales have now identified and resolved the issue.
The weekly Acute Respiratory Infection Report confirms that Covid activity is increasing. While the overall proportion of samples testing positive stayed steady at 7.3% in hospitals and GP practices, GP consultations for Covid have increased in recent weeks.
Finally, the infection report confirmed that Flu circulation is at low levels, while Respiratory Syncytial Virus (RSV) is holding steady at baseline intensity.
Status of main respiratory diseases in Northern Ireland.
Public Health Northern Ireland's respiratory surveillance report covering Covid activity is published every two weeks over the summer period. There was no updated report published this week. The latest available report covers data through to the week ending Sep 20, 2026 and the chart below highlights the test positivity rates for Covid, Flu, and RSV.
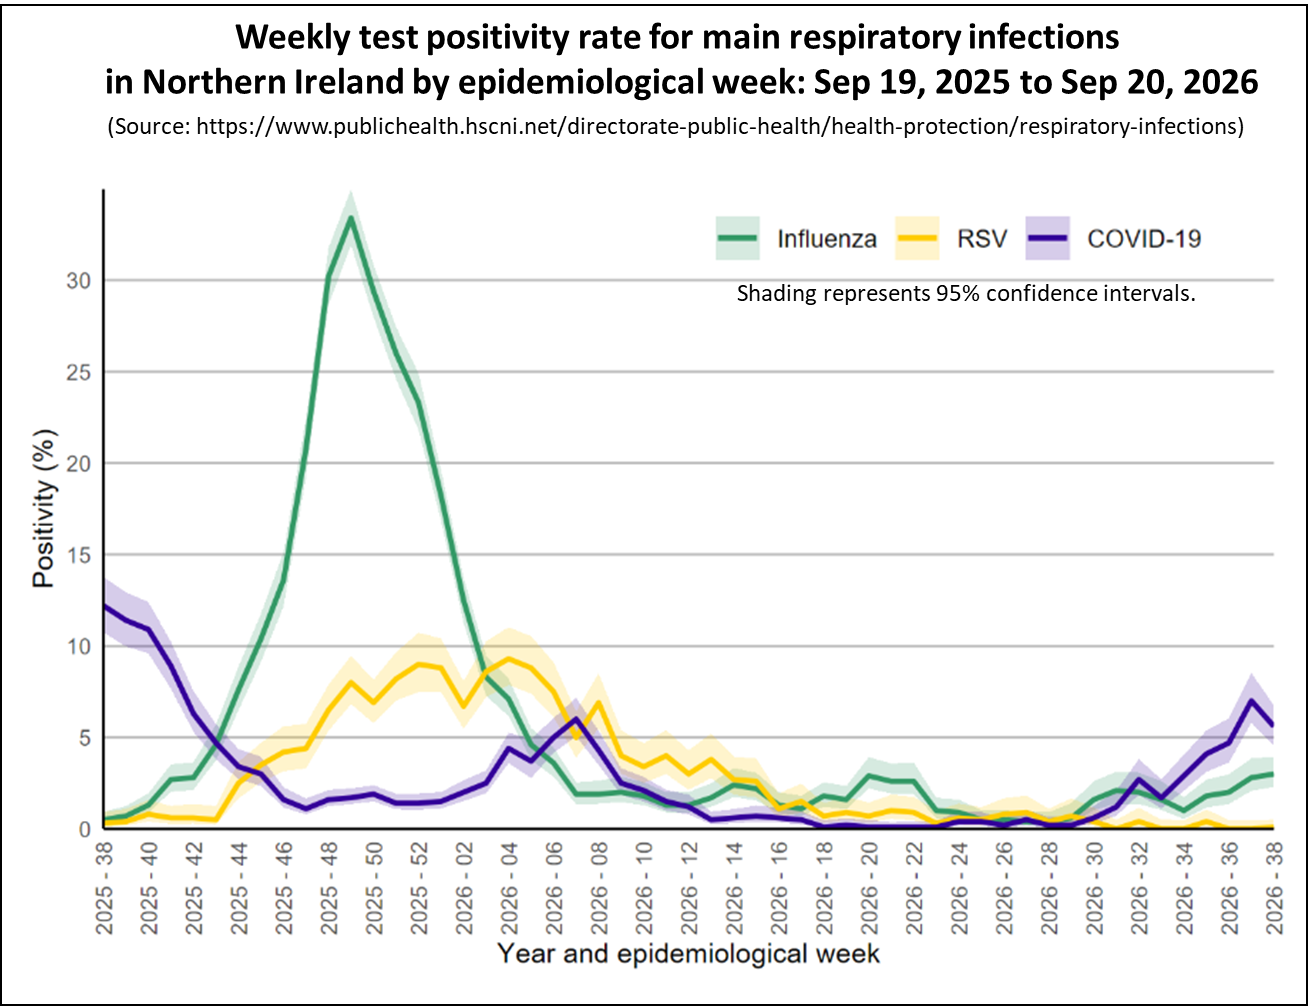
Covid activity showed mixed trends, with increases seen in some surveillance indicators, but remained at low levels. Flu activity increased across all surveillance indicators although it stayed at low levels. Finally, RSV activity remained low and stable across surveillance indicators.
Covid Activity in Europe.
This section looks at the latest Covid trends in Europe and examines how wastewater patterns align with prevalence and hospital data in selected countries.
The following chart shows the latest levels of Covid up to week ending Sep 24, 2026 as measured by monitoring wastewater in a number of European countries that still publish this information.
This week, Covid levels in wastewater increased in all European countries still sharing this data but remained relatively low apart from France
Wastewater levels are not the only measures of Covid activity published by these countries and it is valuable to see how well the wastewater trends compare to the other key indicators.
The Netherlands is the only country in Europe still publishing prevalence data. Estimates of the percentage of the population with Covid are based on a weekly survey of volunteers. Since this isn't a random survey, statistical adjustments are made to reflect the demographics of the Netherlands.
The following chart displays the latest Covid wastewater trend in orange, the estimated prevalence in red, and the percentage of detections from laboratory surveillance in green, all for the Netherlands.
The chart clearly shows how closely the trend for Covid wastewater follows the trend for prevalence and the percent of Covid detected in laboratory surveillance. All of these indicators of Covid activity in the Netherlands are presently relatively low.
Comparing wastewater levels in Germany and France alongside hospital trends reveals a similar pattern. The two charts on the left show Germany's wastewater trends compared to their Covid hospital admissions, while the charts on the right display France's wastewater levels against the percentage of Emergency Department visits due to Covid.
The latest data shows that although Covid activity is rising in both countries, levels in France are now approaching moderately low levels.
In summary, Covid wastewater trends are a reliable indicator of Covid activity in both the community and hospital settings.
Covid Activity in North America.
This section provides details of Covid activity in USA and Canada.
Charts for the USA and Canada will be updated on Friday, Oct 2 to reflect the latest information.
As of the week ending Sep 19, 2026, Covid activity in the USA is staring to fall, indicating that the risk remains low in most states, and those states in the South and West which previously had higher levels of activity are starting to see falling levels.
The following chart shows the weekly trend for the national key Covid indicators covering wastewater activity levels, percent of emergency department visits due to Covid, test positivity, and the hospital admission rate in the USA.
The panel chart shows that the key indicators of Covid activity have fallen slightly for the week ending Sep 19, 2026, and for most measures are at low levels although test positivity remained moderately high.
Wastewater analysis for week ending Sep 19, 2026 showed that Covid levels are low in many States as illustrated in the following map. Activity is at a moderate level in States in the West regions. Texas activity levels fell to high this week, although other measures show that activity is low.
Each State is coloured based on activity levels, ranging from very high (dark red) to very low (light green), with grey indicating no data available. States with increasing activity levels are marked with cross-hatching. It is important to understand that the wastewater activity level is relative to the lowest levels seen in the past two years. Consequently, it is not a fixed absolute scale across years. It is primarily a measure of how current wastewater viral levels compare with recent low levels in the State.
The final chart for the USA presents the Covid trends by state as estimated by the CDC. Most States are showing a declining trend or no change. This week there are just 20 states showing a growing trend compared to 30 in the previous week.
A reminder that the trend represents the direction of activity only and does not indicate the level of activity. Consequently, this map should be used in conjunction with other data like the percent of Emergency Department visits due to Covid. This information is available by hovering your cursor over any State even if the trend is not estimated.
In Canada, data for the week ending Sep 5, 2026, shows that Covid wastewater levels stayed at moderate levels, although levels in the western provinces remained higher.
Covid Activity in Asia.
This section provides the latest information on Covid activity levels in Hong Kong and Singapore.
The following chart displays the key Covid indicators for Hong Kong up to the week ending Sep 24, 2026. Although Covid levels in wastewater samples increased in July, the latest hospital surveillance data shows that the overall local activity of Covid has fallen to very low levels and the recent wave is over.
The next chart presents the weekly Covid positivity rate for tests carried out on patients with respiratory symptoms in Singapore up to week ending Sep 12, 2026. It shows that Covid activity peaked in May, consistent with the previous two years, and has now fallen to low levels.
In conclusion
Although the amount of data currently being published is reduced, the information available for all home nations show that Covid activity is low but rising slowly in England and Wales.
Covid levels in wastewater is also low but rising across European countries. In the USA, Covid activity has increased but is still at low levels, except in a few states. Flu A activity in both the USA and Canada have dropped to low levels.
As always, if you have any comments on this Covid Situation Report or suggestions for topics to cover, please post a message below.
Thanks for reading Seeing The Forest for the Trees! Subscribe for free to receive new posts and support my work.
Appendix 1. Test positivity rates and prevalence
Positivity rates are derived from the results of hospital laboratory tests conducted on patients exhibiting symptoms of respiratory diseases. Test positivity is the percentage of patients who test positive for Covid of the total number of patients tested. Since the individuals tested for this measure are not a representative sample of the general population it differs from prevalence, which is derived from a representative sample of the population.
This report belongs to a weekly series summarising the Covid situation across the UK's home nations and other countries.
Thanks for reading Seeing The Forest for the Trees! Subscribe for free to receive new posts and support my work.
This week's report highlights the latest trends in respiratory illness activity across England, with updated figures for Scotland, and Wales, and Northern Ireland. It also shares recent Covid levels in selected countries in Europe and North America.
Charts for the USA will be updated on Friday, Sep 25 to reflect the latest published data.
Summary.
This week, Covid activity in the UK presents a mixed picture. In England, Covid indicators have risen again, though from low levels, indicating that while the risk remains low, it is starting to increase. Covid activity in Scotland is now rising again indicating that this wave is not yet over. Meanwhile activity in Wales remains low.
In England, all key indicators increased this week indicating a low but increasing risk of Covid. Test positivity rates are climbing fastest in the West Midlands, London, and Yorkshire & Humberside, highlighting notable regional differences.
After a fall last week, all key indicators of Covid activity in Scotland increased slightly this week, suggesting the wave isn't over yet but will likely be smaller than earlier ones. The signs continued that this year's Flu season is starting earlier than in previous years.
This week, there were again only four Covid hospital admissions in Wales. Flu admissions have continued to rise and, while still low, are higher than they were at this time last year. RSV hospitalisations remained stable and very low.
There was no update available for Northern Ireland at the time of writing. The latest report showed Covid activity in Northern Ireland increased slightly across all surveillance indicators, but remained low.
Covid levels in wastewater increased slowly this week across all European countries still reporting data, but overall they are still relatively low. Comparing wastewater trends with other key indicators shows that they are a reliable indicator of Covid activity in both the community and hospital settings.
For the week ending Sep 12, overall Covid activity in the U.S.A. has plateaued with most states still seeing low activity levels. Many states that once had higher activity are now seeing falling levels, especially in the West and South. In particular, although Texas still has relatively high activity, it is on a downward trend.
With the UK Flu season likely starting a bit earlier this year, now's the time to get vaccinated. Free Flu vaccinations for those eligible will be available from Oct 1, 2026. Further details can be found at the following links - England, Scotland (invitation letter required), Wales, and Northern Ireland.
The UK's Autumn 2026 Covid Booster campaign also starts on Oct 1 and details of who is is eligible and how to arrange a vaccination can be found at the following links - England, Scotland, Wales, and Northern Ireland (not presently available).
As always, it's important to remember that the risk of hospitalisation from Covid increases significantly with age and for the clinically vulnerable. Therefore, it is important to take appropriate measures such as self-isolating when experiencing Covid symptoms and enhancing ventilation or wearing masks whenever possible.
Status of main respiratory diseases in England.
UKHSA have moved to publishing the Flu and COVID-19 surveillance reports fortnightly over the summer so data is only available from the Covid Dashboard this week.
This section starts with the latest data on test positivity rates for Covid in England. It's important to note that positivity is different from prevalence, which reflects the overall percentage of Covid cases in the general population. Appendix 1 offers a more detailed explanation of the distinction.
The following chart shows the test positivity rate for all Covid tests taken mapped against the UKHSA activity thresholds. The thresholds are based on the historical trend for Covid test positivity and, consequently, represent a relative risk. More details on this approach can be found in the Guide to Covid Surveillance Metrics.
The chart shows that the test positivity rate continues to increase and is at low levels of activity, indicating a low but increasing level of risk. The rate is highest at 9.6% for those aged 85 and above and at 9.5% for people between 15 and 24 years old, then dips to just 3.4% for individuals aged 5 to 14 years.
The next chart shows that positivity rates for all tests carried out differ between regions. Most regions saw increased test positivity rates and are now at a low level of activity. In particular, rates are rising fast in the West Midland which has the highest rate and is approaching medium activity levels. London rates are also rising quickly and are their highest level for two years. Yorkshire & Humberside rates are also rising fast. Meanwhile rates are lowest in the South West and East of England which stayed within baseline levels.
The following chart highlights two key indicators of Covid in hospitals: weekly test positivity rates among patients with respiratory issues and hospital admission rates.
Both of these hospital indicators for Covid activity increased with the positivity rate now at low activity levels, indicating a low but rising risk.
The final chart in this section compares the positivity rate for hospital patients for the main respiratory viruses, with Covid and Flu positivity rates remain at low activity levels even with slight increases. The Rhinovirus rate is also rising and has now moved to low activity level. Meanwhile, RSV remains at out of season levels.
Scotland weekly hospital admissions and test positivity
Public Health Scotland is now publishing weekly data on Covid activity, but the Viral Respiratory Diseases in Scotland surveillance report will only be issued monthly until October 2026.
The latest edition of the report published this Sep 17, confirms that during the reporting period Aug 10 to Sep 6 , 2026 all respiratory disease indicators for Covid, Flu and RSV remained at baseline activity. However, Covid test positivity increased to an average of 3.7% across this period in community surveillance, up from 1.3%. In laboratory surveillance, activity remained at baseline despite case numbers doubling from 65 to 128. This shows a similar trend to the same time last year, but at lower levels overall. The XFG variant accounted for the majority (61%) of detections in the most recent sequencing data available.
The following panel chart presents this weeks data for Covid levels in wastewater in blue, weekly Covid test positivity shown in red, Covid hospital admissions depicted in orange, and beds occupied by Covid patients in brown.
After a drop last week, all key indicators of Covid activity increased slightly this week, suggesting the wave isn't over yet but will likely be smaller than earlier ones.
The final chart in this section compares the test positivity rates for hospital patients with respiratory symptoms for Covid, Flu, and RSV. Covid positivity rates rose to 5.6% from 3,9% in the previous week, while RSV rates remained stable and below baseline levels. Flu rates continue to increase slowly and earlier than in previous years, suggesting the Flu season may be starting early.
Wales Covid hospital admissions.
The following chart provides the latest trend for weekly hospital admissions for the main respiratory viruses in Wales up to week ending Sep 20, 2026.
This week, there were only four Covid hospital admissions in Wales. Flu admissions stayed a bit higher and are above those seen at the same time last year, while there were just three hospitalisations for RSV reported.
Publication of the weekly Acute Respiratory Infection Report has resumed. This week, the reports showed that Flu circulation is at out-of-season levels, while Respiratory Syncytial Virus (RSV) and Covid are holding steady at baseline intensity.
Status of main respiratory diseases in Northern Ireland.
Public Health Northern Ireland's respiratory surveillance report covering Covid activity is published every two weeks over the summer period. The updated report was not available at the time of publishing. The latest available report covers data through to the week ending Sep 6, 2026 and the chart below highlights the test positivity rates for Covid, Flu, and RSV.
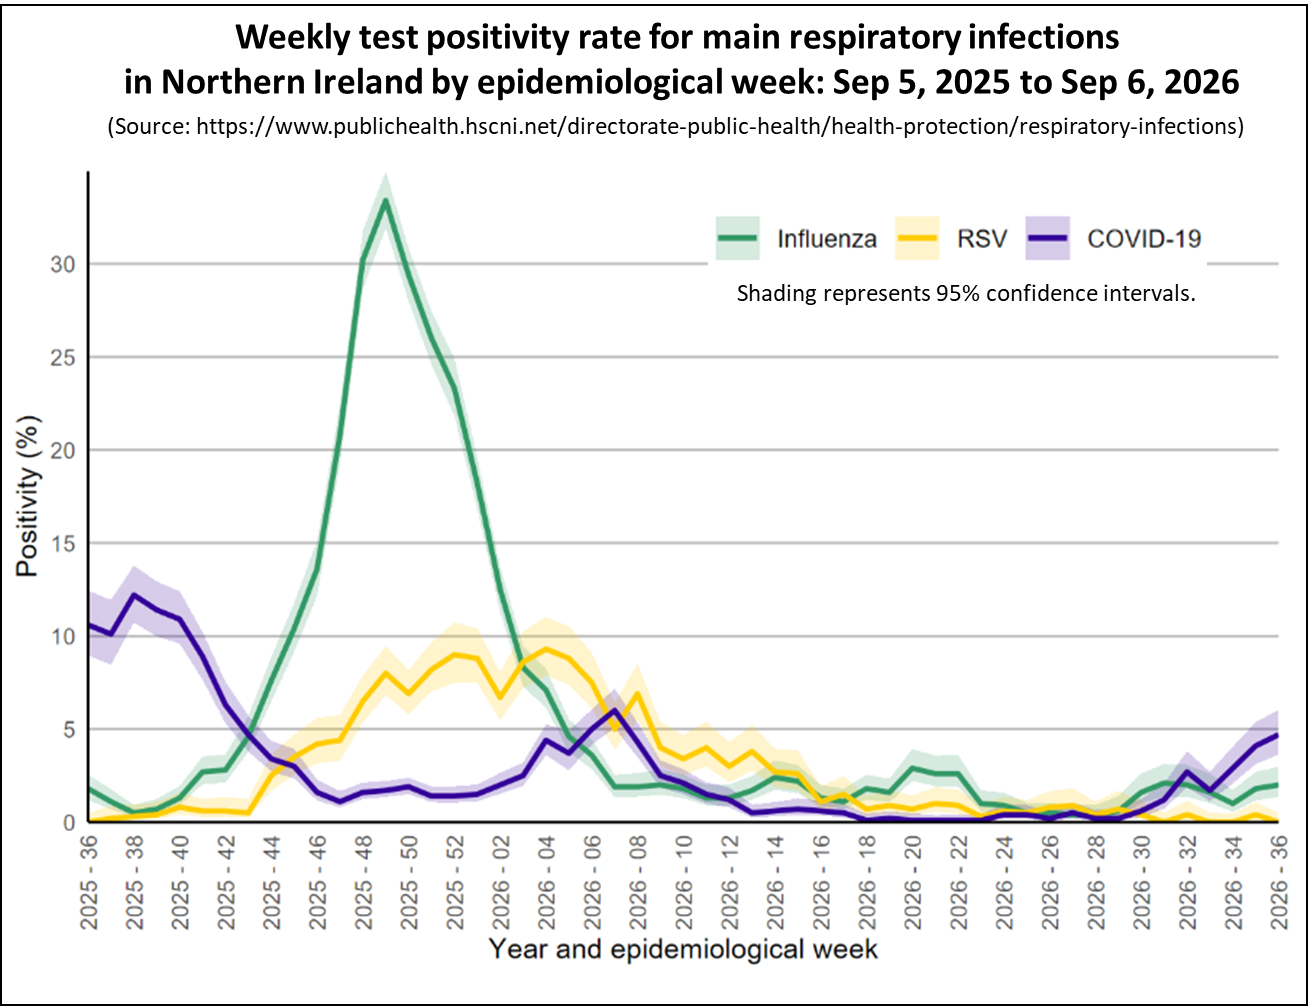
Covid test positivity and other surveillance indicators increased slightly but remained at low levels. Flu and RSV activity levels remained low and stable across all indicators.
Covid Activity in Europe.
This section looks at the latest Covid trends in Europe and examines how wastewater patterns align with prevalence and hospital data in selected countries.
The following chart shows the latest levels of Covid up to week ending Sep 17, 2026 as measured by monitoring wastewater in a number of European countries that still publish this information.
This week, Covid levels in wastewater continued to rise across most European countries still sharing this data but remained relatively low.
Wastewater levels are not the only measures of Covid activity published by these countries and it is valuable to see how well the wastewater trends compare to the other key indicators.
The Netherlands offers an interesting case, as it's the only country in Europe still publishing prevalence data. Estimates of the percentage of the population with Covid are based on a weekly survey of volunteers. Since this isn't a random survey, statistical adjustments are made to reflect the demographics of the Netherlands.
The following chart displays the Covid wastewater trend in orange, the estimated prevalence in red, and the percentage of detections from laboratory surveillance in green, all for the Netherlands.
The chart clearly shows how closely the trend for Covid wastewater follows the trend for prevalence and the percent of Covid detected in laboratory surveillance.
Comparing wastewater levels in Germany and France alongside hospital trends reveals a similar pattern. The two charts on the left show Germany's wastewater trends compared to their Covid hospital admissions, while the charts on the right display France's wastewater levels against the percentage of Emergency Department visits due to Covid.
In summary, Covid wastewater trends are a reliable indicator of Covid activity in both the community and hospital settings.
Covid Activity in North America.
This section provides details of Covid activity in USA and Canada.
Charts for the USA will be updated on Friday, Sep 25 to reflect the latest information.
As of the week ending Sep 12, 2026, Covid activity in the USA has plateaued, indicating that the risk remains low in most states, and those states in the South and West which previously had higher levels of activity are starting to see falling levels.
The following chart shows the weekly trend for the national key Covid indicators covering wastewater activity levels, percent of emergency department visits due to Covid, test positivity, and the hospital admission rate in the USA.
The panel chart shows that the key indicators of Covid activity have remained broadly unchanged for the week ending Sep 12, 2026, and for most measures are at low levels although test positivity remained moderately high.
Wastewater analysis for week ending Sep 12, 2026 showed that Covid levels are low in many states as illustrated in the following map. Activity is at a moderate level in states in the West regions. Texas activity levels increased to very high this week, but but other measures show that levels are falling.
Each state is coloured based on activity levels, ranging from very high (dark red) to very low (light green), with grey indicating no data available. States with increasing activity levels are marked with cross-hatching.
The final chart for the USA presents the Covid trends by state as estimated by the CDC. Most states are showing a declining trend or no change. This week there are just 20 states showing a growing trend compared to 30 in the previous week.
A reminder that the trend represents the direction of activity only and does not indicate the level of activity. Consequently. this map should be used in conjunction with other data like the percent of Emergency Department visits due to Covid. This information is available by hovering your cursor over any state.
In Canada, data for the week ending Sep 5, 2026, shows that Covid wastewater levels stayed at moderate levels, although levels in the western provinces remained higher.
In conclusion
Although the amount of data currently being published is reduced, the information available for all home nations show that Covid activity is low but rising slowly in England and Scotland. Flu activity has fallen from its recent peak and is now at baseline out-of-season levels.
Covid levels in wastewater is also low but rising across European countries. In the USA, Covid activity has increased but is still at low levels, except in a few states. Flu A activity in both the USA and Canada have dropped to low levels.
As always, if you have any comments on this Covid Situation Report or suggestions for topics to cover, please post a message below.
Thanks for reading Seeing The Forest for the Trees! Subscribe for free to receive new posts and support my work.
Appendix 1. Test positivity rates and prevalence
Positivity rates are derived from the results of hospital laboratory tests conducted on patients exhibiting symptoms of respiratory diseases. Test positivity is the percentage of patients who test positive for Covid of the total number of patients tested. Since the individuals tested for this measure are not a representative sample of the general population it differs from prevalence, which is derived from a representative sample of the population.
This report belongs to a weekly series summarising the Covid situation across the UK's home nations and other countries.
Thanks for reading Seeing The Forest for the Trees! Subscribe for free to receive new posts and support my work.
This week's report highlights the latest trends in respiratory illness activity across England, with updated figures for Scotland, and Wales. It also shares recent Covid levels in selected countries in Europe, North America, and Asia.
Charts for the USA were updated on Friday, Sep 18 to reflect the latest published data.
Summary.
This week, Covid activity across the UK shows a mixed picture. Covid indicators in England have once more risen slightly albeit from low levels, suggesting that while the risk remains low, it is on the rise. In contrast Covid activity in Scotland is now falling slowly and likely to have peaked. Meanwhile activity in Wales remains low.
In England, test positivity for all Covid tests undertaken increased slightly but stayed just below baseline levels. However, there are regional differences with West Midlands, London, and Yorkshire & Humberside rising to above baseline levels.
All key Covid indicators in Scotland fell this week, suggesting that this is likely to be a smaller wave than seen previously. However, there are signs that this years Flu season is starting earlier than in previous years.
This week, there were only four Covid hospital admissions in Wales. Flu admissions have risen slightly and, while still low, are higher than they were at this time last year. RSV hospitalisations remained stable and very low.
There was no update for Northern Ireland this week. The latest report showed Covid activity in Northern Ireland increased slightly across all surveillance indicators, but remained low.
Covid levels in wastewater increased slowly this week across all European countries still reporting data, but overall they are still very low.
For the week ending Sep 12, overall Covid activity in the U.S.A. has plateaued with most states still seeing low activity levels. Many states that once had higher activity are now seeing falling levels, especially in the West and South. In particular, although Texas still has relatively high activity, it is on a downward trend.
This week, hospital Covid measures in Hong Kong continued to fall, confirming that the recent wave is over. In contrast, New Zealand's Covid activity stayed low, though they are experiencing their worst Flu season in several years.
With the UK Flu season likely starting a bit earlier this year, now's the time to get vaccinated. Free Flu vaccinations for those eligible will be available from Oct 1, 2026. Further details can be found at the following links - England, Scotland (invitation letter required), Wales, and Northern Ireland.
The UK's Autumn 2026 Covid Booster campaign also starts on Oct 1 and details of who is is eligible and how to arrange a vaccination can be found at the following links - England, Scotland, Wales, and Northern Ireland (not presently available).
As always, it's important to remember that the risk of hospitalisation from Covid increases significantly with age and for the clinically vulnerable. Therefore, it is important to take appropriate measures such as self-isolating when experiencing Covid symptoms and enhancing ventilation or wearing masks whenever possible.
Status of main respiratory diseases in England.
UKHSA have moved to publishing the Flu and COVID-19 surveillance reports fortnightly over the summer so data is only available from the Covid Dashboard this week.
This section starts with the latest data on test positivity rates for Covid in England. It's important to note that positivity is different from prevalence, which reflects the overall percentage of Covid cases in the general population. Appendix 1 offers a more detailed explanation of the distinction.
The following chart shows the test positivity rate published on the Covid dashboard for all Covid tests taken mapped against the UKHSA activity thresholds. The thresholds are based on the historical trend for Covid test positivity and, consequently, represent a relative risk. More details on this approach can be found in the Guide to Covid Surveillance Metrics.
The chart shows that the test positivity rate continues to increase and is just below the low level of activity threshold, indicating a low but increasing level of risk.
The next chart shows that positivity rates for all tests carried out differ between regions. In particular, rates are now rising fastest in the West Midland which, along with London and Yorkshire & Humberside, is within the low level of activity levels. Meanwhile rates stayed well within baseline levels in the East of England.
Scotland weekly hospital admissions and test positivity
Public Health Scotland is now publishing weekly data on Covid activity, but the Viral Respiratory Diseases in Scotland surveillance report will only be issued monthly until October 2026.
The latest edition of the report published this week, confirms that during the reporting period Aug 10 to Sep 6 , 2026 all respiratory disease indicators for Covid, Flu and RSV remained at baseline activity. However, Covid test positivity increased to an average of 3.7% across this period in community surveillance, up from 1.3%. In laboratory surveillance, activity remained at baseline despite case numbers doubling from 65 to 128. This shows a similar trend to the same time last year, but at lower levels overall. The XFG variant accounted for the majority (61%) of detections in the most recent sequencing data available.
The following panel chart presents this weeks data for Covid levels in wastewater in blue, weekly Covid test positivity shown in red, Covid hospital admissions depicted in orange, and beds occupied by Covid patients in brown.
All key indicators of Covid activity fell slightly this week, indicating that this will be a smaller wave than seen previously. For example, the test positivity rate fell to 3.9% this week from 4.1% the previous week, even though it had nearly doubled in the weeks before.
The final chart in this section compares the test positivity rates for hospital patients with respiratory symptoms for Covid, Flu, and RSV. Covid positivity rates continued to fall and RSV rates remained stable and below baseline levels. However, Flu rates are increasing slowly but earlier than in previous years, suggesting the Flu season may be starting sooner this year.
Wales Covid hospital admissions.
The following chart provides the latest trend for weekly hospital admissions for the main respiratory viruses in Wales up to week ending Sep 13, 2026.
This week, there were only four Covid hospital admissions in Wales. Flu admissions stayed a bit higher and are above those seen at the same time last year, while there were no hospitalisations for RSV reported.
Flu and RSV are currently well below baseline and have dropped to out-of-season levels. As a result, publication of the weekly Acute Respiratory Infection Report for Wales is on hold and will not resume until the 2026-27 season.
Status of main respiratory diseases in Northern Ireland.
Public Health Northern Ireland publish a respiratory surveillance report covering Covid activity which is published every two weeks over the summer period. There was no update published this week. The latest report covers data through to the week ending Sep 6, 2026 and the chart below highlights the test positivity rates for Covid, Flu, and RSV.
Covid test positivity and other surveillance indicators increased slightly but remained at low levels. Flu and RSV activity levels remained low and stable across all indicators.
Covid Activity in Other Countries.
This section reviews the latest Covid trends in Europe and North America together with Hong Kong, Singapore and New Zealand. In all countries across these regions, activity remains at very low levels apart from Hong Kong and Singapore which are experiencing higher levels of Covid activity.
The following chart shows the latest levels of Covid up to week ending Sep 3, 2026 as measured by monitoring wastewater in a number of European countries that still publish this information.
This week, Covid levels in wastewater continued to rise across most European countries still sharing this data but still remained low.
Charts for the USA were be updated on Friday, Sep 18 to reflect the latest information.
As of the week ending Sep 12, 2026, Covid activity in the USA has plateaued, indicating that the risk remains low in most states, and those states in the South and West which previously had higher levels of activity are starting to see falling levels.
The following chart shows the weekly trend for the national key Covid indicators covering wastewater activity levels, percent of emergency department visits due to Covid, test positivity, and the hospital admission rate in the USA.
The panel chart shows that the key indicators of Covid activity have remained broadly unchanged for the week ending Sep 12, 2026, and for most measures are at low levels although test positivity remained moderately high.
Wastewater analysis for week ending Sep 12, 2026 showed that Covid levels are low in many states as illustrated in the following map. Activity is at a moderate level in states in the West regions. Texas activity levels increased to very high this week, but but other measures show that levels are falling.
Each state is coloured based on activity levels, ranging from very high (dark red) to very low (light green), with grey indicating no data available. States with increasing activity levels are marked with cross-hatching.
The final chart for the USA presents the Covid trends by state as estimated by the CDC. Most states are showing a declining trend or no change. This week there are just 20 states showing a growing trend compared to 30 in the previous week.
A reminder that the trend represents the direction of activity only and does not indicate the level of activity. Consequently. this map should be used in conjunction with other data like the percent of Emergency Department visits due to Covid. This information is available by hovering your cursor over any state.
In Canada, data for the week ending Sep 5, 2026, shows that Covid wastewater levels stayed at moderate levels, although levels in the western provinces were high. The latest weekly Canadian respiratory virus surveillance report noted a slight rise in Covid test positivity to 2.3% from 1.7% in the previous week, while Flu A, Flu B and RSV activity was at baseline levels.
The following chart displays the key Covid indicators for Hong Kong up to the week ending Sep 12, 2026. All key indicators of Covid activity stayed low this week, indicating that the recent wave has come to an end.
In contrast, the latest data up to week ending Sep 6, 2026 showed that New Zealand did not see a wave with Covid levels in wastewater remaining relatively low, while Covid cases stayed at very low numbers.
However, New Zealand has seen it's worst Flu season for several years. According to New Zealand's Respiratory Illness dashboard, Flu hospital admissions hit a peak of 9.5 per 100,000 people for the week ending Aug 30, 2026. Although it has now fallen to 5.3 per 100,000 for week ending Sep 13, 2026, this is still higher than any peak for the past 5 years.
In conclusion
Although the amount of data currently being published is reduced, the information available for all home nations show that Covid activity is very low. Flu activity has fallen from its recent peak and is now at baseline out-of-season levels.
Covid levels in wastewater is also very low across European countries. In the USA, Covid activity has stayed at very low levels, except in a few states. Flu A activity in both the USA and Canada have dropped to low levels.
As always, if you have any comments on this Covid Situation Report or suggestions for topics to cover, please post a message below.
Thanks for reading Seeing The Forest for the Trees! Subscribe for free to receive new posts and support my work.
Appendix 1. Test positivity rates and prevalence
Positivity rates are derived from the results of hospital laboratory tests conducted on patients exhibiting symptoms of respiratory diseases. Test positivity is the percentage of patients who test positive for Covid of the total number of patients tested. Since the individuals tested for this measure are not a representative sample of the general population it differs from prevalence, which is derived from a representative sample of the population.
This report belongs to a weekly series summarising the Covid situation across the UK's home nations and other countries.
Thanks for reading Seeing The Forest for the Trees! Subscribe for free to receive new posts and support my work.
This week's report highlights the latest trends in respiratory illness activity across England, with updated figures for Scotland, Wales, and Northern Ireland. It also shares recent Covid levels in selected countries in Europe, North America, and Asia.
Charts for the USA were updated on Friday, Sep 11 to reflect the latest published data.
Summary.
This week, Covid activity across the UK shows a mixed picture. Covid indicators in England have once more risen slightly albeit from low levels, suggesting that while the risk remains low, it is on the rise. In contrast Covid activity in Scotland has stopped increasing and may have peaked. Meanwhile activity in Wales and Northern Ireland remains low.
In England, test positivity for all Covid tests undertaken increased slightly but stayed below baseline levels. However, there are regional differences with London increasing to the highest of all regions and is again above baseline levels.
This week, all key Covid indicators in Scotland stopped rising this week and may have plateaued, suggesting that this is likely to be a smaller wave than seen previously
This week, there were only four Covid hospital admissions in Wales. Flu admissions stayed a bit higher, while RSV hospitalisations remained stable and very low.
This weeks report showed Covid activity in Northern Ireland increased slightly across all surveillance indicators, but remained low.
Covid levels in wastewater increased slowly this week across all European countries still reporting data, but overall they are still very low.
For the week ending Sep 5, overall Covid activity in the U.S.A. stopped increasing. with most states still have low activity levels. However, many states continue to see increased activity especially in the West and South. In particular, Nevada and Mississippi are experiencing very high activity.
This week, hospital Covid measures in Hong Kong continued to fall, confirming that the recent wave is over. In contrast, New Zealand's Covid activity stayed low, though they are experiencing their worst Flu season in several years.
As always, it's important to remember that the risk of hospitalisation from Covid increases significantly with age and for the clinically vulnerable. Therefore, it is important to take appropriate measures such as self-isolating when experiencing Covid symptoms and enhancing ventilation or wearing masks whenever possible.
Status of main respiratory diseases in England.
UKHSA have moved to publishing the Flu and COVID-19 surveillance reports fortnightly over the summer so there is limited data available this week.
This section starts with the latest data on test positivity rates for Covid in England. It's important to note that positivity is different from prevalence, which reflects the overall percentage of Covid cases in the general population. Appendix 1 offers a more detailed explanation of the distinction.
The following chart shows the test positivity rate for all Covid tests taken mapped against the UKHSA activity thresholds. The thresholds are based on the historical trend for Covid test positivity and, consequently, represent a relative risk. More details on this approach can be found in the Guide to Covid Surveillance Metrics.
The chart shows that the test positivity rate continues to increase slowly but remains below the baseline level, indicating a low but increasing level of risk. The rate is highest at 6.5% for individuals aged 85 and older, and drops to a low of 2.0% for those between 5 and 14 years old.
The next chart shows that positivity rates for all tests carried out differ between regions. In particular, rates are rising fastest in London, are again rising in the West Midlands, while rates stayed low in the South West.
The following chart highlights two key indicators of Covid in hospitals: weekly test positivity rates among patients with respiratory issues and hospital admission rates.
Both of these hospital indicators for Covid activity increased slightly but remained at low levels, indicating a low but rising risk.
The final chart in this section compares the positivity rate for hospital patients for the main respiratory viruses, with Covid, Flu and RSV positivity rates remaining low, even with slight increases for Covid and Flu. While the Rhinovirus rate is higher than that of other respiratory viruses, it still remains within baseline levels.
Scotland weekly hospital admissions and test positivity
Public Health Scotland is now publishing weekly data on Covid activity, but the Viral Respiratory Diseases in Scotland surveillance report will only be issued monthly until October 2026.
The latest edition of the report published this week, confirms that during the reporting period Aug 10 to Sep 6 , 2026 all respiratory disease indicators for Covid, Flu and RSV remained at baseline activity. However, Covid test positivity increased to an average of 3.7% across this period in community surveillance, up from 1.3%. In laboratory surveillance, activity remained at baseline despite case numbers doubling from 65 to 128. This shows a similar trend to the same time last year, but at lower levels overall. The XFG variant accounted for the majority (61%) of detections in the most recent sequencing data available.
The following panel chart presents this weeks data for Covid levels in wastewater in blue, weekly Covid test positivity shown in red, Covid hospital admissions depicted in orange, and beds occupied by Covid patients in brown.
All key indicators of Covid activity stopped rising this week and may have plateaued, suggesting that this is likely to be a smaller wave than seen previously. For example, the test positivity rate fell to 4.5% this week from 5.1% the previous week, even though it had nearly doubled in the weeks before.
The final chart in this section compares the test positivity rates for hospital patients with respiratory symptoms for Covid, Flu, and RSV. Covid positivity rates have started to fall while Flu and RSV rates remained stable and below baseline levels.
Wales Covid hospital admissions.
The following chart provides the latest trend for weekly hospital admissions for the main respiratory viruses in Wales up to week ending Sep 6, 2026.
Starting this week, Public Health Wales has updated its reporting method, and hospital admissions now include patients who tested positive at the point of care using non-PCR tests. As a result, some weeks are showing slightly higher numbers than in previous situation reports.
This week, there were only four Covid hospital admissions in Wales. Flu admissions stayed a bit higher, while RSV hospitalisations remained stable and very low.
Flu and RSV are currently well below baseline and have dropped to out-of-season levels. As a result, publication of the weekly Acute Respiratory Infection Report for Wales is on hold and will not resume until the 2026-27 season.
Status of main respiratory diseases in Northern Ireland.
Public Health Northern Ireland publish a respiratory surveillance report covering Covid activity which is published every two weeks over the summer period. This weeks report covers data through to the week ending Sep 6, 2026 and the chart below highlights the test positivity rates for Covid, Flu, and RSV.
Covid test positivity and other surveillance indicators increased slightly but remained at low levels. Flu and RSV activity levels remained low and stable across all indicators.
Covid Activity in Other Countries.
This section reviews the latest Covid trends in Europe and North America together with Hong Kong, Singapore and New Zealand. In all countries across these regions, activity remains at very low levels apart from Hong Kong and Singapore which are experiencing higher levels of Covid activity.
The following chart shows the latest levels of Covid up to week ending Sep 3, 2026 as measured by monitoring wastewater in a number of European countries that still publish this information.
This week, Covid levels in wastewater continued to rise but remained low across all European countries still sharing this data.
Charts for the USA were updated on Friday, Sep 11 to reflect the latest information.
As of the week ending Sep 5, 2026, Covid activity in the USA has risen, suggesting that while the risk remains low in many states, it is on the rise especially in the West region which has the highest level as measured by wastewater.
The following chart shows the weekly trend for the national key Covid indicators covering wastewater activity levels, percent of emergency department visits due to Covid, test positivity, and the hospital admission rate in the USA.
The panel chart shows that the key indicators of Covid activity stopped rising for the week ending Sep 5, 2026, and for most measures are at low levels although test positivity stayed at moderately high levels.
Wastewater analysis for week ending Sep 5, 2026 showed that Covid levels are low but increasing in many states as illustrated in the following map. Activity is at a moderate level in states in the West and South regions. Texas activity levels fell this week, but Nevada and Mississippi are now experiencing very high levels of activity.
Each state is coloured based on activity levels, ranging from very high (dark red) to very low (light green), with grey indicating no data available. States with increasing activity levels are marked with cross-hatching.
The final chart for the USA presents the Covid trends by state as estimated by the CDC. Most states are showing a growing trend but it is important to note that the trend represents the direction of activity only and does not indicate the level of activity. Consequently. this map should be used in conjunction with other data like the percent of Emergency Department visits due to Covid. This information is available by hovering your cursor over any state.
In Canada, data for the week ending Aug 29, 2026, shows that Covid wastewater levels stayed moderately low, although levels in the western provinces were high. The latest weekly Canadian respiratory virus surveillance report noted a slight rise in Covid test positivity to 2.3% from 1.7% in the previous week, while Flu A, Flu B and RSV activity was at baseline levels
The following chart displays the key Covid indicators for Hong Kong up to the week ending Sep 5, 2026. All key indicators of Covid activity stayed low this week, indicating that the recent wave has come to an end.
In contrast, up to week ending Sep 6, 2026, New Zealand did not see a wave with Covid levels in wastewater remaining relatively low, while Covid cases stayed at very low numbers.
However, New Zealand has seen it's worst Flu season for several years. According to New Zealand's Respiratory Illness dashboard, Flu hospital admissions last week hit a peak of 9.5 per 100,000 people but have since dropped to 7.2 per 100,000.
In conclusion
Although the amount of data currently being published is reduced, the information available for all home nations show that Covid activity is very low. Flu activity has fallen from its recent peak and is now at baseline out-of-season levels.
Covid levels in wastewater is also very low across European countries. In the USA, Covid activity has stayed at very low levels, except in a few states. Flu A activity in both the USA and Canada have dropped to low levels.
As always, if you have any comments on this Covid Situation Report or suggestions for topics to cover, please post a message below.
Thanks for reading Seeing The Forest for the Trees! Subscribe for free to receive new posts and support my work.
Appendix 1. Test positivity rates and prevalence
Positivity rates are derived from the results of hospital laboratory tests conducted on patients exhibiting symptoms of respiratory diseases. Test positivity is the percentage of patients who test positive for Covid of the total number of patients tested. Since the individuals tested for this measure are not a representative sample of the general population it differs from prevalence, which is derived from a representative sample of the population.
 Covid Situation Report: Sep 3, 2026 [ 03-Sep-26 4:57pm ]
This report belongs to a weekly series summarising the Covid situation across the UK's home nations and other countries.
Thanks for reading Seeing The Forest for the Trees! Subscribe for free to receive new posts and support my work.
This week's report highlights the latest trends in respiratory illness activity across England, with updated figures for Scotland, and Wales. It also shares recent Covid levels in selected countries in Europe, North America, and Asia.
Charts for the USA will be updated on Friday, Sep 4 to reflect the latest published data.
Summary.
This week, key Covid indicators in England and Scotland have once more risen slightly albeit from low levels, suggesting that while the risk remains low, it is on the rise. In contrast Covid activity in Wales fell and is low.
In England, test positivity for all Covid tests undertaken increased slightly and stayed below baseline levels. However, there are regional differences with London increasing to the highest of all regions and had now risen above baseline levels.
This week, all key Covid indicators in Scotland continued to increase, though they remained relatively low, indicating that while the risk is low, it is rising.
Covid hospital admissions in Wales dropped this week and, for the first time, there were no new cases reported. Flu admissions increased but stayed low while RSV hospitalisations remained very low.
This latest report available from last week showed Covid activity in Northern Ireland increased across all surveillance indicators, but still remained low.
Covid levels in wastewater increased slowly this week across all European countries still reporting data, but overall they're still very low.
For the week ending Aug 22, Covid activity in the USA saw another rise, showing that while the current risk remains low in many states, it's on the rise, and is high in Texas and Mississippi.
This week, hospital Covid measures in Hong Kong continued to fall, confirming that the recent wave is over. Singapore also saw falling Covid test positivity and is now low, while the latest New Zealand Covid activity remained low.
As always, it's important to remember that the risk of hospitalisation from Covid increases significantly with age and for the clinically vulnerable. Therefore, it is important to take appropriate measures such as self-isolating when experiencing Covid symptoms and enhancing ventilation or wearing masks whenever possible.
Status of main respiratory diseases in England.
UKHSA have moved to publishing the Flu and COVID-19 surveillance reports fortnightly over the summer so there is limited data available this week.
This section starts with the latest data on test positivity rates for Covid in England. It's important to note that positivity is different from prevalence, which reflects the overall percentage of Covid cases in the general population. Appendix 1 offers a more detailed explanation of the distinction.
The following chart shows the test positivity rate published on the Covid dashboard for all Covid tests taken mapped against the UKHSA activity thresholds. The thresholds are based on the historical trend for Covid test positivity and, consequently, represent a relative risk. More details on this approach can be found in the Guide to Covid Surveillance Metrics.
The chart shows that the test positivity rate continues to increase slowly but remains well below the baseline level, indicating a low but increasing level of risk.
The final chart in this section shows that positivity rates for all tests carried out differ between regions. In particular, rates are rising fastest in London, are again rising in the West Midlands, while rates stayed low in the South West and North East.
Scotland weekly hospital admissions and test positivity
Public Health Scotland is now publishing weekly data on Covid activity, but the Viral Respiratory Diseases in Scotland surveillance report will only be issued monthly until October 2026.
The latest edition of the report published on Aug 13, confirms that during the reporting period Jul 13 to Aug 9 , 2026 all respiratory disease indicators for Covid, Flu and RSV remained at baseline activity. Both Adenovirus and Parainfluenza which reached medium activity levels in the week ending Jun 22, 2026, have now returned to baseline levels. Finally, although overall rates were low in the community, GP surveillance found that rhinovirus, parainfluenza and adenovirus were the most commonly identified pathogens.
The following panel chart presents this weeks data for Covid levels in wastewater in blue, weekly Covid test positivity shown in red, Covid hospital admissions depicted in orange, and beds occupied by Covid patients in brown.
All key indicators of Covid activity again increased this week but at a slower pace, suggesting that this is likely to be a smaller wave than seen previously. For example, the test positivity rate rose to 5.1% this week from 4.5% the previous week, even though it had nearly doubled the week before.
The final chart in this section compares the test positivity rates for hospital patients with respiratory symptoms for Covid, Flu, and RSV. Flu and RSV positivity rates remained below baseline levels, but Covid rates have risen once again, albeit more slowly.
Wales Covid hospital admissions.
The following chart provides the latest trend for weekly hospital admissions for the main respiratory viruses in Wales up to week ending Aug 30, 2026.
For the first time since the start of the pandemic there were no Covid hospital admissions in Wales. However Flu admissions increased while RSV hospitalisations remained stable and very low.
Flu and RSV are currently well below baseline and have dropped to out-of-season levels. As a result, publication of the weekly Acute Respiratory Infection Report for Wales is on hold and will not resume until the 2026-27 season.
Status of main respiratory diseases in Northern Ireland.
Public Health Northern Ireland publish a respiratory surveillance report covering Covid activity which is published every two weeks over the summer period. There was no update provided this week. The latest available report covers data through to the week ending Aug 23, 2026 and the chart below highlights the test positivity rates for Covid, Flu, and RSV.
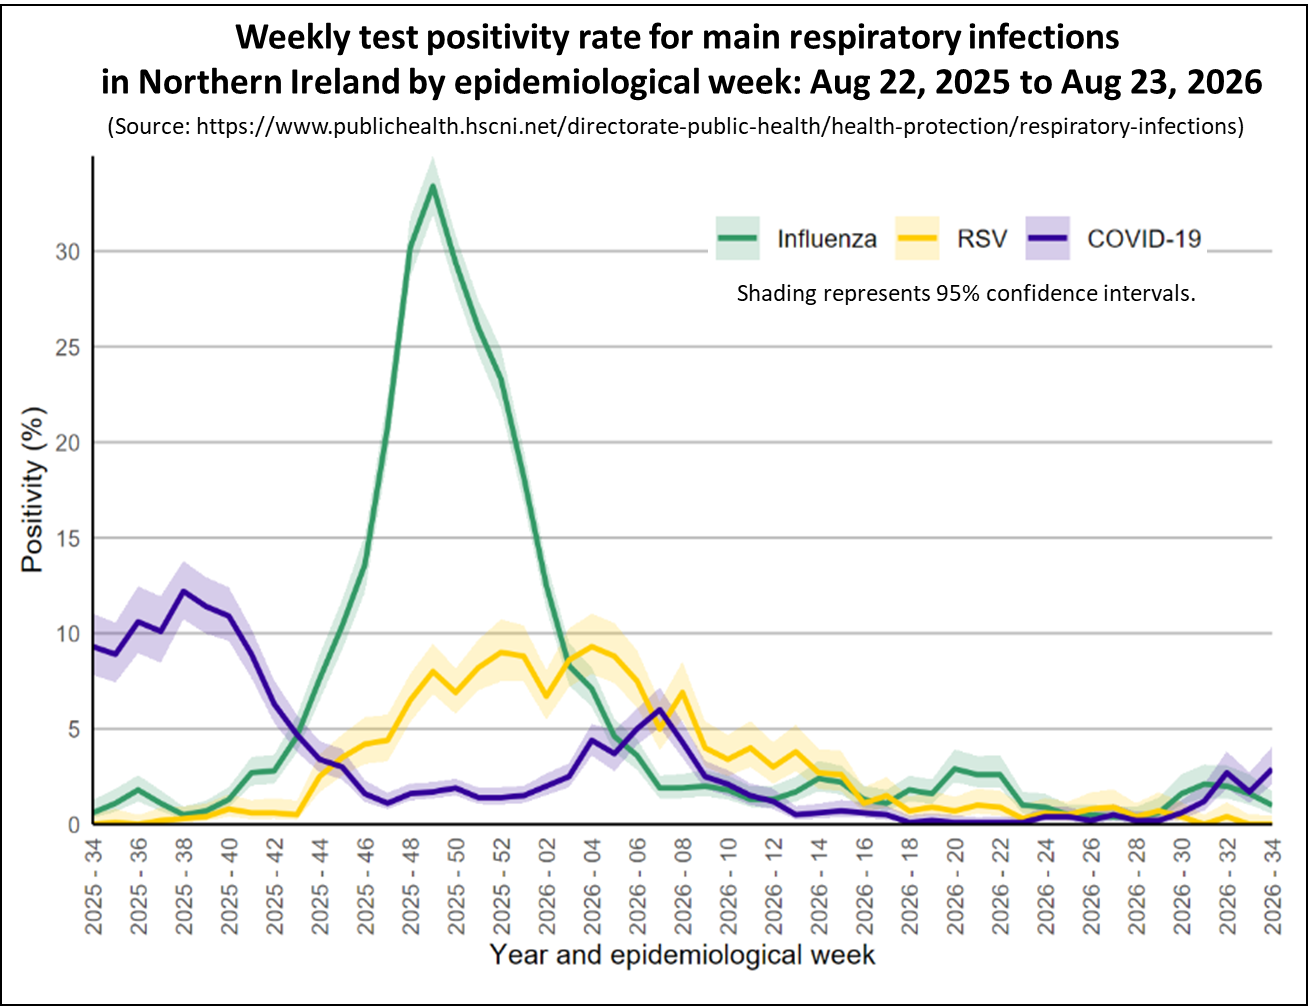
Covid test positivity and other surveillance indicators increased slightly but remained at low levels. Flu and RSV activity levels remained low and stable across all indicators.
Covid Activity in Other Countries.
This section reviews the latest Covid trends in Europe and North America together with Hong Kong, Singapore and New Zealand. In all countries across these regions, activity remains at very low levels apart from Hong Kong and Singapore which are experiencing higher levels of Covid activity.
The following chart shows the latest levels of Covid up to week ending Aug 27, 2026 as measured by monitoring wastewater in a number of European countries that still publish this information.
This week, Covid levels in wastewater are starting to rise but remained low across all European countries still sharing this data.
Charts for the USA was updated on Friday, Sep 4 to reflect the latest information.
As of the week ending Aug 22, 2026, Covid activity in the USA has risen, suggesting that while the risk remains low in many states, it is on the rise. and is high in Texas and Mississippi.
The following chart shows the weekly trend for the national key Covid indicators covering wastewater activity levels, percent of emergency department visits due to Covid, test positivity, and the hospital admission rate in the USA.
The panel chart shows that Covid activity again increased slightly for the week ending Aug 22, 2026 as measured by wastewater. However, key hospital indicators for Covid have risen more quickly, with test positivity now reaching moderate levels.
Wastewater analysis for week ending Aug 22, 2026 showed that Covid levels are low or very low in most states as illustrated in the following map. Activity is rising fastest in states in the West and South regions
Each state is coloured based on activity levels, ranging from very high (dark red) to very low (light green), with grey indicating no data available. States with increasing activity levels are marked with cross-hatching.
In Canada, data for the week ending Aug 15, 2026, shows that Covid wastewater levels stayed very low, although there was a slight rise this week. Flu A and RSV activity stayed very low, while Flu B levels have fallen from their recent peak and remain at low levels.
The following chart displays the key Covid indicators for Hong Kong up to the week ending Aug 29, 2026. All key indicators of Covid activity fell this week, indicating that the recent wave has come to an end.
The next chart presents the weekly Covid positivity rate for tests carried out on patients with respiratory symptoms in Singapore up to week ending Aug 29, 2026. It shows that Covid activity peaked in May, consistent with the previous two years, and although has now fallen to low levels.
In contrast, up to week ending Aug 23, 2026, New Zealand Covid levels in wastewater are falling slowly and are relatively low, while Covid cases stayed at very low numbers.
In conclusion
Although the amount of data currently being published is reduced, the information available for all home nations show that Covid activity is very low. Flu activity has fallen from its recent peak and is now at baseline out-of-season levels.
Covid levels in wastewater is also very low across European countries. In the USA, Covid activity has stayed at very low levels, except in a few states. Flu A activity in both the USA and Canada have dropped to low levels.
As always, if you have any comments on this Covid Situation Report or suggestions for topics to cover, please post a message below.
Thanks for reading Seeing The Forest for the Trees! Subscribe for free to receive new posts and support my work.
Appendix 1. Test positivity rates and prevalence
Positivity rates are derived from the results of hospital laboratory tests conducted on patients exhibiting symptoms of respiratory diseases. Test positivity is the percentage of patients who test positive for Covid of the total number of patients tested. Since the individuals tested for this measure are not a representative sample of the general population it differs from prevalence, which is derived from a representative sample of the population.
This report belongs to a weekly series summarising the Covid situation across the UK's home nations and other countries.
Thanks for reading Seeing The Forest for the Trees! Subscribe for free to receive new posts and support my work.
This week's report highlights the latest trends in respiratory illness activity across England, with updated figures for Scotland, Wales, and Northern Ireland. It also shares recent Covid levels in selected countries in Europe, North America, and Asia.
Charts for the USA will be updated on Friday, Aug 28 to reflect the latest published data.
Summary.
This week, key Covid indicators in England, Scotland, Wales, and Northern Ireland have risen slightly again from low levels, suggesting that while the risk remains low, it is on the rise.
In England, test positivity for all Covid tests undertaken increased, particularly in the Yorkshire & Humber and London regions, but stayed below baseline levels.
This week, all key Covid indicators in Scotland increased, though they remained relatively low, indicating that while the risk is low, it is rising.
Covid hospital admissions in Wales fell this week, with just 5 cases reported. Flu and RSV hospitalisations have stayed very low.
This week, Covid activity in Northern Ireland increased across all surveillance indicators, but still remained low.
Covid levels in wastewater increased slightly this week in some European countries, but overall they're still very low.
For the week ending Aug 15, COVID activity in the USA saw another rise, showing that while the current risk remains low in most states, it's on the rise, especially in the West region.
This week, hospital Covid measures in Hong Kong continued to fall, confirming that the recent wave is over. Singapore also saw falling Covid test positivity and is now relatively low, while the latest New Zealand Covid activity remained low.
As always, it's important to remember that the risk of hospitalisation from Covid increases significantly with age and for the clinically vulnerable. Therefore, it is important to take appropriate measures such as self-isolating when experiencing Covid symptoms and enhancing ventilation or wearing masks whenever possible.
Status of main respiratory diseases in England.
UKHSA have moved to publishing the Flu and COVID-19 surveillance reports fortnightly over the summer so there is limited data available this week.
This section starts with the latest data on test positivity rates for Covid in England. It's important to note that positivity is different from prevalence, which reflects the overall percentage of Covid cases in the general population. Appendix 1 offers a more detailed explanation of the distinction.
The following chart shows the test positivity rate for all Covid tests taken mapped against the UKHSA activity thresholds. The thresholds are based on the historical trend for Covid test positivity and, consequently, represent a relative risk. More details on this approach can be found in the Guide to Covid Surveillance Metrics.
The chart shows that the test positivity rate continues to increase slowly but remains well below the baseline level, indicating a low but increasing level of risk. The rate is highest at 5.1% for those aged 25 to 44 years and lowest at 1.9% for those aged 45 to 54.
The following chart highlights two key indicators of Covid in hospitals: weekly test positivity rates among patients with respiratory issues and hospital admission rates.
Both of these hospital indicators for Covid activity increased slightly but remained at low levels, indicating a low but rising risk.
The next chart shows that positivity rates for all tests carried out differ between regions. In particular, rates are rising fastest in the Yorks & Humber and London, have fallen in the West Midlands, while rates stayed low in the South West and North East.
The final chart in this section shows the positivity rate for hospital patients for the main respiratory viruses, with Covid, Flu and RSV positivity rates remained low, even with slight increases for Covid and Flu. While the Rhinovirus rate is higher than that of other respiratory viruses, it still remains within baseline levels.
Scotland weekly hospital admissions and test positivity
Public Health Scotland is now publishing weekly data on Covid activity, but the Viral Respiratory Diseases in Scotland surveillance report will only be issued monthly until October 2026.
The latest edition of the report published last week, confirms that during the reporting period Jul 13 to Aug 9 , 2026 all respiratory disease indicators for Covid, Flu and RSV remained at baseline activity. Both Adenovirus and Parainfluenza which reached medium activity levels in the week ending Jun 22, 2026, have now returned to baseline levels. Finally, although overall rates were low in the community, GP surveillance found that rhinovirus, parainfluenza and adenovirus were the most commonly identified pathogens.
The following panel chart presents this weeks data for Covid levels in wastewater in blue, weekly Covid test positivity shown in red, Covid hospital admissions depicted in orange, and beds occupied by Covid patients in brown.
All key indicators of Covid activity again increased this week, confirming that the next wave is on the way. In particular, the test positivity rate and hospital admission doubled in the past week.
The final chart in this section compares the test positivity rates for hospital patients with respiratory symptoms for Covid, Flu, and RSV. Flu and RSV positivity rates remained below baseline levels, but Covid rates have risen once again.
Wales Covid hospital admissions.
The following chart provides the latest trend for weekly hospital admissions for the main respiratory viruses in Wales up to week ending Aug 23, 2026.
Covid hospital admissions dropped this week to 5, down from 24 the week before. Flu and RSV hospitalisations remained very low.
Flu and RSV are currently well below baseline and have dropped to out-of-season levels. As a result, publication of the weekly Acute Respiratory Infection Report for Wales is on hold and will not resume until the 2026-27 season.
Status of main respiratory diseases in Northern Ireland.
Public Health Northern Ireland publish a respiratory surveillance report covering Covid activity which is published every two weeks over the summer period. The latest available report covers data through to the week ending Aug 23, 2026 and the chart below highlights the test positivity rates for Covid, Flu, and RSV.
Covid test positivity and other surveillance indicators increased slightly but remained at low levels. Flu and RSV activity levels remained low and stable across all indicators.
Covid Activity in Other Countries.
This section reviews the latest Covid trends in Europe and North America together with Hong Kong, Singapore and New Zealand. In all countries across these regions, activity remains at very low levels apart from Hong Kong and Singapore which are experiencing higher levels of Covid activity.
The following chart shows the latest levels of Covid up to week ending Aug 20, 2026 as measured by monitoring wastewater in a number of European countries that still publish this information.
This week, Covid levels in wastewater are starting to rise but remained low across all European countries still sharing this data.
Charts for the USA will be updated on Friday, Aug 28 to reflect the latest information.
As of the week ending Aug 15, 2026, Covid activity in the USA has risen, suggesting that while the risk remains low in most states, it is on the rise.
The following chart shows the weekly trend for the national key Covid indicators covering wastewater activity levels, percent of emergency department visits due to Covid, test positivity, and the hospital admission rate in the USA.
The panel chart shows that Covid activity is increasing slightly for the week ending Aug 15, 2026 as measured by wastewater. However, key hospital indicators for Covid have risen more quickly, with test positivity now reaching moderate levels.
Wastewater analysis for week ending Aug 15, 2026 showed that Covid levels are low or very low in most states as illustrated in the following map. Activity is rising fastest in states in the West and South regions
Each state is coloured based on activity levels, ranging from very high (dark red) to very low (light green), with grey indicating no data available. States with increasing activity levels are marked with cross-hatching.
In Canada, data for the week ending Aug 15, 2026, shows that Covid wastewater levels stayed very low, although there was a slight rise this week. Flu A and RSV activity stayed very low, while Flu B levels have fallen from their recent peak and remain at low levels.
The following chart displays the key Covid indicators for Hong Kong up to the week ending Aug 22, 2026. Although Covid levels in wastewater samples increased, the latest hospital surveillance data shows that the overall local activity of Covid has continued to fall indicating that the recent wave is nearly over.
The next chart presents the weekly Covid positivity rate for tests carried out on patients with respiratory symptoms in Singapore up to week ending Aug 22, 2026. It shows that Covid activity peaked in May, consistent with the previous two years, and although has now fallen to low levels.
In contrast, up to week ending Aug 23, 2026, New Zealand Covid levels in wastewater are falling and are now relatively low, while Covid cases stayed at very low numbers.
In conclusion
Although the amount of data currently being published is reduced, the information available for all home nations show that Covid activity is very low. Flu activity has fallen from its recent peak and is now at baseline out-of-season levels.
Covid levels in wastewater is also very low across European countries. In the USA, Covid activity has stayed at very low levels, except in a few states. Flu A activity in both the USA and Canada have dropped to low levels.
As always, if you have any comments on this Covid Situation Report or suggestions for topics to cover, please post a message below.
Thanks for reading Seeing The Forest for the Trees! Subscribe for free to receive new posts and support my work.
Appendix 1. Test positivity rates and prevalence
Positivity rates are derived from the results of hospital laboratory tests conducted on patients exhibiting symptoms of respiratory diseases. Test positivity is the percentage of patients who test positive for Covid of the total number of patients tested. Since the individuals tested for this measure are not a representative sample of the general population it differs from prevalence, which is derived from a representative sample of the population.
This report belongs to a weekly series summarising the Covid situation across the UK's home nations and other countries.
Thanks for reading Seeing The Forest for the Trees! Subscribe for free to receive new posts and support my work.
This week's report highlights the latest trends in respiratory illness activity across England, with updated figures for Scotland and Wales. It also shares recent Covid levels in selected countries in Europe, North America, and Asia.
Charts for the USA and Canada were updated on Friday, Aug 21 to reflect the latest published data.
Summary.
This week, key Covid indicators in England, Scotland, and Wales have risen slightly from low levels, suggesting that while the risk remains low, it is on the rise.
In England, test positivity for all Covid tests undertaken increased, particularly in the West Midlands and London regions, but stayed below baseline levels.
This week, all key Covid indicators in Scotland saw a slight increase, though they remained within baseline levels, suggesting that while the risk is still low, it is beginning to rise.
Covid hospital admissions in Wales have once more risen this week, with 24 cases reported. Flu and RSV hospitalisations have stayed very low.
The latest report for Northern Ireland, released on Aug 12, showed that while Covid activity was increasing across all surveillance indicators, it still remained low.
Covid levels in wastewater increased slightly this week in some European countries, but overall they're still very low.
For the week ending August 15, COVID activity in the USA saw another rise, showing that while the current risk remains low in most states, it's on the rise, especially in the West region.
This week, hospital Covid measures in Hong Kong continued to fall, confirming that the recent wave is nearly over. Singapore also saw falling but still moderately high Covid test positivity, while the latest New Zealand Covid activity remained low.
As always, it's important to remember that the risk of hospitalisation from Covid increases significantly with age and for the clinically vulnerable. Therefore, it is important to take appropriate measures such as self-isolating when experiencing Covid symptoms and enhancing ventilation or wearing masks whenever possible.
Status of main respiratory diseases in England.
UKHSA have moved to publishing the Flu and COVID-19 surveillance reports fortnightly over the summer so there is limited data available this week.
The following chart shows the test positivity rate for all Covid tests reported on the UKHSA dashboard mapped against the UKHSA activity thresholds. The thresholds are based on the historical trend for Covid test positivity and, consequently, represent a relative risk. More details on this approach can be found in the Guide to Covid Surveillance Metrics.
The following chart shows that the test positivity rate is increasing but remains below the baseline threshold this week, indicating a low but increasing level of risk.
The following chart shows that positivity rates are differing between regions. In particular, rates are rising fastest in the West Midlands and London, while rates stayed low in the South West and North East.
Scotland weekly hospital admissions and test positivity
Public Health Scotland is now publishing weekly data on Covid activity, but the Viral Respiratory Diseases in Scotland surveillance report will only be issued monthly until October 2026.
The latest edition of the report published last week, confirms that during the reporting period Jul 13 to Aug 9 , 2026 all respiratory disease indicators for Covid, Flu and RSV remained at baseline activity. Both Adenovirus and Parainfluenza which reached medium activity levels in the week ending Jun 22, 2026, have now returned to baseline levels. Finally, although overall rates were low in the community, GP surveillance found that rhinovirus, parainfluenza and adenovirus were the most commonly identified pathogens.
The following panel chart presents this weeks data for Covid levels in wastewater in blue, weekly Covid test positivity shown in red, Covid hospital admissions depicted in orange, and beds occupied by Covid patients in brown.
All key indicators of Covid activity increased slightly this week, suggesting that the next wave is on the way. However, Covid indicators in Scotland are still at baseline levels indicating the risk from the virus remains low.
The final chart in this section compares the test positivity rates for hospital patients with respiratory symptoms for Covid, Flu, and RSV. Positivity rates stayed below baseline activity levels although there was again a small increase for Covid.
Wales Covid hospital admissions.
The following chart provides the latest trend for weekly hospital admissions for the main respiratory viruses in Wales up to week ending Aug 16, 2026.
Covid hospital admissions increased this week but remained relatively low, with 24 people admitted this week compared with 10 the previous week. Hospitalisations for Flu and RSV continued to be very low.
Flu and RSV are currently well below baseline and have dropped to out-of-season levels. As a result, publication of the weekly Acute Respiratory Infection Report for Wales is on hold and will not resume until the 2026-27 season.
Status of main respiratory diseases in Northern Ireland.
Public Health Northern Ireland publish a respiratory surveillance report covering Covid activity which is published every two weeks over the summer period. The latest available report covers data through to the week ending Aug 9, 2026 and the chart below highlights the test positivity rates for Covid, Flu, and RSV.
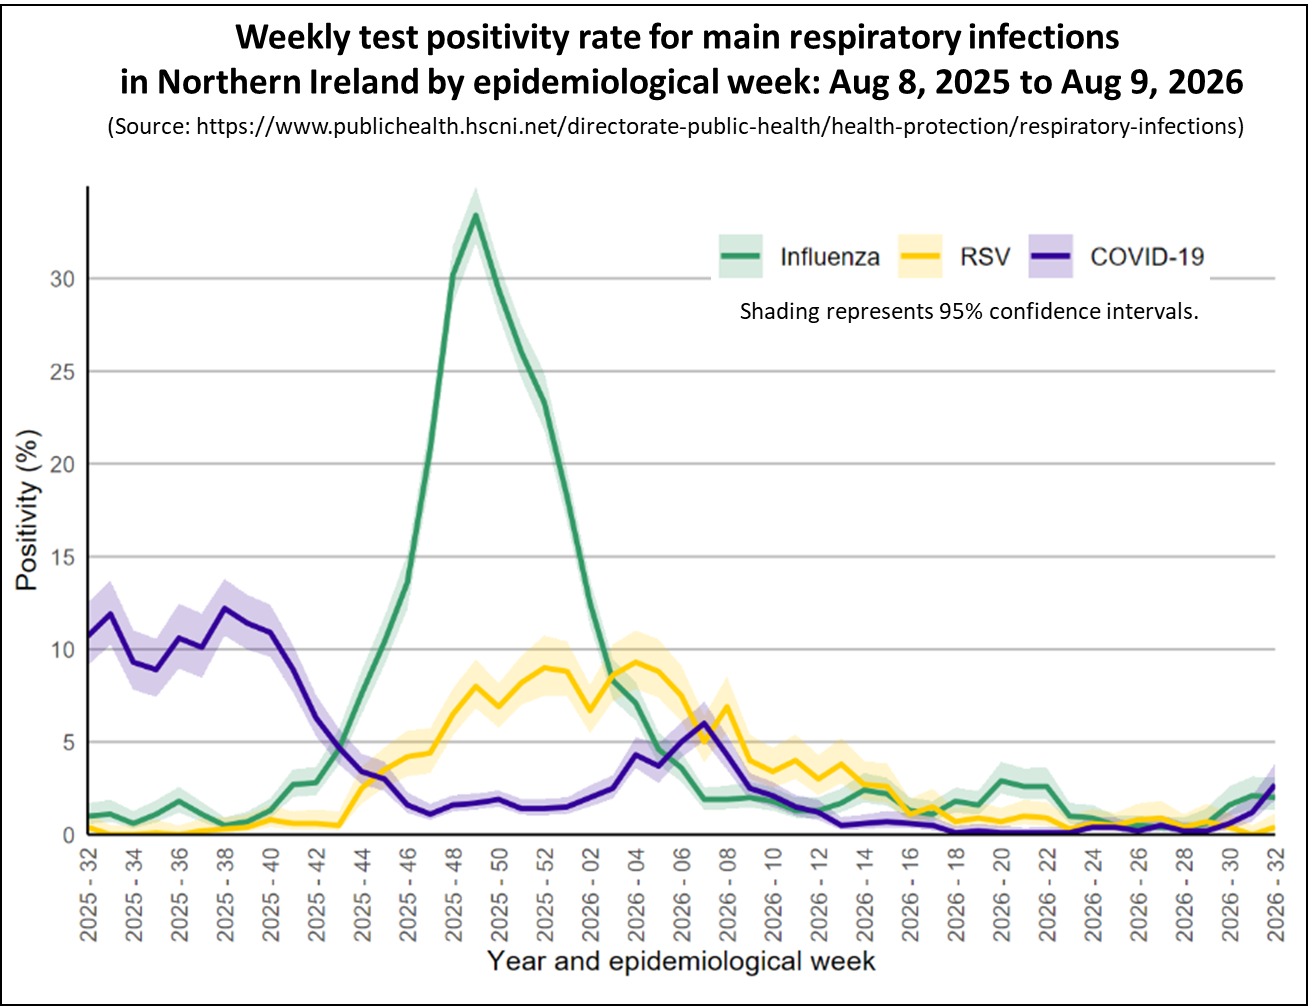
Covid test positivity and other surveillance indicators increased slightly but remained at low levels. Flu and RSV activity levels remained low and stable across all indicators.
Covid Activity in Other Countries.
This section reviews the latest Covid trends in Europe and North America together with Hong Kong, Singapore and New Zealand. In all countries across these regions, activity remains at very low levels apart from Hong Kong and Singapore which are experiencing higher levels of Covid activity.
The following chart shows the latest levels of Covid up to week ending Aug 13, 2026 as measured by monitoring wastewater in a number of European countries that still publish this information.
This week, Covid levels in wastewater remained very low across all European countries still sharing this data. Unfortunately, data for Switzerland has not been published for the past two weeks.
Charts for the USA and Canada were updated on Friday, Aug 21 to reflect the latest information.
As of the week ending Aug 15, 2026, Covid activity in the USA has risen, suggesting that while the risk remains low in most states, it is on the rise.
The following chart shows the weekly trend for the national key Covid indicators covering wastewater activity levels, percent of emergency department visits due to Covid, test positivity, and the hospital admission rate in the USA.
The panel chart shows that Covid activity is increasing slightly for the week ending Aug 15, 2026 as measured by wastewater. However, key hospital indicators for Covid have risen more quickly, with test positivity now reaching moderate levels.
Wastewater analysis for week ending Aug 15, 2026 showed that Covid levels are low or very low in most states as illustrated in the following map. Activity is rising fastest in states in the West and South regions
Each state is coloured based on activity levels, ranging from very high (dark red) to very low (light green), with grey indicating no data available. States with increasing activity levels are marked with cross-hatching.
In Canada, data for the week ending Aug 8, 2026, shows that Covid wastewater levels stayed very low, although there was a slight rise this week. Flu A and RSV activity stayed very low, while Flu B levels have fallen from their recent peak and remain at low levels.
The following chart displays the key Covid indicators for Hong Kong up to the week ending Aug 15, 2026. Although Covid levels in wastewater samples increased, the latest hospital surveillance data shows that the overall local activity of Covid has continued to fall indicating that the recent wave is nearly over.
The next chart presents the weekly Covid positivity rate for tests carried out on patients with respiratory symptoms in Singapore up to week ending Jul 25, 2026. It shows that Covid activity peaked in May, consistent with the previous two years, and although it is now falling slowly remains moderately high.
In contrast, up to week ending Aug 9, 2026, New Zealand Covid levels in wastewater are falling and are now relatively low, while Covid cases stayed at very low numbers.
In conclusion
Although the amount of data currently being published is reduced, the information available for all home nations show that Covid activity is very low. Flu activity has fallen from its recent peak and is now at baseline out-of-season levels.
Covid levels in wastewater is also very low across European countries. In the USA, Covid activity has stayed at very low levels, except in a few states. Flu A activity in both the USA and Canada have dropped to low levels.
As always, if you have any comments on this Covid Situation Report or suggestions for topics to cover, please post a message below.
Thanks for reading Seeing The Forest for the Trees! Subscribe for free to receive new posts and support my work.
Appendix 1. Test positivity rates and prevalence
Positivity rates are derived from the results of hospital laboratory tests conducted on patients exhibiting symptoms of respiratory diseases. Test positivity is the percentage of patients who test positive for Covid of the total number of patients tested. Since the individuals tested for this measure are not a representative sample of the general population it differs from prevalence, which is derived from a representative sample of the population.
This report belongs to a weekly series summarising the Covid situation across the UK's home nations and other countries.
Thanks for reading Seeing The Forest for the Trees! Subscribe for free to receive new posts and support my work.
This week's report highlights the latest trends in respiratory illness activity across England, with updated figures for Scotland and Wales. It also shares recent Covid levels in selected countries in Europe, North America, and Asia, before finishing with the latest information on eligibility for future booster campaigns in the UK.
Charts for the USA were updated on Friday, Aug 14 to reflect the latest published data.
Summary.
This week, key Covid indicators across England, Scotland, and Wales stayed very low, indicating that the risk level is still low.
In England, test positivity for all Covid tests undertaken increased but stayed below baseline levels. However, hospital surveillance measures remained stable and low.
This week, all key Covid indicators for Scotland increased slightly although they stayed very low and well within baseline levels, suggesting the risk is ;ow but may be rising.
Covid hospital admissions in Wales remained low this week, with 10 cases reported. Flu and RSV hospitalisations were very low this week.
The latest data for Northern Ireland released on Jul 29, 2026 reported that Covid activity was at very low levels across all surveillance indicators.
Covid levels in wastewater stayed stable and very low across all European countries still publishing this data.
For the week ending Aug 8, Covid activity in the USA increased slightly but remained low in most states, with signs that the rising activity in the West region has plateaued.
This week, Covid activity in Hong Kong fell, confirming that the recent wave is nearly over. Singapore also saw falling but still moderately high Covid test positivity, while New Zealand Covid activity remained low.
As always, it's important to remember that the risk of hospitalisation from Covid increases significantly with age and for the clinically vulnerable. Therefore, it is important to take appropriate measures such as self-isolating when experiencing Covid symptoms and enhancing ventilation or wearing masks whenever possible.
Status of main respiratory diseases in England.
UKHSA have moved to publishing the Flu and COVID-19 surveillance reports fortnightly over the summer so there is limited data available this week.
This section starts with the latest data on test positivity rates for Covid in England. It's important to note that positivity is different from prevalence, which reflects the overall percentage of Covid cases in the general population. Appendix 1 offers a more detailed explanation of the distinction.
The following chart shows the test positivity rate for all Covid tests taken mapped against the UKHSA activity thresholds. The thresholds are based on the historical trend for Covid test positivity and, consequently, represent a relative risk. More details on this approach can be found in the Guide to Covid Surveillance Metrics.
The chart shows that the test positivity rate remains low and well below the baseline, indicating a low level of risk. However, the positivity rate is starting to rise and at 3.5% is highest for those aged 15 to 24 years old and lowest at 0.4% for children aged between 5 to 14 years old.
The following chart highlights two key indicators of Covid in hospitals: weekly test positivity rates among patients with respiratory issues, and hospital admission rates.
Both of these hospital indicators for Covid activity remained at low levels indicating a low level of risk.
The final chart shows the positivity rate for hospital patients for the main respiratory viruses, with Covid, Flu and RSV positivity rates remaining at low levels. While the Rhinovirus rate is higher than that of other respiratory viruses, it still remains within baseline levels.
Scotland weekly hospital admissions and test positivity
Public Health Scotland is now publishing weekly data on Covid activity, but the Viral Respiratory Diseases in Scotland surveillance report will only be issued monthly until October 2026.
The latest edition of the report published this week, confirms that during the reporting period Jul 13 to Aug 9 , 2026 all respiratory disease indicators for Covid, Flu and RSV remained at baseline activity. Both Adenovirus and Parainfluenza which reached medium activity levels in the week ending Jun 22, 2026, have now returned to baseline levels. Finally, although overall rates were low in the community, GP surveillance found that rhinovirus, parainfluenza and adenovirus were the most commonly identified pathogens.
The following panel chart presents this weeks data for Covid levels in wastewater in blue, weekly Covid test positivity shown in red, Covid hospital admissions depicted in orange, and beds occupied by Covid patients in brown.
All Covid indicators in Scotland stayed at baseline levels in the past week indicating the risk from the virus remains very low. However, the slight increase in test positivity that began three weeks ago is now being reflected in a small rise in the other indicators. This is something to watch closely, as it might be an early sign of rising Covid activity.
The final chart in this section compares the test positivity rates for hospital patients with respiratory symptoms for Covid, Flu, and RSV. Positivity rates stayed well below baseline activity levels although there were again small increases for Flu and Covid.
Wales Covid hospital admissions.
The following chart provides the latest trend for weekly hospital admissions for the main respiratory viruses in Wales up to week ending Aug 9, 2026.
Covid hospital admissions were at very low levels, with 10 people admitted this week. Hospitalisations for Flu and RSV also remained very low.
Flu and RSV are currently well below baseline and have dropped to out-of-season levels. As a result, publication of the weekly Acute Respiratory Infection Report for Wales is on hold and will not resume until the 2026-27 season.
Status of main respiratory diseases in Northern Ireland.
Public Health Northern Ireland publish a respiratory surveillance report covering Covid activity which is published every two weeks over the summer period. The latest available report at the time of publishing covers data through the week ending Jul 26, 2026 and the chart below highlights the test positivity rates for Covid, Flu, and RSV.
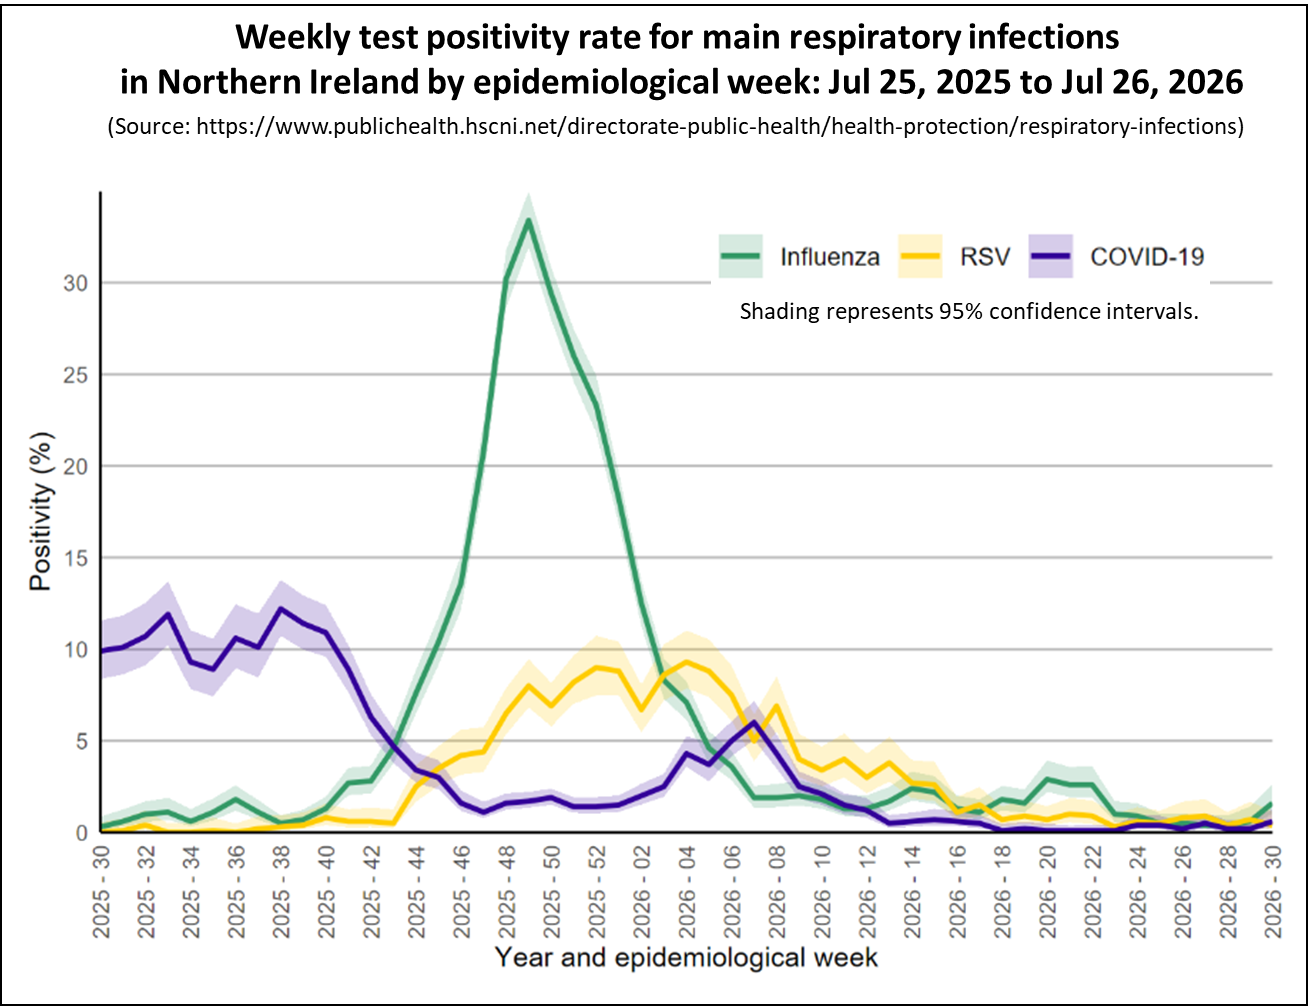
Covid test positivity remained very low and also was low across all other surveillance indicators. Flu activity increased slightly but remained at low levels across surveillance indicators. RSV activity levels remained low and stable across all indicators.
Covid Activity in Other Countries.
This section reviews the latest Covid trends in Europe and North America together with Hong Kong, Singapore and New Zealand. In all countries across these regions, activity remains at very low levels apart from Hong Kong and Singapore which are experiencing higher levels of Covid activity.
The following chart shows the latest levels of Covid up to week ending Aug 6, 2026 as measured by monitoring wastewater in a number of European countries that still publish this information.
This week, Covid levels in wastewater remained very low across all European countries still sharing this data. Unfortunately, data for Switzerland has not been published for the past two weeks.
Charts for the USA were updated on Friday, Aug 14 to reflect the latest information.
As of week ending Aug 8, 2026 Covid activity in the USA remained low and the increasing Covid activity in the West region appears to have plateaued.
The following chart shows the weekly trend for the national key Covid indicators covering wastewater activity levels, percent of emergency department visits due to Covid, test positivity, and the hospital admission rate in the USA.
The panel chart shows that Covid activity is increasing slightly for the week ending Aug 8, 2026 as measured by wastewater. Also the key hospital indicators for Covid continued to increase slowly but remain relatively low.
Wastewater analysis for week ending Aug 8, 2026 showed that Covid levels are low or very low in most states as illustrated in the following map. Activity in Alaska has now fallen to low from the high level seen last week.
Each state is coloured based on activity levels, ranging from very high (dark red) to very low (light green), with grey indicating no data available. States with increasing activity levels are marked with cross-hatching.
In Canada, data for the week ending Aug 1, 2026, shows that Covid wastewater levels stayed very low, dropping this week after a slight rise over the past few weeks. Flu A and RSV activity stayed very low, while Flu B levels have fallen from their recent peak and remain at low levels.
The following chart displays the key Covid indicators for Hong Kong up to the week ending Aug 8, 2026. The latest surveillance data shows that the overall local activity of Covid has continued to fall indicating that the recent wave is nearly over. The latest wastewater surveillance data and genetic analysis of positive respiratory specimens showed that NB.1.8.1 and its descendant lineages are the most prevalent variants in Hong Kong.
The next chart presents the weekly Covid positivity rate for tests carried out on patients with respiratory symptoms in Singapore up to week ending Jul 25, 2026. It shows that Covid activity peaked in May, consistent with the previous two years, and although it is now falling slowly remains moderately high.
In contrast, up to week ending Jul 26, 2026, New Zealand Covid levels in wastewater are falling and are now relatively low, while Covid cases stayed at historically low numbers.
In conclusion
Although the amount of data currently being published is reduced, the information available for all home nations show that Covid activity is very low. Flu activity has fallen from its recent peak and is now at baseline out-of-season levels.
Covid levels in wastewater is also very low across European countries. In the USA, Covid activity has stayed at very low levels, except in a few states. Flu A activity in both the USA and Canada have dropped to low levels.
As always, if you have any comments on this Covid Situation Report or suggestions for topics to cover, please post a message below.
Thanks for reading Seeing The Forest for the Trees! Subscribe for free to receive new posts and support my work.
Appendix 1. Test positivity rates and prevalence
Positivity rates are derived from the results of hospital laboratory tests conducted on patients exhibiting symptoms of respiratory diseases. Test positivity is the percentage of patients who test positive for Covid of the total number of patients tested. Since the individuals tested for this measure are not a representative sample of the general population it differs from prevalence, which is derived from a representative sample of the population.
This report belongs to a weekly series summarising the Covid situation across the UK's home nations and other countries.
Thanks for reading Seeing The Forest for the Trees! Subscribe for free to receive new posts and support my work.
This week's report highlights the latest trends in respiratory illness activity across England, with updated figures for Scotland and Wales. It also shares recent Covid levels in selected countries in Europe, North America, and Asia, before finishing with the latest information on eligibility for future booster campaigns in the UK.
Charts for the USA were updated on Friday, Aug 7 to reflect the latest published data.
Summary.
This week, key Covid indicators across England, Scotland, and Wales stayed very low, indicating that the risk level is still low.
In England, test positivity for Covid remained low and well within baseline levels.
This week, all key Covid indicators for Scotland remained very low and well within baseline levels, suggesting the risk is minimal.
Covid hospital admissions in Wales were very low this week, with five cases reported. Flu and RSV hospitalisations were also very low this week.
The latest data for Northern Ireland found that Covid activity was at very low levels across all surveillance indicators.
Covid levels in wastewater stayed stable and very low across all European countries still publishing this data.
For the week ending Aug 1, Covid activity in the USA increased slightly but stayed low in most states, with continuing signs of rising activity in the West region.
This week, Covid activity in Hong Kong fell, confirming that the recent wave is coming to an end. Singapore also saw moderately high Covid test positivity, while New Zealand Covid activity remained low.
As always, it's important to remember that the risk of hospitalisation from Covid increases significantly with age and for the clinically vulnerable. Therefore, it is important to take appropriate measures such as self-isolating when experiencing Covid symptoms and enhancing ventilation or wearing masks whenever possible.
Status of main respiratory diseases in England.
UKHSA have moved to publishing the Flu and COVID-19 surveillance reports fortnightly over the summer so there is limited data available this week.
The following chart shows the test positivity rate for all Covid tests reported on the UKHSA dashboard mapped against the UKHSA activity thresholds. The thresholds are based on the historical trend for Covid test positivity and, consequently, represent a relative risk. More details on this approach can be found in the Guide to Covid Surveillance Metrics.
The following chart shows that the test positivity rate increased slightly but remains well below the baseline threshold this week indicating a low risk. Positivity rates stayed very low in all regions, with only slight differences between them.
Scotland weekly hospital admissions and test positivity
Public Health Scotland is now publishing weekly data on Covid activity, but the Viral Respiratory Diseases in Scotland surveillance report will only be issued monthly until October 2026.
The latest edition of the report, confirms that during the reporting period Jun 15 to July 12, 2026 all respiratory disease indicators for Covid, Flu and RSV remained at baseline activity. However, during this period, two respiratory viruses showed activity of potential public health concern. Both Adenovirus and Parainfluenza reached medium activity levels in the week ending Jun 22, 2026, before dropping back to low activity levels this week.
The following panel chart presents this weeks data for Covid levels in wastewater in blue, weekly Covid test positivity shown in red, Covid hospital admissions depicted in orange, and beds occupied by Covid patients in brown.
All Covid indicators in Scotland stayed at very low levels in the past week indicating the risk from the virus remains very low. The slight increase in test positivity seen two weeks ago has returned, as positivity increased slightly to 1.3%.
The final chart in this section compares the test positivity rates for hospital patients with respiratory symptoms for Covid, Flu, and RSV. Positivity rates stayed well below baseline activity levels although there were small increases for both Flu and Covid.
Wales Covid hospital admissions.
The following chart provides the latest trend for weekly hospital admissions for the main respiratory viruses in Wales up to week ending Aug 2, 2026.
Covid hospital admissions were at very low levels, with just five people admitted this week. Hospitalisations for Flu and RSV also remained very low.
Flu and RSV are currently well below baseline and have dropped to out-of-season levels. As a result, publication of the weekly Acute Respiratory Infection Report for Wales is on hold and will not resume until the 2026-27 season.
Status of main respiratory diseases in Northern Ireland.
Public Health Northern Ireland publish a respiratory surveillance report covering Covid activity which is published every two weeks over the summer period. The latest available report covers data through the week ending Jul 26, 2026 and the chart below highlights the test positivity rates for Covid, Flu, and RSV.
Covid test positivity remained very low and also was low across all other surveillance indicators. Flu activity increased slightly but remained at low levels across surveillance indicators. RSV activity levels remained low and stable across all indicators.
Covid Activity in Other Countries.
This section reviews the latest Covid trends in Europe and North America together with Hong Kong, Singapore and New Zealand. In all countries across these regions, activity remains at very low levels apart from Hong Kong and Singapore which are experiencing higher levels of Covid activity.
The following chart shows the latest levels of Covid up to week ending Jul 30, 2026 as measured by monitoring wastewater in a number of European countries that still publish this information.
This week, Covid levels in wastewater remained very low across all European countries still sharing this data. Unfortunately, data for Switzerland was not available at the time of publishing
Charts for the USA were updated on Friday, Aug 7 to reflect the latest information.
As of week ending Aug 1, 2026 Covid activity in the USA remained low but there are there continues to be increasing Covid activity in the West region.
The following chart shows the weekly trend for the national key Covid indicators covering wastewater activity levels, percent of emergency department visits due to Covid, test positivity, and the hospital admission rate in the USA.
The panel chart shows that Covid activity is increasing slightly for the week ending Aug 1, 2026 as measured by wastewater. Also the key hospital indicators for Covid continued to increase slowly but remain relatively low.
Wastewater analysis for week ending Aug 1, 2026 showed that Covid levels are low or very low in most states as illustrated in the following map. However, activity in Alaska continued to rise and is now at a high level.
Each state is coloured based on activity levels, ranging from very high (dark red) to very low (light green), with grey indicating no data available. States with increasing activity levels are marked with cross-hatching.
Turning to Canada, the data for week ending Jul 25, 2026, shows that Covid wastewater levels remained at very low levels despite a slight increase over the past few weeks. Flu A and RSV activity stayed very low, while Flu B levels have fallen from their recent peak and are now at low levels.
The following chart displays the key Covid indicators for Hong Kong up to the week ending Aug 1, 2026. The latest surveillance data shows that the overall local activity of Covid has continued to fall indicating that the recent wave is coming to an end. The latest wastewater surveillance data and genetic analysis of positive respiratory specimens showed that NB.1.8.1 and its descendant lineages are the most prevalent variants in Hong Kong.
The next chart presents the weekly Covid positivity rate for tests carried out on patients with respiratory symptoms in Singapore up to week ending Jul 25, 2026. It shows that Covid activity peaked in May, consistent with the previous two years, and although it is now falling slowly remains moderately high.
In contrast, up to week ending Jul 26, 2026, New Zealand Covid levels in wastewater are falling and are now relatively low, while Covid cases stayed at historically low numbers.
In conclusion
Although the amount of data currently being published is reduced, the information available for all home nations show that Covid activity is very low. Flu activity has fallen from its recent peak and is now at baseline out-of-season levels.
Covid levels in wastewater is also very low across European countries. In the USA, Covid activity has stayed at very low levels, except in a few states. Flu A activity in both the USA and Canada have dropped to low levels.
As always, if you have any comments on this Covid Situation Report or suggestions for topics to cover, please post a message below.
Thanks for reading Seeing The Forest for the Trees! Subscribe for free to receive new posts and support my work.
Appendix 1. Test positivity rates and prevalence
Positivity rates are derived from the results of hospital laboratory tests conducted on patients exhibiting symptoms of respiratory diseases. Test positivity is the percentage of patients who test positive for Covid of the total number of patients tested. Since the individuals tested for this measure are not a representative sample of the general population it differs from prevalence, which is derived from a representative sample of the population.
This report belongs to a weekly series summarising the Covid situation across the UK's home nations and other countries.
Thanks for reading Seeing The Forest for the Trees! Subscribe for free to receive new posts and support my work.
This week's report highlights the latest trends in respiratory illness activity across England, with updated figures for Scotland and Wales. It also shares recent Covid levels in selected countries in Europe, North America, and Asia, before finishing with the latest information on eligibility for future booster campaigns in the UK.
Charts for the USA and Canada will be updated on Friday, Jul 31 to reflect the latest published data.
Summary.
This week, key Covid indicators across England, Scotland, and Wales stayed very low, indicating that the risk level is still low.
In England, test positivity and key hospital indicators for Covid remained very low and well within baseline levels.
This week, all key Covid indicators for Scotland remained very low and well within baseline levels, suggesting the risk is minimal.
Covid hospital admissions in Wales were very low this week, with only one case reported. Flu and RSV hospitalisations were also very low this week.
The Northern Ireland data was not updated this week. However the previous report found that Covid activity was at very low levels across all surveillance indicators.
Covid levels in wastewater stayed stable and very low across all European countries still publishing this data.
For the week ending Jul 18, Covid levels in USA as measured by key hospital indicators were very low across almost all states, although there are signs of increasing activity particularly in the west region.
This week, Covid activity in Hong Kong remained high, though there are early signs the recent wave may have peaked. Singapore also saw moderately high levels, while New Zealand kept its Covid activity low.
As always, it's important to remember that the risk of hospitalisation from Covid increases significantly with age and for the clinically vulnerable. Therefore, it is important to take appropriate measures such as self-isolating when experiencing Covid symptoms and enhancing ventilation or wearing masks whenever possible.
Status of main respiratory diseases in England.
UKHSA have moved to publishing the Flu and COVID-19 surveillance reports fortnightly over the summer so there is limited data available this week.
This section starts with the latest data on test positivity rates for Covid in England. It's important to note that positivity is different from prevalence, which reflects the overall percentage of Covid cases in the general population. Appendix 1 offers a more detailed explanation of the distinction.
The following chart shows the test positivity rate for all Covid tests taken mapped against the UKHSA activity thresholds. The thresholds are based on the historical trend for Covid test positivity and, consequently, represent a relative risk. More details on this approach can be found in the Guide to Covid Surveillance Metrics.
The chart shows that the test positivity rate remains low and continues to be well below the baseline, indicating a low level of risk. Positivity rates stayed low in all regions and across all ages, with only slight differences between them.
The following chart highlights two key indicators of Covid in hospitals: weekly test positivity rates among patients with respiratory issues, and hospital admission rates.
Both of these hospital indicators for Covid activity remained at or near record low levels indicating a low level of risk.
The final chart shows the positivity rate for hospital patients for the main respiratory viruses, with Covid, Flu and RSV positivity rates remaining at historically low levels. While the Rhinovirus rate is higher than that of other respiratory viruses, it still remains within baseline levels.
Scotland weekly hospital admissions and test positivity
Public Health Scotland is now publishing weekly data on Covid activity, but the Viral Respiratory Diseases in Scotland surveillance report will only be issued monthly until October 2026.
The latest edition of the report, confirms that during the reporting period Jun 15 to July 12, 2026 all respiratory disease indicators for Covid, Flu and RSV remained at baseline activity. However, during this period, two respiratory viruses showed activity of potential public health concern. Both Adenovirus and Parainfluenza reached medium activity levels in the week ending Jun 22, 2026, before dropping back to low activity levels this week.
The following panel chart presents this weeks data for Covid levels in wastewater in blue, weekly Covid test positivity shown in red, Covid hospital admissions depicted in orange, and beds occupied by Covid patients in brown.
All Covid indicators in Scotland stayed at very low levels in the past week indicating the risk from the virus remains very low. The slight increase in test positivity seen two weeks ago has not continued, as positivity fell slightly to 0.6%.
The final chart in this section compares the test positivity rates for hospital patients with respiratory symptoms for Covid, Flu, and RSV. Positivity rates stayed well below baseline activity levels although there were small increases for both Flu and RSV.
Wales Covid hospital admissions.
The following chart provides the latest trend for weekly hospital admissions for the main respiratory viruses in Wales up to week ending Jul 26, 2026.
Covid hospital admissions fell to record low levels, with just one person admitted this week. Hospitalisations for Flu and RSV also remained very low this week.
Flu and RSV are currently well below baseline and have dropped to out-of-season levels. As a result, publication of the weekly Acute Respiratory Infection Report for Wales is on hold and will not resume until the 2026-27 season.
Status of main respiratory diseases in Northern Ireland.
Public Health Northern Ireland publish a respiratory surveillance report covering Covid activity which is published every two weeks over the summer period. The latest available report covers data through the week ending Jul 12, 2026 and the chart below highlights the test positivity rates for Covid, Flu, and RSV.
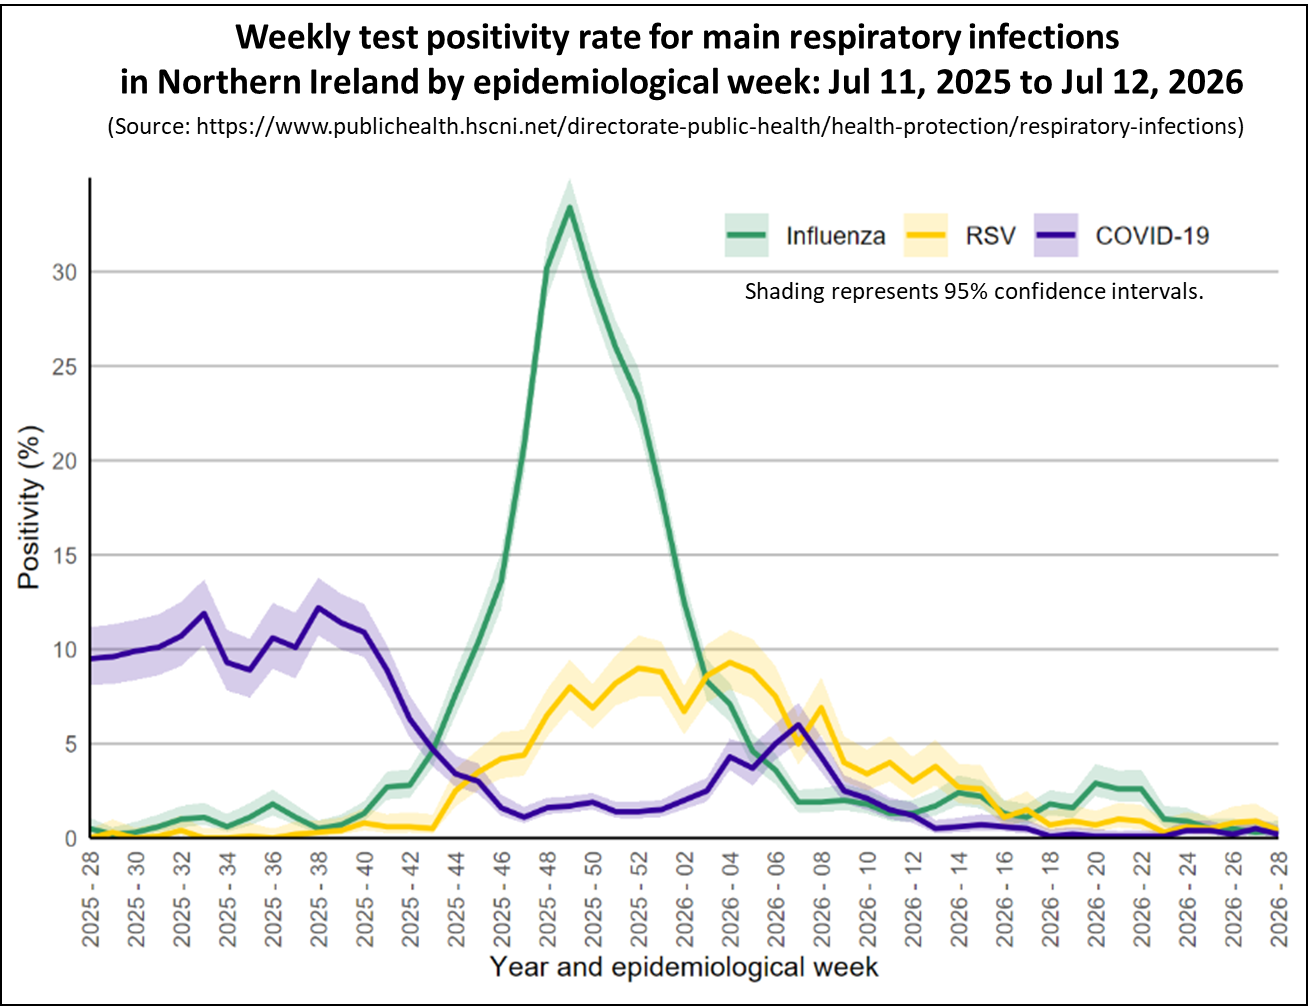
Covid test positivity remained very low and also was low across all other surveillance indicators. Flu and RSV activity was also low and stable across all surveillance indicators.
Covid Activity in Other Countries.
This section reviews the latest Covid trends in Europe and North America together with Hong Kong, Singapore and New Zealand. In all countries across these regions, activity remains at very low levels apart from Hong Kong and Singapore which are experiencing higher levels of Covid activity.
The following chart shows the latest levels of Covid up to week ending Jul 23, 2026 as measured by monitoring wastewater in a number of European countries that still publish this information.
This week, Covid levels in wastewater remained very low across all European countries still sharing this data.
Charts for the USA and Canada will be updated on Friday, Jul 31 to reflect the latest information.
As of week ending Jul 18, 2026 Covid activity in the USA remained low but there are some signs of increasing Covid activity in the west region.
The following chart shows the weekly trend for the national key Covid indicators covering wastewater activity levels, percent of emergency department visits due to Covid, test positivity, and the hospital admission rate in the USA.
The panel chart shows that Covid activity has stayed within the low activity level for the week ending Jul 18, 2026 as measured by wastewater. However, there was a slight increase in Emergency department visits, test positivity, and hospital admissions for Covid.
Wastewater analysis for week ending Jul 18, 2026 showed that Covid levels are low or very low in almost all states as illustrated in the following map. Each state is coloured based on activity levels, ranging from very high (dark red) to very low (light green), with grey indicating no data available. States with increasing activity levels are marked with cross-hatching.
Turning to Canada, the data for week ending Jul 11, 2026, shows that Covid wastewater levels remained at very low levels. Flu A and RSV activity have also stayed very low, while Flu B levels have continued to fall and are now at low levels.
The following chart displays the key Covid indicators for Hong Kong up to the week ending Jul 25, 2026. The latest surveillance data shows that the overall local activity of Covid has started to fall slightly indicating that the recent wave may be coming to an end. The latest wastewater surveillance data and genetic analysis of positive respiratory specimens showed that NB.1.8.1 and its descendant lineages are the most prevalent variants in Hong Kong.
The next chart presents the weekly Covid positivity rate for tests carried out on patients with respiratory symptoms in Singapore up to week ending Jul 18, 2026. It shows that Covid activity peaked in May, consistent with the previous two years, and although it is now falling slowly remains moderately high.
In contrast, up to week ending Jul 26, 2026, New Zealand Covid levels in wastewater are falling and are now relatively low, while Covid cases stayed at historically low numbers.
In conclusion
Although the amount of data currently being published is reduced, the information available for all home nations show that Covid activity is very low. Flu activity has fallen from its recent peak and is now at baseline out-of-season levels.
Covid levels in wastewater is also very low across European countries. In the USA, Covid activity has stayed at very low levels, except in a few states. Flu A activity in both the USA and Canada have dropped to low levels.
As always, if you have any comments on this Covid Situation Report or suggestions for topics to cover, please post a message below.
Thanks for reading Seeing The Forest for the Trees! Subscribe for free to receive new posts and support my work.
Appendix 1. Test positivity rates and prevalence
Positivity rates are derived from the results of hospital laboratory tests conducted on patients exhibiting symptoms of respiratory diseases. Test positivity is the percentage of patients who test positive for Covid of the total number of patients tested. Since the individuals tested for this measure are not a representative sample of the general population it differs from prevalence, which is derived from a representative sample of the population.
This report belongs to a weekly series summarising the Covid situation across the UK's home nations and other countries.
Thanks for reading Seeing The Forest for the Trees! Subscribe for free to receive new posts and support my work.
This week's report highlights the latest trends in respiratory illness activity across England, with updated figures for Scotland, Wales, and Northern Ireland. It also shares recent Covid levels in selected countries in Europe, North America, and Asia, before finishing with the latest information on eligibility for future booster campaigns in the UK.
Charts for the USA and Canada will be updated on Friday, Jul 24 to reflect the latest published data.
Summary.
This week, key Covid indicators across England, Scotland, and Wales stayed very low, indicating that the risk level is still low.
In England, test positivity for Covid remained very low and well within baseline levels.
This week, all key Covid indicators for Scotland remained well within baseline levels, suggesting the risk is minimal.
Covid hospital admissions in Wales were very low this week, with only four cases reported. Flu and RSV hospitalisations were also very low this week.
The Northern Ireland data was not updated this week. However the previous report found that Covid activity was at very low levels across all surveillance indicators.
Covid levels in wastewater stayed stable and very low across all European countries still publishing this data.
For the week ending Jul 11, Covid levels in USA as measured by key hospital indicators were very low across almost all states.
This week, Covid activity levels in Hong Kong stayed high, with Singapore seeing moderately high levels. In contrast, New Zealand maintained relatively low Covid activity.
Starting in Autumn 2027, the eligibility age for free Covid booster vaccinations in the UK will rise from 75 years and older to 80 years and older. There is no change to the other eligible groups, so older residents in a care home and individuals aged 6 months and over who are immunosuppressed will continue to be offered free boosters. Details can be found here.
As always, it's important to remember that the risk of hospitalisation from Covid increases significantly with age and for the clinically vulnerable. Therefore, it is important to take appropriate measures such as self-isolating when experiencing Covid symptoms and enhancing ventilation or wearing masks whenever possible.
Status of main respiratory diseases in England.
UKHSA have moved to publishing the Flu and COVID-19 surveillance reports fortnightly over the summer so there is limited data available this week.
The following chart shows the test positivity rate for all Covid tests reported on the UKHSA dashboard mapped against the UKHSA activity thresholds. The thresholds are based on the historical trend for Covid test positivity and, consequently, represent a relative risk. More details on this approach can be found in the Guide to Covid Surveillance Metrics.
The following chart shows that the test positivity rate remained well below the baseline threshold this week indicating a low risk. Positivity rates stayed very low in all regions, with only slight differences between them.
Scotland weekly hospital admissions and test positivity
Public Health Scotland is now publishing weekly data on Covid activity, but the Viral Respiratory Diseases in Scotland surveillance report will only be issued monthly until October 2026.
The latest edition of the report, confirms that during the reporting period Jun 15 to July 12, 2026 all respiratory disease indicators for Covid, Flu and RSV remained at baseline activity. However, during this period, two respiratory viruses showed activity of potential public health concern. Both Adenovirus and Parainfluenza reached medium activity levels in the week ending Jun 22, 2026, before dropping back to low activity levels this week.
The following panel chart presents this weeks data for Covid levels in wastewater in blue, weekly Covid test positivity shown in red, Covid hospital admissions depicted in orange, and beds occupied by Covid patients in brown.
All Covid indicators in Scotland stayed at very low levels in the past week indicating the risk from the virus remains very low. The slight increase in test positivity seen last week has not continued, as positivity has remained stable at 0.8%.
The final chart in this section compares the test positivity rates for hospital patients with respiratory symptoms for Covid, Flu, and RSV. Positivity rates stayed well below baseline activity levels although there were small increases for both Covid and Flu.
Wales Covid hospital admissions.
The following chart provides the latest trend for weekly hospital admissions for the main respiratory viruses in Wales up to week ending Jul 19, 2026.
Covid hospital admissions stayed very low levels, with just four people admitted this week. Hospitalisations for Flu and RSV were also very low this week.
Flu and RSV are currently well below baseline and have dropped to out-of-season levels. As a result, publication of the weekly Acute Respiratory Infection Report for Wales is on hold and will not resume until the 2026-27 season.
Status of main respiratory diseases in Northern Ireland.
Public Health Northern Ireland publish a respiratory surveillance report covering Covid activity which is published every two weeks over the summer period. The latest report covers data through the week ending Jul 12, 2026 and the chart below highlights the test positivity rates for Covid, Flu, and RSV.
Covid test positivity remained very low and also was low across all other surveillance indicators. Flu and RSV activity was also low and stable across all surveillance indicators.
Covid Activity in Other Countries.
This section reviews the latest Covid trends in Europe and North America together with Hong Kong, Singapore and New Zealand. In all countries across these regions, activity remains at very low levels apart from Hong Kong and Singapore which are experiencing higher levels of Covid activity.
The following chart shows the latest levels of Covid up to week ending Jul 16, 2026 as measured by monitoring wastewater in a number of European countries that still publish this information.
This week, Covid levels in wastewater remained very low across all European countries still sharing this data.
Charts for the USA and Canada will be updated on Friday, Jul 24 to reflect the latest information.
As of week ending Jul 11, 2026 Covid activity in the USA fell and and is now very low across almost all states.
The following chart shows the weekly trend for the national key Covid indicators covering wastewater activity levels, percent of emergency department visits due to Covid, test positivity, and the hospital admission rate in the USA.
The panel chart shows that Covid activity has stayed within the very low activity level for the week ending Jul 11, 2026 as measured by wastewater. Emergency department visits, test positivity, and hospital admissions for Covid remained close to record low levels.
Wastewater analysis for week ending Jun 20, 2026 showed that Covid levels are very low in almost all states as illustrated in the following map. Each state is coloured based on activity levels, ranging from very high (dark red) to very low (light green), with grey indicating no data available. States with increasing activity levels are marked with cross-hatching.
Turning to Canada, the data for week ending Jul 11, 2026, shows that Covid wastewater levels remained at very low levels. Flu A and RSV activity have also stayed very low, while Flu B levels have continued to fall and are now at low levels.
The following chart displays the key Covid indicators for Hong Kong up to the week ending Jul 18, 2026. The latest surveillance data shows that the overall local activity of Covid has continued to increase, and is currently in an active period. The latest wastewater surveillance data and genetic analysis of positive respiratory specimens showed that NB.1.8.1 and its descendant lineages are the most prevalent variants in Hong Kong.
The next chart presents the weekly Covid positivity rate for tests carried out on patients with respiratory symptoms in Singapore up to week ending Jul 11, 2026. It shows that Covid activity peaked in May, consistent with the previous two years, and although is now falling remains moderately high
In contrast, up to week ending Jul 12, 2026, New Zealand Covid levels in wastewater are steady and moderately low, while Covid cases stayed at historically low numbers.
Eligibility for future free Covid Boosters in the UK.
Last week, the Joint Committee on Vaccination and Immunisation (JCVI) released its advice for future Covid vaccination campaigns in the UK. They recommend that for Autumn 2027 free vaccinations should be offered by the NHS to:
adults aged 80 years and over;
residents in a care home for older adults; and
individuals aged 6 months and over who are immunosuppressed
This is a change to the current age criteria, which will remain in place for the Autumn 2026 and Spring 2027 campaigns, that allows those aged 75 years and over to receive free boosters.
The main reason for this change is that Covid's overall prevalence has declined over time, with just one wave in 2025 compared to the more frequent and larger waves seen in previous years. They also point out that the highest rates of hospitalisation and mortality remain among those over 85, and that hospitalisations didn't rise in groups where free vaccinations had once been offered but later discontinued.
Worryingly, part of the JCVI's cost-effectiveness calculation assumes that older people are more willing to pay for private vaccinations.They write that:
Increasing age remains the most important risk factor associated with COVID-19 hospitalisation and mortality. Accordingly, willingness to pay increased with age.
This ignores pensioner poverty and will likely increase issues around equality.
In conclusion
Although the amount of data currently being published is reduced, the information available for all home nations show that Covid activity is very low. Flu activity has fallen from its recent peak and is now at baseline out-of-season levels.
Covid levels in wastewater is also very low across European countries. In the USA, Covid activity has stayed at very low levels, except in a few states. Flu A activity in both the USA and Canada have dropped to low levels.
As always, if you have any comments on this Covid Situation Report or suggestions for topics to cover, please post a message below.
Thanks for reading Seeing The Forest for the Trees! Subscribe for free to receive new posts and support my work.
Appendix 1. Test positivity rates and prevalence
Positivity rates are derived from the results of hospital laboratory tests conducted on patients exhibiting symptoms of respiratory diseases. Test positivity is the percentage of patients who test positive for Covid of the total number of patients tested. Since the individuals tested for this measure are not a representative sample of the general population it differs from prevalence, which is derived from a representative sample of the population.
This report belongs to a weekly series summarising the Covid situation across the UK's home nations and other countries.
Thanks for reading Seeing The Forest for the Trees! Subscribe for free to receive new posts and support my work.
This week's report highlights the latest trends in respiratory illness activity across England, with updated figures for Scotland, and Wales. It also shares recent Covid levels in selected countries in Europe, North America, and Asia, before finishing with details on the Spring booster campaign as it closes in the UK.
Charts for the USA and Canada will be updated on Friday, Jul 17 to reflect the latest published data.
Summary.
This week, key Covid indicators across England, Scotland, and Wales stayed very low, indicating that the risk level is still low. At the time of publishing there was no update available for Northern Ireland.
In England, all key surveillance indicators for Covid remained very low and well within baseline levels.
This week, all key Covid indicators for Scotland remained well within baseline levels, suggesting the risk is minimal. However, there was a very small increase in test positivity that's worth keeping an eye on.
Covid hospital admissions in Wales were very low this week, with only two cases reported. Flu and RSV hospitalisations were also very low this week.
The Northern Ireland data has not yet been published. However the previous report found that Covid activity was at very low levels across all surveillance indicators.
Covid levels in wastewater stayed stable and very low across all European countries still publishing this data.
For the week ending Jul 4, Covid levels in USA as measured by key hospital indicators were very low across almost all states.
The NHS Spring 2026 Covid booster campaign closed at the end of June although some outreach activity will continue for the next few weeks.
By the end of this year's Spring booster campaign, coverage was the lowest of any booster campaign across all Home Nations. In England, as in past campaigns, coverage is lowest in the most disadvantaged areas and among ethnic minority communities. London continued to have the lowest uptake of all English regions.
As always, it's important to remember that the risk of hospitalisation from Covid increases significantly with age and for the clinically vulnerable. Therefore, it is important to take appropriate measures such as self-isolating when experiencing Covid symptoms and enhancing ventilation or wearing masks whenever possible.
Status of main respiratory diseases in England.
UKHSA have moved to publishing the Flu and COVID-19 surveillance reports fortnightly over the summer so there is limited data available this week.
This section starts with the latest data on test positivity rates for Covid in England. It's important to note that positivity is different from prevalence, which reflects the overall percentage of Covid cases in the general population. Appendix 1 offers a more detailed explanation of the distinction.
The following chart shows the test positivity rate for all Covid tests taken mapped against the UKHSA activity thresholds. The thresholds are based on the historical trend for Covid test positivity and, consequently, represent a relative risk. More details on this approach can be found in the Guide to Covid Surveillance Metrics.
The chart shows that the test positivity rate remains low and continues to be well below the baseline level, indicating a low risk. Positivity rates stayed low in all regions and across all ages, with only slight differences between them.
The following chart highlights two key indicators of Covid in hospitals: weekly test positivity rates among patients with respiratory issues, and hospital admission rates.
Both of these hospital indicators for Covid activity remained at or near record low levels indicating a very low level of risk.
The final chart shows the positivity rate for hospital patients for the main respiratory viruses, with Covid, Flu and RSV positivity rates remaining at historically low levels. While the Rhinovirus rate is higher than that of other respiratory viruses, it still remains within baseline levels.
Scotland weekly hospital admissions and test positivity
Public Health Scotland is now publishing weekly data on Covid activity, but the Viral Respiratory Diseases in Scotland surveillance report will only be issued monthly until October 2026.
The latest edition of the report, confirms that during the reporting period Jun 15 to July 12, 2026 all respiratory disease indicators for Covid, Flu and RSV remained at baseline activity. However, during this period, two respiratory viruses showed activity of potential public health concern. Both Adenovirus and Parainfluenza reached medium activity levels in the week ending Jun 22, 2026, before dropping back to low activity levels this week.
The following panel chart presents this weeks data for Covid levels in wastewater in blue, weekly Covid test positivity shown in red, Covid hospital admissions depicted in orange, and beds occupied by Covid patients in brown.
All Covid indicators in Scotland stayed at very low levels in the past week indicating the risk from the virus remains very low. However, these was a slight increase in test positivity from 0.4% to 0.7% this week - something to keep an eye on.
The final chart in this section compares the test positivity rates for hospital patients with respiratory symptoms for Covid, Flu, and RSV. Positivity rates stayed well below baseline activity levels although there were small increases for both Covid and Flu.
Wales Covid hospital admissions.
The following chart provides the latest trend for weekly hospital admissions for the main respiratory viruses in Wales up to week ending Jul 12, 2026.
Covid hospital admissions stayed very low levels, with just three people admitted this week. Hospitalisations for Flu and RSV were also very low this week.
Flu and RSV are currently well below baseline and have dropped to out-of-season levels. As a result, publication of the weekly Acute Respiratory Infection Report for Wales is on hold and will not resume until the 2026-27 season.
Status of main respiratory diseases in Northern Ireland.
Public Health Northern Ireland publish a respiratory surveillance report covering Covid activity which is published every two weeks over the summer period. At the time of publishing this weeks report was not available.
The report of Jul 1, 2026 showed that Covid activity stayed very low across all other surveillance indicators. Flu activity had remained below baseline levels despite small increases in some indicators. RSV activity was low and stable across all surveillance indicators.
Covid Activity in Other Countries.
This section reviews the latest Covid trends in Europe and North America together with Hong Kong, Singapore and New Zealand. In all countries across these regions, activity remains at very low levels apart from Hong Kong and Singapore which are experiencing higher levels of Covid activity.
The following chart shows the latest levels of Covid up to week ending Jul 9, 2026 as measured by monitoring wastewater in a number of European countries that still publish this information.
This week, Covid levels in wastewater remained very low across all European countries still sharing this data, with near record-low activity in several countries.
Data for the USA and Canada will be updated on Friday, Jul 17 to reflect the latest information.
As of week ending Jul 4, 2026 Covid activity in the USA fell and and is now very low across almost all states.
The following chart shows the weekly trend for the national key Covid indicators covering wastewater activity levels, percent of emergency department visits due to Covid, test positivity, and the hospital admission rate in the USA.
The panel chart shows that Covid activity has stayed within the very low activity level for the week ending Jul 4, 2026 as measured by wastewater. Emergency department visits, test positivity, and hospital admissions for Covid remained close to record low levels.
Wastewater analysis for week ending Jun 20, 2026 showed that Covid levels are very low in almost all states as illustrated in the following map. Each state is coloured based on activity levels, ranging from very high (dark red) to very low (light green), with grey indicating no data available. States with increasing activity levels are marked with cross-hatching.
Turning to Canada, the data for week ending Jun 27, 2026, shows that Covid wastewater levels remained at very low levels. Flu A and RSV activity have also stayed very low, while Flu B levels have continued to fall and are now at low levels.
The following chart displays the key Covid indicators for Hong Kong up to the week ending Jul 11, 2026. The latest surveillance data shows that the overall local activity of Covid has continued to increase, and is currently in an active period. The latest wastewater surveillance data and genetic analysis of positive respiratory specimens showed that NB.1.8.1 and its descendant lineages are the most prevalent variants in Hong Kong.
The next chart presents the weekly Covid positivity rate for tests carried out on patients with respiratory symptoms in Singapore up to week ending Jul 4, 2026. It shows that Covid activity peaked in May, consistent with the previous two years, but is now starting to fall.
In contrast, up to week ending Jun 28, 2026, New Zealand Covid levels in wastewater are steady and moderately low, while Covid cases stayed at historically low numbers.
Spring 2026 Covid Booster campaign.
The NHS Spring Covid booster campaign started on April 13, 2026 and closed at the end of June. People aged 75 years and older, residents in care homes for older people, and those aged 6 months and over with a weakened immune system were offered a dose of the Covid vaccine this spring. These are same criteria used for the Autumn 2025 booster campaign.
The following chart shows the coverage for each Autumn and Spring booster campaign for people aged 75 and older in England, with the Spring 2026 campaign having the lowest coverage recorded.
This trend has been seen across all the Home Nations, each reporting the lowest uptake for the Covid booster in this year's Spring Campaign, as shown in the following table.
Finally, NHS England has published a breakdown of booster coverage by deprivation level and ethnicity at the end of the Spring Booster campaign. It shows that people living in the most deprived areas have the lowest coverage as do ethnic minorities
Booster coverage is also significantly lower in London for both those aged 75 years and older, as well those who are immunosuppressed.
In conclusion
Although the amount of data currently being published is reduced, the information available for all home nations show that Covid activity is very low. Flu activity has fallen from its recent peak and is now at baseline out-of-season levels.
Covid levels in wastewater is also very low across European countries. In the USA, Covid activity has stayed at very low levels, except in a few states. Flu A activity in both the USA and Canada have dropped to low levels.
As always, if you have any comments on this Covid Situation Report or suggestions for topics to cover, please post a message below.
Thanks for reading Seeing The Forest for the Trees! Subscribe for free to receive new posts and support my work.
Appendix 1. Test positivity rates and prevalence
Positivity rates are derived from the results of hospital laboratory tests conducted on patients exhibiting symptoms of respiratory diseases. Test positivity is the percentage of patients who test positive for Covid of the total number of patients tested. Since the individuals tested for this measure are not a representative sample of the general population it differs from prevalence, which is derived from a representative sample of the population.
This report belongs to a weekly series summarising the Covid situation across the UK's home nations and other countries.
Thanks for reading Seeing The Forest for the Trees! Subscribe for free to receive new posts and support my work.
This week's report highlights the latest trends in respiratory illness activity across England, with updated figures for Scotland, and Wales. It also shares recent Covid levels in selected countries in Europe, and North America and wraps up with details on the Spring booster campaign as it closes in the UK.
Charts for the USA and Canada will be updated on Friday, Jul 10 to reflect the latest published data.
Summary.
This week, key Covid indicators across England, Scotland, and Wales stayed very low, indicating that the risk level is still low. There was no update for Northern Ireland this week.
In England, the Covid positivity rate for all tests was at record low levels.
This week, all key Covid indicators for Scotland remained at or close to record low levels, suggesting the risk is minimal.
Covid hospital admissions in Wales were very low this week, with only four cases reported. There were no Flu and RSV hospitalisations this week.
In Northern Ireland, Covid activity for the previous weeks remained at very low levels across all surveillance indicators.
Covid levels in wastewater stayed very low across all European countries still publishing ing this data, with several countries reporting record low activity.
For the week ending Jun 27, Covid levels in USA as measured by key hospital indicators were very low. Flu activity also remained at very low levels.
The NHS Spring 2026 Covid booster campaign closed at the end of June although some outreach activity will continue for the next few weeks.
As the Spring 2026 booster campaign closes, vaccine coverage in England has reached 56.9% for those aged 75 and over - the lowest of all booster campaigns. Overall coverage is higher in Scotland but lower in Northern Ireland.
As always, it's important to remember that the risk of hospitalisation from Covid increases significantly with age and for the clinically vulnerable. Therefore, it is important to take appropriate measures such as self-isolating when experiencing Covid symptoms and enhancing ventilation or wearing masks whenever possible.
Status of main respiratory diseases in England.
UKHSA have moved to publishing the Flu and COVID-19 surveillance reports fortnightly over the summer so there is limited data available this week.
This section starts with the latest data on test positivity rates for Covid in England. It's important to note that positivity is different from prevalence, which reflects the overall percentage of Covid cases in the general population. Appendix 1 offers a more detailed explanation of the distinction.
The following chart shows the test positivity rate for all Covid tests reported on the UKHSA dashboard mapped against the UKHSA activity thresholds. The thresholds are based on the historical trend for Covid test positivity and, consequently, represent a relative risk. More details on this approach can be found in the Guide to Covid Surveillance Metrics.
The following chart shows that the test positivity rate reached a record low level this wee and remains well below the baseline threshold, indicating a low risk. Positivity rates stayed very low in all regions, with only slight differences between them.
Scotland weekly hospital admissions and test positivity
Public Health Scotland is now publishing weekly data on Covid activity, but the Viral Respiratory Diseases in Scotland surveillance report will only be issued monthly until October 2026. The latest edition, confirms that all syndromic respiratory disease indicators remained at baseline activity during the past four weeks, with laboratory case counts decreasing for Covid, Flu and RSV.
The following panel chart presents this weeks data for Covid levels in wastewater in blue, weekly Covid test positivity shown in red, Covid hospital admissions depicted in orange, and beds occupied by Covid patients in brown.
All Covid indicators in Scotland stayed at or near record low levels in the past week indicating the risk from the virus remains very low. For the week ending Jul 5, there was only one hospital admission for Covid, matching the lowest number recorded.
The final chart in this section compares the test positivity rates for hospital patients with respiratory symptoms for Covid, Flu, and RSV. All positivity rates stayed well below baseline activity levels.
Wales Covid hospital admissions.
The following chart provides the latest trend for weekly hospital admissions for the main respiratory viruses in Wales up to week ending Jul 5, 2026.
Covid hospital admissions stayed very low levels, with just four people admitted this week. There were no hospitalisations for Flu and RSV this week.
Flu and RSV are currently well below baseline and have dropped to out-of-season levels. As a result, publication of the weekly Acute Respiratory Infection Report for Wales is on hold and will not resume until the 2026-27 season.
Status of main respiratory diseases in Northern Ireland.
Public Health Northern Ireland publish a respiratory surveillance report covering Covid activity which is published every two weeks over the summer period. There was no update this week, with the next update due on Jul 16, 2026.
The previous weeks report showed that Covid activity stayed very low across all other surveillance indicators. Flu activity had remained below baseline levels despite small increases in some indicators. RSV activity was low and stable across all surveillance indicators.
Covid Activity in Other Countries.
This section reviews the latest Covid trends in Europe and North America. In all countries across these regions activity remains at very low level.
The following chart shows the latest levels of Covid up to week ending Jul 2, 2026 as measured by monitoring wastewater in a number of European countries that still publish this information.
This week, Covid levels in wastewater remained very low across all European countries still sharing this data, with near record-low activity in most countries.
Data for the USA and Canada will be updated on Friday, Jul 10 to reflect the latest information.
As of week ending Jun 27, 2026 Covid activity in the USA fell and and is now very low across almost all states.
The following chart shows the weekly trend for the national key Covid indicators covering wastewater activity levels, percent of emergency department visits due to Covid, test positivity, and the hospital admission rate in the USA.
The panel chart shows that Covid activity has stayed within the very low activity level for the week ending Jun 20, 2026 as measured by emergency department visits, test positivity, and hospital admissions remained at record low levels.
Wastewater analysis for week ending Jun 27, 2026 was not published this week due to the federal holiday. Data updates will resume on Monday, July 6, 2026.
The next chart, updated for the latest data, compares the percentage of Emergency Department visits caused by Covid and Flu. It shows that while Covid activity has now dropped to a low level, flu activity also fell and is at low levels nationwide.
Turning to Canada, the data for week ending Jun 20, 2026, shows that Covid wastewater levels remained at very low levels. Flu A and RSV activity have also stayed very low, while Flu B levels have continued to fall and are now at low levels.
Spring 2026 Covid Booster campaign.
The NHS Spring Covid booster campaign started on April 13, 2026 and closed at the end of June. People aged 75 years and older, residents in care homes for older people, and those aged 6 months and over with a weakened immune system were offered a dose of the Covid vaccine this spring. These are same criteria used for the Autumn 2025 booster campaign.
For the Spring 2026 booster campaign, approved mRNA vaccines from Moderna (Spikevax LP.8.1), as well as a protein-based vaccine from Sanofi (Nuvaxovid JN.1), were used for those aged 18 years and older. These vaccines are updated variants targeted at recent Omicron strains unlike the Pfizer vaccine used for the Autumn 2025 campaign.
The following chart shows the number of Covid vaccinations given by week for each of the booster campaigns in England.
At the close of the Spring 2026 campaign a total of 3,815,380 booster doses have been given. This is 203,782 fewer than was administered during the Spring 2025 campaign, and 859,022 fewer than the close of the Autumn 2025 campaign, which had the same group of people eligible.
The following chart shows the coverage for each Autumn and Spring booster campaign for people aged 75 and older in England, with the Spring 2026 campaign having the lowest coverage ever recorded.
The final chart in this section highlights the coverage among different groups eligible for Covid boosters in England, Scotland, and Northern Ireland at the close of the Spring 2026 campaign.
As the Spring 2026 campaign closes 56.9% of people in England aged 75 and over have been vaccinated, however just 31.2% of immunosuppressed individuals have been vaccinated. Northern Ireland has much lower coverage for all eligible groups.
In conclusion
Although the amount of data currently being published is reduced, the information available for all home nations show that Covid activity is very low. Flu activity has fallen from its recent peak and is now at baseline out-of-season levels.
Covid levels in wastewater is also very low across European countries. In the USA, Covid activity has stayed at very low levels, except in a few states. Flu A activity in both the USA and Canada have dropped to low levels.
As always, if you have any comments on this Covid Situation Report or suggestions for topics to cover, please post a message below.
Thanks for reading Seeing The Forest for the Trees! Subscribe for free to receive new posts and support my work.
Appendix 1. Test positivity rates and prevalence
Positivity rates are derived from the results of hospital laboratory tests conducted on patients exhibiting symptoms of respiratory diseases. Test positivity is the percentage of patients who test positive for Covid of the total number of patients tested. Since the individuals tested for this measure are not a representative sample of the general population it differs from prevalence, which is derived from a representative sample of the population.
This report belongs to a weekly series summarising the Covid situation across the UK's home nations and other countries.
Thanks for reading Seeing The Forest for the Trees! Subscribe for free to receive new posts and support my work.
This week's report highlights the latest trends in respiratory illness activity across England, with updated figures for Scotland, and Wales. It also shares recent Covid levels in selected countries in Europe, North America, and Asia and wraps up with details on the Spring booster campaign in England.
Charts for the USA and Caranda will be updated on Friday, Jul 3 to reflect the latest published data.
Summary.
This week, key Covid indicators across England, Scotland, and Wales stayed very low, indicating that the risk level is still low. There was no update for Northern Ireland this week.
In England, Covid test positivity for patients with respiratory illnesses was at record low levels. All other Covid indicators also remained very low.
This week, all key Covid indicators for Scotland remained at record low levels, suggesting the risk is minimal.
In Wales, Covid hospital admissions were at a record lows, with just one reported this week. Flu and RSV hospitalisations are also minimal.
In Northern Ireland, Covid activity for the previous weeks remained at very low levels across all surveillance indicators.
Covid levels in wastewater stayed very low across all European countries still reporting this data, with several countries reporting record low activity.
For the week ending Jun 20, Covid levels in USA wastewater were very low across almost all states reporting this data. Flu activity also remained at very low levels.
Covid activity is increasing in Hong Kong, has peaked in Singapore, whilst levels in New Zealand are stable and low.
The NHS Spring 2026 Covid booster campaign closed at the end of June although some outreach activity will continue for the next few weeks.
As the booster campaign comes to a close, vaccine coverage in England has reached 56.5% for those aged 75 and over. Overall coverage is higher in Scotland but lower in Northern Ireland.
As always, it's important to remember that the risk of hospitalisation from Covid increases significantly with age and for the clinically vulnerable. Therefore, it is important to take appropriate measures such as self-isolating when experiencing Covid symptoms and enhancing ventilation or wearing masks whenever possible.
Status of main respiratory diseases in England.
UKHSA have moved to publishing the Flu and COVID-19 surveillance reports fortnightly over the summer so there is limited data available this week.
This section starts with the latest data on test positivity rates for Covid in England. It's important to note that positivity is different from prevalence, which reflects the overall percentage of Covid cases in the general population. Appendix 1 offers a more detailed explanation of the distinction.
The following chart shows the test positivity rate for all Covid tests mapped against the UKHSA activity thresholds. The thresholds are based on the historical trend for Covid test positivity and, consequently, represent a relative risk. More details on this approach can be found in the Guide to Covid Surveillance Metrics.
The chart shows that the test positivity rate remained at very low levels and continues to be well below the baseline threshold, indicating a low risk. Positivity rates stayed low in all regions, with only slight differences between them.
The following chart highlights two key indicators of Covid in hospitals: test positivity rates among patients with respiratory issues and hospital admission rates. Covid admissions to hospital remained at record low levels this week.
The final chart in this section shows the positivity rate for hospital patients for the main respiratory viruses, with Covid, Flu and RSV positivity rates remaining at historically low levels.
Scotland weekly hospital admissions and test positivity
Public Health Scotland is now publishing weekly data on Covid activity, but the Viral Respiratory Diseases in Scotland surveillance report will only be issued monthly until October 2026. The latest edition, confirms that all syndromic respiratory disease indicators remained at baseline activity during the past four weeks, with laboratory case counts decreasing for Covid, Flu and RSV.
The following panel chart presents this weeks data for Covid levels in wastewater in blue, weekly Covid test positivity shown in red, Covid hospital admissions depicted in orange, and beds occupied by Covid patients in brown.
All Covid indicators in Scotland stayed at or near record low levels in the past week indicating the risk from the virus remains very low. For the week ending June 28, there were only two hospital admissions for Covid, matching the lowest number recorded.
The final chart in this section compares the test positivity rates for hospital patients with respiratory symptoms for Covid, Flu, and RSV. All positivity rates stayed well below baseline activity levels.
Wales Covid hospital admissions.
The following chart provides the latest trend for weekly hospital admissions for the main respiratory viruses in Wales up to week ending Jun 28, 2026.
Covid hospital admissions were at record low levels, with just one person admitted this week. Hospitalisations for Flu and RSV are also very low.
Flu and RSV are currently well below baseline and have dropped to out-of-season levels. As a result, publication of the weekly Acute Respiratory Infection Report for Wales is on hold and will not resume until the 2026-27 season.
Status of main respiratory diseases in Northern Ireland.
Public Health Northern Ireland publish a respiratory surveillance report covering Covid activity which is published every two weeks over the summer period. There was no update this week, with the next update due on Jul 2, 2026.
The previous weeks report showed that Covid activity stayed very low across all other surveillance indicators. Flu activity had remained below baseline levels despite small increases in some indicators. RSV activity was low and stable across all surveillance indicators.
Covid Activity in Other Countries.
This section reviews the latest Covid trends in Europe and North America together with Hong Kong, Singapore and New Zealand. In all countries across these regions, activity remains at very low levels apart from Hong Kong and Singapore which are experiencing higher levels of Covid activity.
The following chart shows the latest levels of Covid up to week ending Jun 25, 2026 as measured by monitoring wastewater in a number of European countries that still publish this information.
This week, Covid levels in wastewater remained very low across all European countries still sharing this data, with record-low activity in most countries.
Data for the USA and Canada will be updated on Friday, Jul 3 to reflect the latest information.
As of week ending Jun 20, 2026 Covid activity in the USA fell and and is now very low across almost all states.
The following chart shows the weekly trend for the national key Covid indicators covering wastewater activity levels, percent of emergency department visits due to Covid, test positivity, and the hospital admission rate in the USA.
The panel chart shows that Covid wastewater viral activity levels continued to fall and has stayed within the very low activity level for the week ending Jun 20, 2026. Emergency department visits, test positivity, and hospital admissions remained at record low levels.
Wastewater analysis for week ending Jun 20, 2026 showed that Covid levels are very low in almost all states as illustrated in the following map. Each state is coloured based on activity levels, ranging from very high (dark red) to very low (light green), with grey indicating no data available. States with increasing activity levels are marked with cross-hatching.
The interactive map lets you hover over any state using your cursor to see more details about wastewater viral activity levels, including coverage. It shows data from states nationwide for the week ending Jun 20, 2026.
The next chart, updated for the latest data, compares the percentage of Emergency Department visits caused by Covid and Flu. It shows that while Covid activity has now dropped to a low level, flu activity also fell and is at low levels nationwide.
Turning to Canada, the data for week ending Jun 13, 2026, shows that Covid wastewater levels remained at very low levels. Flu A and RSV activity have also stayed very low, while Flu B levels have continued to fall and are now at low levels.
The last countries in this section are Hong Kong, Singapore, and New Zealand, each displaying differing trends.
The following chart displays the key Covid indicators for Hong Kong up to the week ending Jun 27, 2026, showing that Covid activity is increasing across all measures.
The next chart presents the weekly Covid positivity rate for tests carried out on patients with respiratory symptoms. It shows that Covid activity peaked in May, consistent with the previous two years, but is now starting to fall.
In contrast, New Zealand Covid levels in wastewater are steady and moderately low, while Covid cases continue to stay at historically low numbers.
Spring 2026 Covid Booster campaign.
The NHS Spring Covid booster campaign started on April 13, 2026 and closed at the end of June. People aged 75 years and older, residents in care homes for older people, and those aged 6 months and over with a weakened immune system were offered a dose of the Covid vaccine this spring. These are same criteria used for the Autumn 2025 booster campaign.
For the Spring 2026 booster campaign, approved mRNA vaccines from Moderna (Spikevax LP.8.1), as well as a protein-based vaccine from Sanofi (Nuvaxovid JN.1), were used for those aged 18 years and older. These vaccines are updated variants targeted at recent Omicron strains unlike the Pfizer vaccine used for the Autumn 2025 campaign.
The following chart shows the number of Covid vaccinations given by week for each of the booster campaigns in England.
By the eleventh week of the Spring 2026 campaign a total of 3,776,104 booster doses have been given. This is 198,437 fewer than was administered during the Spring 2025 campaign, and 841,423 fewer than the Autumn 2025 campaign, which had the same group of people eligible.
The next chart in this section highlights the coverage among different groups eligible for Covid boosters in England, Scotland, and Northern Ireland for the week ending Jun 28, 2026. For Wales, the coverage data is available up to Jun 25, 2026 and for Northern Ireland up to Jun 21, 2026.
To date 56.5% of people in England aged 75 and over have been vaccinated, however just 21.6% of immunosuppressed individuals have been vaccinated. Northern Ireland have much lower coverage for all eligible groups.
In conclusion
Although the amount of data currently being published is reduced, the information available for all home nations show that Covid activity is very low. Flu activity has fallen from its recent peak and is now at baseline out-of-season levels.
Covid levels in wastewater is also very low across European countries. In the USA, Covid activity has stayed at very low levels, except in a few states. Flu A activity in both the USA and Canada have dropped to low levels. Covid activity is rising in Hong Kong, has peaked in Singapore and remains low in New Zealand.
As always, if you have any comments on this Covid Situation Report or suggestions for topics to cover, please post a message below.
Thanks for reading Seeing The Forest for the Trees! Subscribe for free to receive new posts and support my work.
Appendix 1. Test positivity rates and prevalence
Positivity rates are derived from the results of hospital laboratory tests conducted on patients exhibiting symptoms of respiratory diseases. Test positivity is the percentage of patients who test positive for Covid of the total number of patients tested. Since the individuals tested for this measure are not a representative sample of the general population it differs from prevalence, which is derived from a representative sample of the population.
This report belongs to a weekly series summarising the Covid situation across the UK's home nations and other countries.
Thanks for reading Seeing The Forest for the Trees! Subscribe for free to receive new posts and support my work.
This week's report highlights the latest trends in respiratory illness activity across England, with updated figures for Scotland, and Wales. It also shares recent Covid levels in selected countries in Europe and North America, and wraps up with details on the Spring booster campaign in England.
Charts for the USA will be updated on Friday, Jun 26 to reflect the latest published data.
Summary.
This week, key Covid indicators across England, Scotland, and Wales stayed very low, indicating that the risk level is still low. There was no update for Northern Ireland this week.
In England, Covid test positivity remained close to record low levels.
This week, all key Covid indicators for Scotland remained at record low levels, suggesting the risk is minimal.
In Wales, Covid hospital admissions stayed close to record lows, with just five reported this week. Flu and RSV hospitalisations are also minimal.
In Northern Ireland, Covid activity for the previous week remained at very low levels across all surveillance indicators.
Covid levels in wastewater stayed very low across all European countries still reporting this data, with several countries reporting record low activity.
For the week ending Jun 13, Covid levels in USA wastewater were very low across almost all states reporting this data. Flu activity also remained at very low levels.
Covid activity is increasing in Hong Kong whilst levels in New Zealand are stable and low.
The NHS Spring 2026 Covid booster campaign remains closes at the end of June with free vaccinations for adults aged 75 and older; residents in care homes for older adults; and immunosuppressed individuals aged 6 months and above.
By the tenth week of the campaign in England, vaccine coverage had reached 53.2% for those aged 75 and over. Overall coverage is higher in Scotland but lower in Northern Ireland.
People registered with a GP surgery in England can check their eligibility and book a vaccination appointment through this link.
Details of booking a free NHS Covid vaccination in Scotland can be found here, for Wales here, and in Northern Ireland here.
As always, it's important to remember that the risk of hospitalisation from Covid increases significantly with age and for the clinically vulnerable. Therefore, it is important to take appropriate measures such as self-isolating when experiencing Covid symptoms and enhancing ventilation or wearing masks whenever possible.
Status of main respiratory diseases in England.
UKHSA have moved to publishing the Flu and COVID-19 surveillance reports fortnightly over the summer so there is limited data available this week.
This section starts with the latest data on test positivity rates for Covid in England. It's important to note that positivity is different from prevalence, which reflects the overall percentage of Covid cases in the general population. Appendix 1 offers a more detailed explanation of the distinction.
The following chart shows the test positivity rate for all Covid tests reported on the UKHSA dashboard mapped against the UKHSA activity thresholds. The thresholds are based on the historical trend for Covid test positivity and, consequently, represent a relative risk. More details on this approach can be found in the Guide to Covid Surveillance Metrics.
The chart shows that the test positivity rate remained at very low levels and continues to be well below the baseline threshold, indicating a low risk. Positivity rates stayed low in all regions, with only slight differences between them.
Scotland weekly hospital admissions and test positivity
Public Health Scotland has returned to publishing weekly data on Covid activity this week. However, the Viral Respiratory Diseases in Scotland surveillance report will be issued monthly until October 2026. The latest edition, confirms that all syndromic respiratory disease indicators remained at baseline activity during the past four weeks, with laboratory case counts decreasing for all three.
The following panel chart presents this weeks data for Covid levels in wastewater in blue, weekly Covid test positivity shown in red, Covid hospital admissions depicted in orange, and beds occupied by Covid patients in brown.
All Covid indicators in Scotland stayed at record low levels in the past weeks indicating the risk from the virus remains very low. For the week ending June 14, Covid activity measured by wastewater levels remained close to its lowest level ever at 1.0 million gene copies per person per day.
The final chart in this section compares the test positivity rates for hospital patients with respiratory symptoms for Covid, Flu, and RSV. All positivity rates stayed below baseline activity levels.
Wales Covid hospital admissions.
The following chart provides the latest trend for weekly hospital admissions for the main respiratory viruses in Wales up to week ending Jun 21, 2026.
Covid hospital admissions remain very low, with only five reported this week. Hospitalisations for flu and RSV are also minimal.
Flu and RSV are currently well below baseline and have dropped to out-of-season levels. As a result, publication of the weekly Acute Respiratory Infection Report for Wales is on hold and will not resume until the 2026-27 season.
Status of main respiratory diseases in Northern Ireland.
Public Health Northern Ireland publish a respiratory surveillance report covering Covid activity which is published every two weeks over the summer period. There was no update this week, with the next update due on Jul 2, 2026.
The previous weeks report showed that Covid activity stayed very low across all other surveillance indicators. Flu activity had remained below baseline levels despite small increases in some indicators. RSV activity was low and stable across all surveillance indicators.
Covid Activity in Other Countries.
This section reviews the latest Covid trends in Europe and North America together with Hong Kong and New Zealand. In all countries across these regions, activity remains at very low levels apart from Hong Kong which is experiencing a rise in Covid levels.
The following chart shows the latest levels of Covid up to week ending Jun 18, 2026 as measured by monitoring wastewater in a number of European countries that still publish this information.
This week, Covid levels in wastewater remained very low across all European countries still sharing this data, with record-low activity in most countries.
Data for the USA will be updated on Friday, Jun 26 to reflect the latest information.
As of week ending Jun 13, 2026 Covid activity in the USA fell and and is now very low across all states.
The following chart shows the weekly trend for the national key Covid indicators covering wastewater activity levels, percent of emergency department visits due to Covid, test positivity, and the hospital admission rate in the USA.
Although Covid wastewater viral activity levels weren't published this week, they were at very low levels for the week ending June 6, 2026. Meanwhile, emergency department visits, test positivity, and hospital admissions were updated and stayed at record lows levels
Wastewater analysis for week ending Jun 6, 2026 showed that Covid levels are very low in almost all states as illustrated in the following map. Each state is coloured based on activity levels, ranging from very high (dark red) to very low (light green), with grey indicating no data available. States with increasing activity levels are marked with cross-hatching.
The interactive map lets you hover over any state using your cursor to see more details about wastewater viral activity levels. It shows data from states nationwide for the week ending Jun 6, 2026.
The next chart, updated for the latest data, compares the percentage of Emergency Department visits caused by Covid and Flu. It shows that while Covid activity has now dropped to a low level, flu activity also fell and is at low levels nationwide.
Turning to Canada, the data for week ending Jun 13, 2026, shows that Covid wastewater levels remained at very low levels. Flu A and RSV activity have also stayed very low, while Flu B levels have continued to fall and are now at low levels.
The last countries in this section are Hong Kong and New Zealand, each displaying differing trends.
This chart displays the key Covid indicators for Hong Kong up to the week ending Jun 20, 2026, showing that Covid activity is increasing across all measures.
In contrast, New Zealand Covid levels in wastewater are steady and relatively low, while Covid cases continue to stay at historically low numbers.
Spring 2026 Covid Booster campaign.
The NHS Spring Covid booster campaign started on April 13, 2026 and closes at the end of June. People aged 75 years and older, residents in care homes for older people, and those aged 6 months and over with a weakened immune system will be offered a dose of the Covid vaccine this spring. These are same criteria used for the Autumn 2025 booster campaign.
For the Spring 2026 booster campaign, approved mRNA vaccines from Moderna (Spikevax LP.8.1), as well as a protein-based vaccine from Sanofi (Nuvaxovid JN.1), are being used for those aged 18 years and older. These vaccines are updated variants targeted at recent Omicron strains unlike the Pfizer vaccine used for the Autumn 2025 campaign.
The following chart shows the number of Covid vaccinations given by week for each of the booster campaigns in England.
By the tenth week of the Spring 2026 campaign a total of 3,696,092 booster doses have been given. This is 154,134 fewer than was administered during the Spring 2025 campaign, and 871,829 fewer than the Autumn 2025 campaign, which had the same group of people eligible.
The next chart in this section highlights the coverage among different groups eligible for Covid boosters in England, Scotland, and Northern Ireland for the week ending Jun 21, 2026. For Wales, the coverage data is available up to Jun 18, 2026 and for Northern Ireland up to Jun 14, 2026.
To date 53.2% of people in England aged 75 and over have been vaccinated, however just 21.3% of immunosuppressed individuals have been vaccinated. Northern Ireland have much lower coverage for all eligible groups.
In conclusion
Although the amount of data currently being published is reduced, the information available for all home nations show that Covid activity is very low. Flu activity has fallen from its recent peak and is now at baseline out-of-season levels.
Covid levels in wastewater is also very low across European countries. In the USA, Covid activity has stayed at very low levels, except in a few states. Flu A activity in both the USA and Canada have dropped to low levels, while Flu B remains at a moderate levels in Canada, although it is falling.
As always, if you have any comments on this Covid Situation Report or suggestions for topics to cover, please post a message below.
Thanks for reading Seeing The Forest for the Trees! Subscribe for free to receive new posts and support my work.
Appendix 1. Test positivity rates and prevalence
Positivity rates are derived from the results of hospital laboratory tests conducted on patients exhibiting symptoms of respiratory diseases. Test positivity is the percentage of patients who test positive for Covid of the total number of patients tested. Since the individuals tested for this measure are not a representative sample of the general population it differs from prevalence, which is derived from a representative sample of the population.


