
The nature of the shortage of diesel and jet fuel is more complex than most people realize. Based on my analysis, a shortfall has existed since at least 2020. The shortage is not simply the result of the closure of the Strait of Hormuz.
In this post, I will provide background information regarding the nature of the shortfall and the international conflict it is leading to. I will also share my thoughts on how, over the long term, the situation might be mitigated. I doubt whether a solution will be available in the short term, but I can at least give readers an idea of one direction in which a possible workaround might be available.
My idea is that the economy needs to transform itself in a way that uses diesel and jet fuel (grouped together on some reports as "middle distillates") more sparingly. At the same time, research on extracting heavy oil and bitumen at lower cost is needed. If this is done, it may be possible to use additional heavy oil to increase the supply of diesel and jet fuel.
One thing that will probably need to change is the price of diesel relative to gasoline. The price difference will likely need to be even greater than it has been in the recent past because heavy oil is inherently more difficult to extract, refine, process, and transport.
[1] The interconnected nature of the economy means that inexpensive energy products are extremely important to the economy.Energy supply and the economy are a great deal more interconnected than most people realize. For example, if the price of diesel rises, the price of food also tends to rise because diesel is used in food production and transportation. Similarly, if the price of gasoline rises, the additional cost also tends to squeeze budgets. Politicians see these price increases and say to themselves, "These increases will make voters unhappy. Let's raise interest rates and see if we can get oil prices back down."
Higher interest rates don't affect everyone immediately, but they particularly impact people purchasing a vehicle or a home, and businesses seeking a loan.
 Figure 1. Slide by author, illustrating the impact that rising debt payments taking place at the same time as rising energy costs pose to household budgets.
Clearly, raising interest rates at the same time as energy prices are rising is "playing with fire." If the economy is really overstimulated and growing too quickly, this type of approach makes sense. But if the underlying problem is that diesel and jet fuel prices are high because of inadequate world production, what is really needed is higher oil prices, especially for the heavier crude oils that provide a disproportionate share of diesel and jet fuel.
Consumers and oil producers have two different needs for prices:
- Consumers want diesel and jet fuel prices low because high prices wreck their budgets. Diesel is used in growing food and transporting it to market. Jet fuel is used in transporting some kinds of foods. In fact, industries of all kinds (including mining, road building, and construction) use diesel and jet fuel. Higher prices of these fuels tend to make practically any kind of goods or services more expensive.
- Oil producers want diesel and jet fuel prices high, to incentivize investment in new wells. Without additional investment, the quantity of heavy oil extracted and made into these fuels will tend to decrease because of depletion issues.
While prices for diesel and jet fuel are higher this fall, quite a bit of the extra charges relate to extra transport and insurance costs. The high prices need to stay, and perhaps even increase, even if the immediate issues disappear, in order to incentivize greater long-term production. It is these rising prices that are likely to continue to squeeze budgets and push economies toward recession.
[2] What we call "oil" can vary quite widely from well to well. The trend over time has been toward lighter crude oils.Most people assume that all oil is equivalent, but this is not the case. Petroleum is a mixture of hydrocarbon molecules. The lightest ones are gases are room temperature, the medium weight ones are liquids, and the heaviest ones tend to be quite viscous. Some are even solids. Some oils, especially heavy oils, have sulfur or metal inclusions. Crude oil that contains sulfur is called "sour oil."
Heavier oils are ones that disproportionately produce diesel and jet fuel. Lighter oils tend to produce more gasoline, along with products like solvents, and the feedstocks for plastics.
In my view, a major reason why there tends to be a shortfall in diesel and jet fuel production (even apart from the current Middle East blockages) is that the type of oil needed tends to be more expensive to extract, refine, and transport than light oil. Furthermore, oil with sulfur tends to be quite corrosive, and removing the sulfur adds another layer of costs. The primary issue I see is that it is hard to pass on the higher production costs of heavy and sour oils to customers.
In theory, to cover all the costs involved related to heavy and sour oils, diesel and jet fuel prices should be quite a bit higher than gasoline prices for the same volume (liter or gallon). But if this were the case, the price of food would also increase, since diesel is extensively used in food production and transportation.
Figure 2 shows end products from the production process. We know, however, that lighter end products tend to come from lighter crude oils, so we can deduce that the crude oil mixture has been getting lighter over time. The amounts in Figure 2 include natural gas liquids, which are very light and growing in quantity.
 Figure 2. World per capita oil consumption (including natural gas liquids) by end product based on data from exhibit "Oil: Regional Consumption by Part" from the 2026 Statistical Review of World Energy, published by the Energy Institute. Amounts are measured by volume, not energy production.
The earliest oil that was extracted tended to be "medium oil," which tended to have a mixture of heavier and lighter molecules. As the medium oil depleted, new production tended to be lighter. In particular, US tight oil from shale is quite light. The increasing production of US tight oil from shale is adding to the Very Light layer, as well as the Gasoline layer.
[3] The world had a diesel and jet fuel shortage long before 2026.Because of the need for diesel and jet fuel in industry and transportation, a person would expect per-capita diesel and jet fuel consumption to grow as industry and international trade grows.
 Figure 3. World per capita consumption of diesel plus jet fuel based on data from the sheet, "Oil: Regional Consumption by Part" in the 2026 Statistical Review of World Energy, published by the Energy Institute.
Figure 3 shows that per capita consumption of diesel and jet fuel stopped growing about 2005. The year 2005 seems to be the time that the world's output of "conventional" (easy to extract) oil reached a peak. Figure 3 also shows that per capita consumption then plateaued until about 2019. It fell 16% in 2020, and it has not been able to fully recover since. The historical data on this chart is only through 2025, but the big Middle East cutbacks in 2026 will clearly send diesel and jet fuel consumption down from the 2025 level in 2026, as indicated by the red arrow.
At least in part, what is happening is that recent oil prices have not been high enough for countries producing somewhat heavy, sour oil. This is especially the case for oil exporting countries that depend on oil revenue to support their economies. They need more revenue than just enough to cover the cost of extraction, plus a reasonable return for shareholders. They also need money to fund the development of make-work projects to employ their citizens and to fund subsidized imported food for their population.
In the peak oil community, there seems to be the view that Middle East oil is always cheap to extract and refine. At one time, this may have been true, but most analyses overlook the tax needs of oil exporting countries. Tax needs are high in countries with exploding populations who need subsidized imported food. Huge make-work projects to provide employment possibilities, such as Saudi Arabia's construction of the city Neom, add to the need for higher tax revenue. Middle Eastern oil costs may also be rising because of depletion issues, such as wells yielding relatively more water in the oil/water mixture extracted.
[4] For oil exporters, one symptom of chronically inadequate prices for heavy/sour oil (including the need for high tax revenue) is the willingness to engage in war.If a person looks through my suggested list of heavy/sour oil producers shown on Figure 4, all the countries seem at least somewhat war-like. Even Canada tends to be war-like. Canadian leaders would be much happier if the price of crude oil exported to the US were considerably higher, and it would be less inclined to seek export partners in Asia and Europe.
 Figure 4. Recent crude oil production by countries whose oil tends to be heavier and/or sour, based on monthly oil production data of the EIA. Middle Eastern oil tends to be medium sour. I may have omitted some heavy/sour countries.
If the oil production of the heavy/sour countries and country groups found on Figure 4 is added together, the result is as shown in Figure 5. The total production of these countries exceeds the production of the rest of the world.
Notice that the countries of the Middle East tend to be quite price sensitive. Their production dropped steeply in 2020 when oil prices fell. Likewise, their production rose in 2022 when oil prices were temporarily higher, related to the start of the Ukraine-Russia conflict.
 Figure 5. Monthly world crude oil production of the total of the countries shown in Figure 4, compared to the monthly crude oil production of the rest of the world based on data of the EIA.
[5] Authorities claim that there would be plenty of heavy oil to refine if prices were to rise high enough for long enough.
The United States Geological Services provides maps of available heavy oil and bitumen deposits. Figure 6 indicates that heavy oil is widely available in North America, Europe, Russia, and the Middle East.
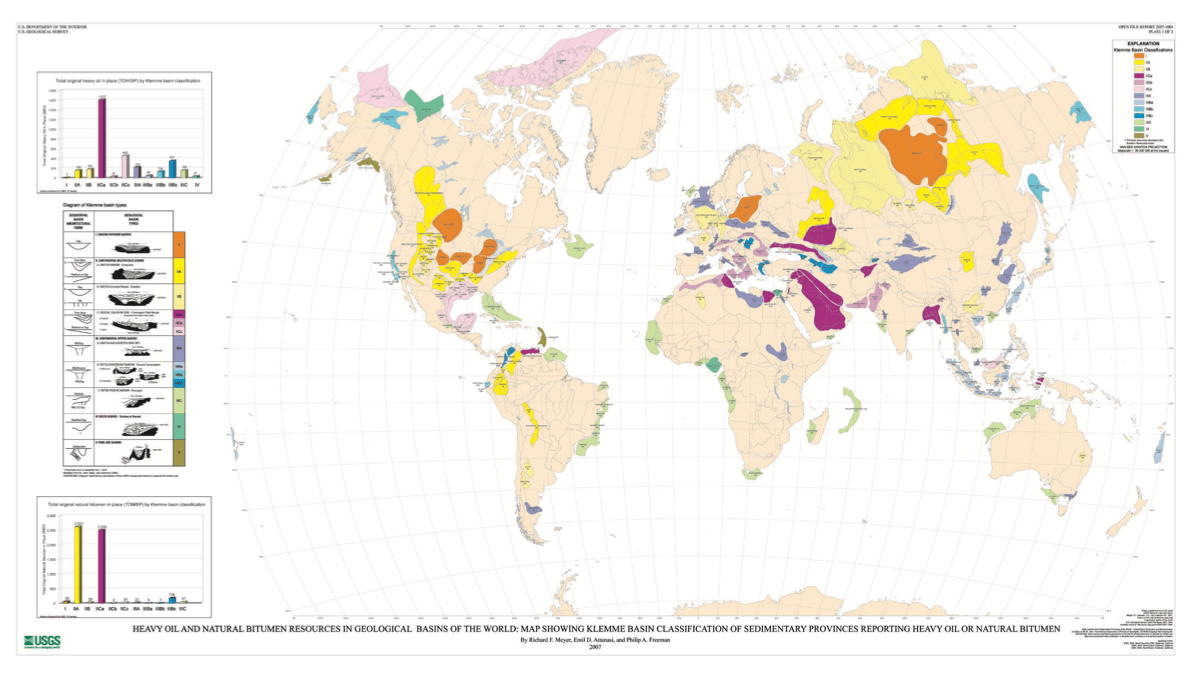 Figure 6. Map of Heavy Oil and Bitumen Resources by USGS. Source: Open File-Report 2007-1084
In 2015, the International Energy Agency published a report indicating that in its view, there were huge deposits of extra heavy oil and bitumen (EHOB) that could be accessed if the price of oil rose high enough for long enough (Figure 7). The same exhibit shows somewhat smaller availability of tight oil from shale. In fact, the US has been able to access a substantial amount of tight oil from shale in recent years.
 Figure 7. IEA Figure 1.4 from its World Energy Outlook 2015, showing how much oil can be produced at various price levels.
In my opinion, in order to access the EHOB, the prices of diesel and jet fuel need to rise to a high level over the long term; the prices of gasoline and even lighter products don't necessarily need to rise. If the prices of diesel and jet fuel rise high enough, for long enough, the price signal should work its way back to oil and gas companies, suggesting that they need to make investments in the direction of adding more extraction from EHOB. If this succeeds, it could perhaps relieve the problem of inadequate supply of diesel and jet fuel.
The prices of diesel and jet fuel are high now, but this is at least partly due to higher insurance costs and partly due to the extra costs related to shipping oil longer distances to avoid blocked straits. These extra costs don't get back to oil companies in a way that encourages countries to extract more heavy oil. What is needed are permanently higher prices for diesel and jet fuel, relative to the price of gasoline, even if the problems with respect to the straits of Hormuz and of Bab al-Mandab, disappear.
[6] Today's conflicts in the Middle East and Russia/Ukraine seem to relate to inadequate supplies of diesel and jet fuel for buyers of these fuels, and inadequate prices for sellers of the heavy/sour oils yielding these products.Figure 3, above, shows that the total supply of diesel plus jet fuel has been low, especially since 2020. One issue that has arisen recently is "Who gets the supply of diesel plus jet fuel that is available?" Figure 8 shows that increasingly, it has been the poorer countries of the world who obtain the diesel and jet fuel that is available. Note that total consumption of the Other than Advanced Countries has exceeded that of the Advanced Countries since 2020.
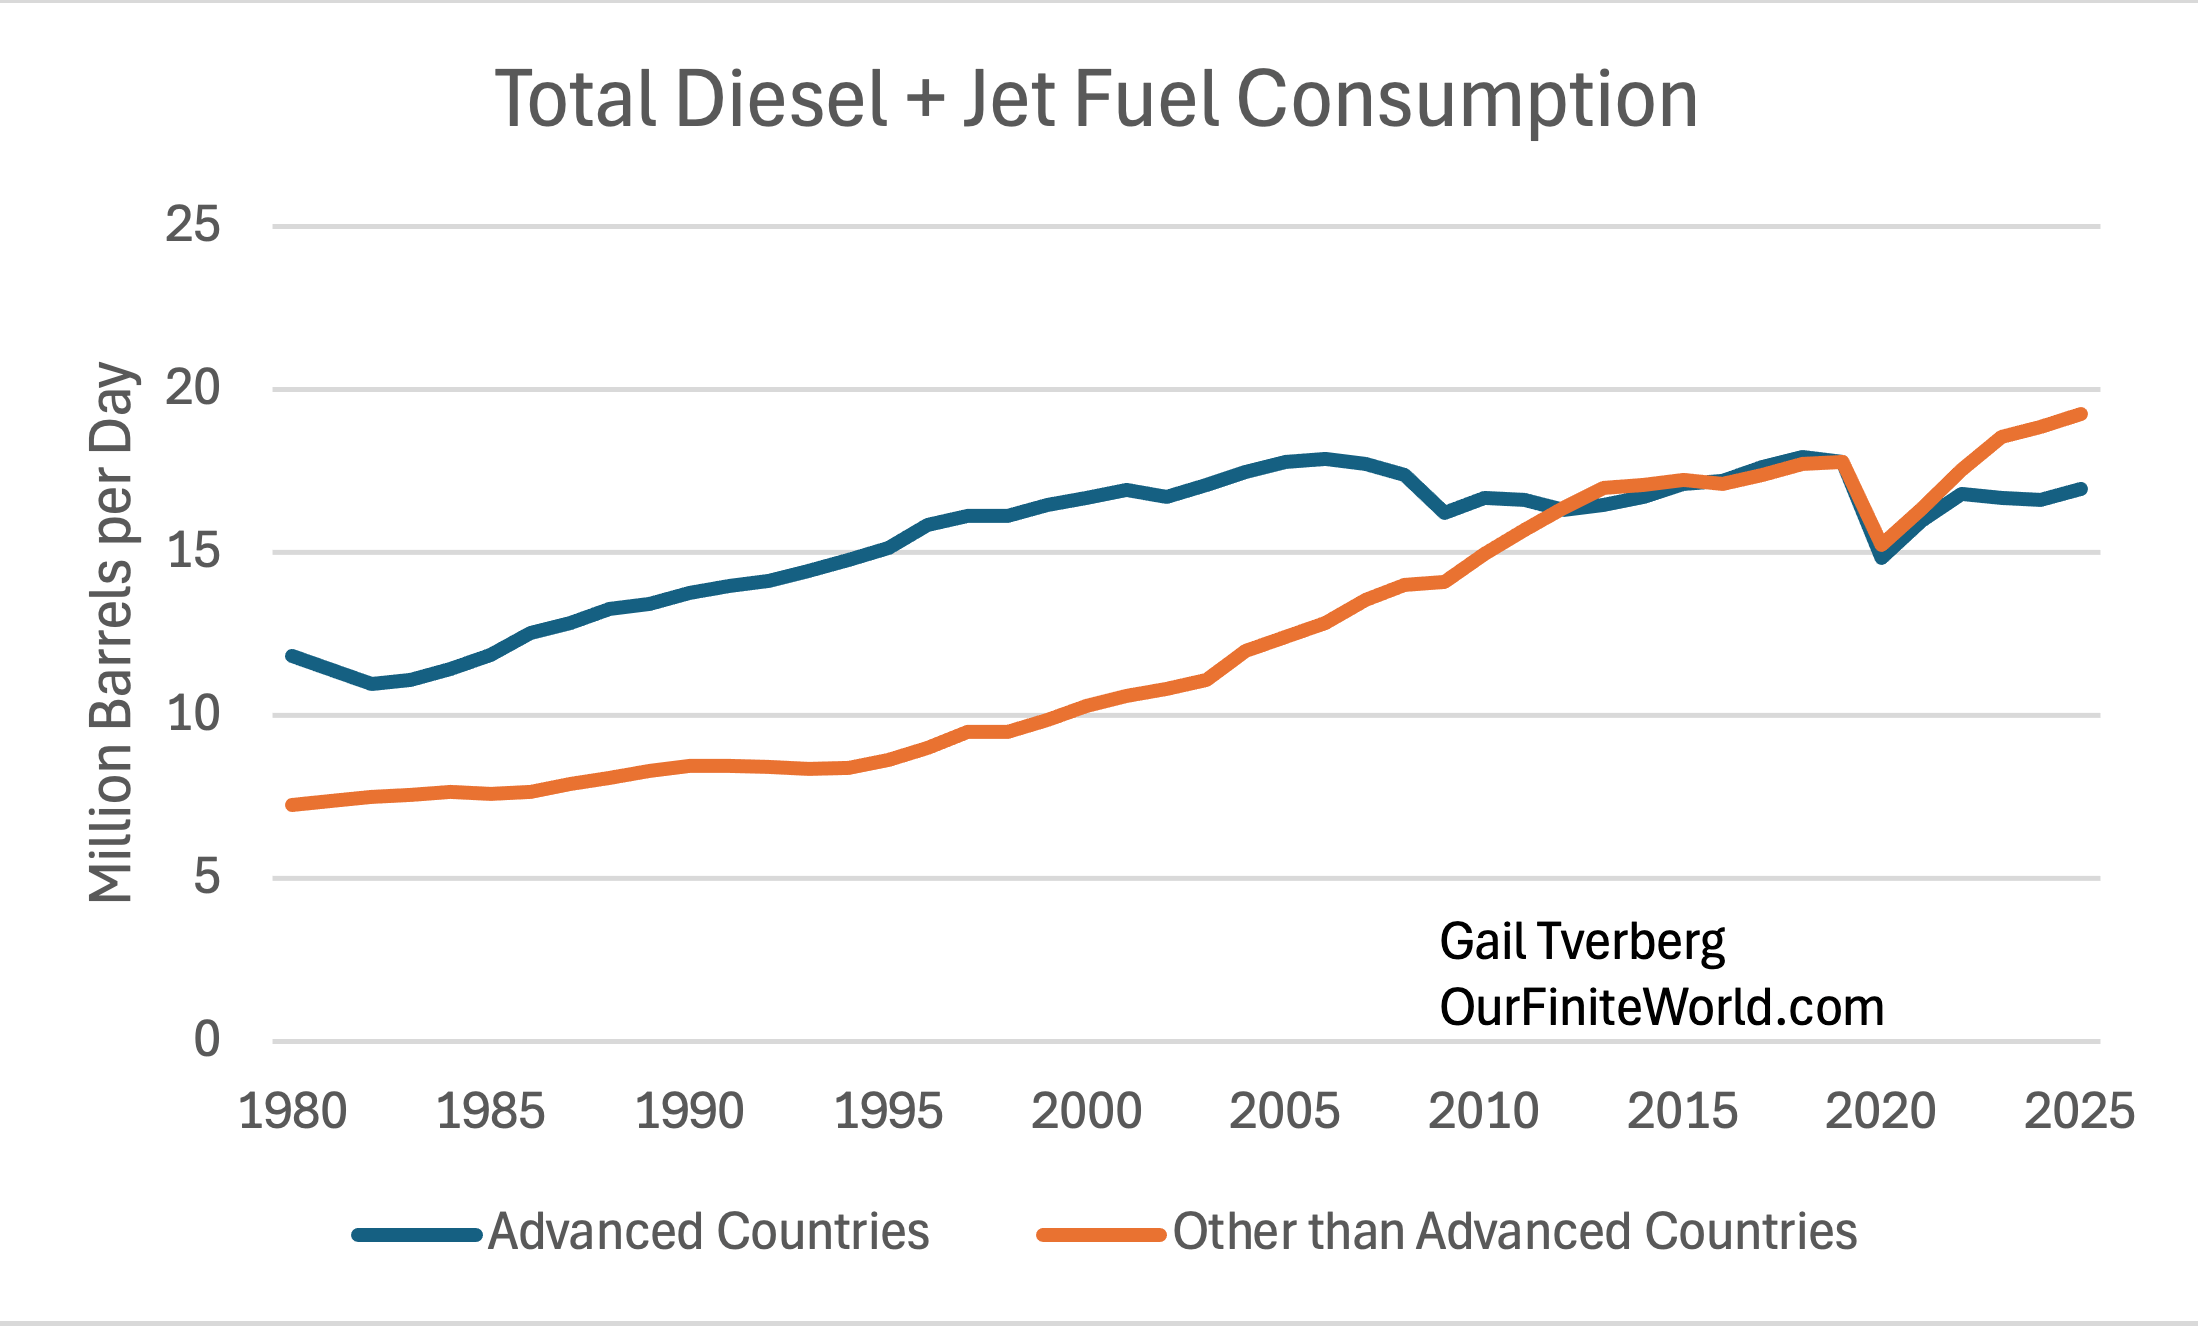 Figure 8. Diesel + Jet Fuel consumption for the Advanced Countries (OECD members), compared to that for the Other than Advanced Countries, based on data from the sheet, "Oil: Regional Consumption by Part" in the 2026 Statistical Review of World Energy, published by the Energy Institute. China, Russia, and Iran are in the "Other than Advanced Countries" group. The US, Israel, and NATO countries are in the Advanced Countries group.
Figure 9 shows that for the Advanced Economies, per capita consumption of diesel plus jet fuel has been declining since about 2005-the time of peak conventional crude oil. The same figure shows that per capita consumption of diesel plus jet fuel has plateaued since 2013 for Other than Advanced Countries. I think of 2013 as the year that China first started encountering major limits on coal extraction (somewhat like the year 1970 in the US for oil extraction). In recent years, China has been able to raise coal extraction somewhat, but at a higher cost.
 Figure 9. Per capita consumption of diesel + jet fuel consumption for Advanced Countries (OECD members), compared to that for Other than Advanced Countries, based on data from the sheet, "Oil: Regional Consumption by Part" in the 2026 Statistical Review of World Energy, published by the Energy Institute.
I would expect that countries in both groups would be dismayed by the situation shown in Figure 9. The per capita consumption of diesel plus jet fuel for the Advanced Countries has been falling for a long time. Partly this is the result of the economies changing to service economies. As service economies, the need for diesel by industry has been lessened. Wages tend to be less for many of these service jobs, making workers unhappy.
In Figure 9, people in the Other than Advanced Countries would tend to be dismayed by the continued wide gap between the standard of living of their own economy, and the standards of living in the Advanced Countries. Many of these countries export extracted resources that are ultimately sold as goods to people living in Advanced Countries. If the selling prices of these commodities were higher, workers in these countries could perhaps afford to have cars and air conditioning, like workers in the Advanced Countries. They would also be dismayed by the poor progress in raising their own per-capita consumption of diesel and jet fuel since 2013.
[7] Is there any possibility of greatly ramping up heavy oil production? Could it power a society like the one we have today?We know that heavy oil production began long ago. For example, the first recorded production of heavy oil began in the Kern River Basin in California in the 1860s, and commercial production began there in 1899. The first production in the Canadian Oil Sands began in 1921, and commercial production there began in 1967.
The extent to which the oil that is heavy and often sour can be ramped up in the future remains to be seen. Extraction techniques have gradually been improving, and I would expect that they can continue to improve. But the cost of extraction and processing will likely remain somewhat high because of all the energy-intensive steps that are needed to provide diesel and jet fuel.
I expect that society itself will need to change in order to make use of this higher-cost oil. These are a few ideas I have:
(a) Oil exporting countries will need to change in ways that reduce their need for tax revenue. This is an issue especially in the Middle East, which has a huge population, in a hot, dry climate. The population will likely need to fall (for example, many migrants and guest workers may need to move back to their country of origin), and make-work projects will need to be discontinued.
(b) Another issue is that total diesel and jet fuel usage will likely need to be reduced because it is likely to take several years before production of heavy oil can be ramped up. Society will need to be reorganized in a way that uses less diesel and jet fuel. One idea would be to shorten supply chains whenever possible. Figure 10 illustrates one idea how this might be done.
 Figure 10. Map of the world showing how the author expects the United States and China might split most world trade. Most trade would take place within the two areas shown. Within these groupings, the centers of trade might be the yellow areas shown.
(c) I expect that if such a change can be made, economies will need to gradually change in ways that are hard for us to understand now. The focus may need to be on essentials, including food and clothing. Governments may need to be smaller and provide fewer services. Communities may need to be smaller and more walkable. The total population may need to be lower.
[8] ConclusionIt seems to me that the self-organizing nature of economies will gradually push them in the directions they need to go if the world is to start incorporating a significant quantity of expensive products made from heavy oil into its energy mix.
We cannot yet imagine what all the changes will look like. In some ways they may resemble a recession, but there will likely still be an interest in greater complexity and in working to improve people's lives.
With the recent closure of the Strait of Hormuz, many expect oil prices to spike and stay high. Instead, they have barely budged. The latest spike in prices is a mini spike. If these oil prices were adjusted for inflation, the spikes in the past would appear even higher.
 Figure 1. Weekly average oil prices for West Texas Intermediate oil in a chart provided by EIA, with Iran conflict price spike circled.
This is not a new problem. Looking at energy data going back to 1820, low demand (affordability) has repeatedly produced financial crashes, wars, and collapses. We appear to be entering another such period.
In this post, I examine differences in how the economy behaves, comparing two different types of periods: those with low energy affordability ("low demand") and those with high energy affordably ("high demand"). I also offer my view on what this analysis suggests may be ahead for the world economy.
[1] How high demand differs from low demandHigh demand looks like a situation in which, each year, an increasing number of people can afford cars and the fuel that they require. With high demand, the number of new cars sold each year tends to rise. Young people are eager to buy homes because they find homes affordable. They find their incomes relatively higher than their parents' were at their age. Countries around the world find it easy to industrialize. This allows their citizens to have better lifestyles. As we will see later in this post, the periods of the 1950s, 1960s, and 1970s were periods of high growth in demand for oil products.
What we have now is the opposite: too many young people who cannot find jobs that pay well, even with advanced degrees. They cannot afford to go on a vacation or buy a new car. Record numbers live with their parents after they finish their schooling. They spend their spare time playing video games, rather than socializing with their friends.
The number of cars sold worldwide hit a peak in 2017, indicating indirectly that people are getting poorer. If people are not buying as many cars, demand for oil tends to fall, especially if more of the cars that are sold are electric.
Building new homes also takes oil. According to the US Census Bureau, the number of US new homes sold in the US hit a record of 1,283,000 in 2005. In 2025, the number of US new homes sold amounted to only 678,000, or about 53% of the peak amount. The huge drop in new home construction is a sign that people, quite often young people, are not as well off financially as they were years ago. They cannot afford to buy a new (or even a used) home anymore.
One study based on income tax data revealed that between 1948 and 1970, US incomes tended to rise faster than inflation. Between 1968 and 1983, the incomes of both the top 10% and the lower 90% rose as fast as inflation. However, between 1983 and 2012, the top 10% received far greater increases than the bottom 90% (Figure 2).
 Figure 2. Chart comparing income gains by the top 10% to income gains by the bottom 90% by economist Emmanuel Saez. Based on an analysis of IRS data, published in Forbes.
If workers in the bottom 90% of the distribution are not doing well, it is difficult to keep prices of commodities as high as those producing the commodities would prefer. Purchases of commodities, including food, and fuel for vehicles, do not rise proportionately with huge incomes. Elon Musk and other very high-income individuals do not spend all day eating or driving their vehicles. The bottom 90% must prosper for demand (affordability) of oil and other commodities to stay high.
[2] What experience with high and low growth in energy supplies since 1820 teaches us.Several years ago, I prepared an analysis of how the world economy behaved over the long term, over the period from 1820 to 2017. I have recently updated this study. I found that the economy behaved quite well in times of high energy consumption growth. In times of low energy consumption growth, there seemed to be many adverse events, such as financial crashes, wars, and government collapses.
I am afraid that with today's oil and debt problems, we are headed into a pattern of low energy consumption growth, or even energy consumption contraction. If this is the case, we should expect outcomes at least as undesirable those experienced during past periods of low energy consumption growth in the past.
(a) MethodologyI first prepared a new data set by combining two data sets, the earlier of which was available only every 10 years, with more recent data available more frequently. The energy quantities reported were rising rapidly. To analyze how fast they were rising, I first computed the average annual increase percentage for each 10-year period, as shown on Figure 3.
 Figure 3. Average annual growth rate in world total energy consumption, for 10-year periods, except the latest period which is only 7 years. Energy growth estimates are based on data from Energy Transitions: History, Requirements and Prospects (Appendix) by Vaclav Smil for older years, and data from BP's Statistical Review of World Energy for 1965 and subsequent. From this presentation.
For example, the period from 1961 to 1970 (shown as the 1970 bar) had a very high annual rate of growth rate for energy consumption. This was the period when many of the interstate highways in the US were opened and many pipelines were added.
On Figure 4, I divided the bars shown on Figure 3 into two parts.
 Figure 4. The blue bars on this chart represent the average annual increase in population, over the period indicated. The red bars represent the amount of the growth in energy consumption left over for growth in standards of living. Energy data is the same as in Figure 3. Population estimates for 1940 and prior are by Angus Maddison; estimates for more recent years are based on UN data.
On Figure 5, the blue portions of the bars represent the average annual increase in population over the 10-year period. The red portion of the bar is computed by subtraction from the total. It is the amount that seems to be left over for a rising standard of living. Having a tall red portion of the bar would be very good; having little or no red bar left would represent a problem. Note that in two periods (the one ended 1860 and the one ended 2000), the amount left over for an increase in living standards was negative.
(b) Good things happened in years with very high growth in "Living Standards"Figure 5 shows the information on Figure 4 as an area chart.
 Figure 5. Chart from a 2018 presentation using the same energy data as Figures 4 and 5, with some of the related events marked.
While I don't show oil prices on Figure 5, those who are familiar with oil prices will remember that high oil prices were a feature of the 1973 to 1981 period. Also, as China began its growth period, another spike in oil prices took place. High growth in energy supplies and high oil prices seem to go together. High demand from a growing economy tends to hold prices up.
The label "China" refers to the rapid growth that took place in the decade after China joined the World Trade Organization in 2001. This was mostly powered by China's huge growth in coal supply between 2002 and 2011 (Figure 6).
 Figure 6. Production of coal for the World and for China based on data of the 2025 Statistical Review of World Energy, published by the Energy Institute.
China and the world experienced another spurt of increased coal production starting in 2022, when coal prices temporarily spiked to a high level, perhaps indirectly related to the conflict in Ukraine. But coal prices have gradually come back down, resulting in flat world growth in coal production since 2023, and a plateau in China's coal production growth.
(c) Troubled Periods took place when the growth in "Living Standards" was low or negativeFigure 7 labels three periods with very severe dips in "Living Standards."
 Figure 7. This figure is similar to Figure 5, with three "Troubled Periods" labeled. There is also a small section added, extending the analysis to cover the period to 2025.
The First Troubled Period started with the Panic of 1857, which some consider to be a cause of the US Civil War. According to this view, the collapse was related to an over-expansion of the US economy, followed by the collapse of the debt bubble that had allowed this expansion to occur. Financial problems affected both the North and the South.
As I see the situation, one part of this financial problem was the declining profitability of slave labor. In the US South, the labor of slaves was the main source of energy used to operate plantations. An underlying issue was that the soil had gradually become depleted because of many years of growing of cotton and tobacco. These slaves had been purchased with debt; this debt could not be repaid with interest unless the income of the plantations was sufficiently high. However, poor harvests were not offset by sufficiently higher prices, which led to financial problems for plantation owners.
There may also have been an issue that the population, in general, was becoming poorer, essentially because of overpopulation. I say this because studies show that the height of army recruits had fallen, suggesting poorer nutrition. Sanitation had recently been improved, allowing a larger share of babies to survive to maturity. At the same time, immigration into the US continued. With overpopulation, it was difficult to keep incomes up. If farms were divided among many sons, farm sizes would tend to become smaller, leading to lower farm incomes. There would also be greater competition for factory jobs, tending to hold wages down.
Of course, when the Confederacy lost the war, the Confederate Dollar became worthless. For some, this added another financial crisis.
The Second Troubled Period was 1920 to 1940. This is a notoriously bad period, with the Great Depression and World War II included. Arguably, World War I should also be included. Commodity prices of all kinds fell very low. Tariffs were added in the 1920s. The problems seem to have arisen at the time Peak Coal hit-prices could not rise high enough to cover the cost of extracting coal from narrower and deeper seams. In my view, World War I began at the time of Peak Coal in the UK, and World War II took place at the time of Peak Hard Coal in Germany.
 Figure 8. Chart showing coal production from my 2018 presentation.
With depletion, the cost of extracting coal kept rising, but the sales price of coal would not rise to compensate for the higher extraction costs. Instead, wages of miners were increasingly squeezed. Strikes and lockouts became common. Taking a job as a soldier seemed like a reasonable alternative.
There were many events from this period that most people would like to forget, including the currency hyperinflation of the Weimar Republic between 1921 and 1923 and the Holocaust from 1933 and 1945. Country lines were redrawn. Some countries disappeared, and new ones were added. Those holding currencies of countries that disappeared were likely left without funds.
The Third Troubled Period was 1990 to 2000.
A major event of the Third Troubled Period was the collapse of the central government of the Soviet Union, leaving the 15 republics as independent states. The collapse also indirectly affected Cuba, North Korea, and some countries in Eastern Europe that were not part of the 15 independent states. With this change, the demand for fuel of all kinds fell in the countries affected. Factories were closed in many areas, including Ukraine, which was part of the Soviet Union.
 Figure 9. Former Soviet Union energy consumption by fuel, based on data of BP's Statistical Review of World Energy 2018.
The pullback in demand from the collapse of the Soviet Union helped hold oil prices down in the 1991 to 2001 period. Oil prices had previously been brought down by the spike in interest rates in the 1980-1981 period. In my opinion, these low oil prices played a major part in the collapse of the Soviet Union. The Soviet Union, as an oil exporter, needed higher oil prices to invest in developing new fields. In my opinion, the impact of the collapse of the government of the Soviet Union kept world demand (and oil prices) low during the 1991 to 2000 period.
The collapse of the Japanese real estate bubble also took place in this period, as did the 1997 Asian Financial Crisis. Low growth in the world economy, indirectly related to the collapse of the Soviet Union, may have played a role in these financial events.
 Figure 10. Slide from my 2018 presentation.
[3] The world's self-organizing and self-healing economy
From a physics perspective, all economies are dissipative structures. Other examples of dissipative structures include ecosystems in general, all plants and animals, including humans, and hurricanes. One characteristic of dissipative structures is that, at some point in their lives, they tend to grow. Another is that if there is an injury, within a range, the systems tend to be self-healing. For example, a cut on a person's arm will tend to heal; a hurricane going over land will temporarily lose much of its force, but it may increase in force again if it returns over warm water.
Another characteristic of dissipative structures is that they are dependent on having a sufficient energy supply of the right kinds to continue their existence. For humans, the energy supply is food; for an economy, it is a combination of many kinds of energy needed to match the built infrastructure of the economy.
All dissipative structures have finite lifetimes. Ecosystems often come to an end through fires. Humans generally do not live more than 80 or 100 years. Economies also tend to come to an end, either by losing a war or by the collapse of a central government, related to debt problems. The collapse of the Soviet Union involved a debt problem, among other issues. Figure 9 shows the huge drop in demand for energy of all types as its central government collapsed.
There is more stability of dissipative structures than a person might expect. Economists talk about an Invisible Hand being involved. Researchers examining dissipative structures talk about them being "self-organizing." For example, if a fire or a change in climate causes a forest to collapse, it does not take many years for the forest to refill with suitable plants and animals for the somewhat changed situation. If a business or government fails, new, somewhat different businesses or governments are likely to take their place.
I would argue that if the Universe is constantly expanding (so it is an "open system," rather than a "closed system"), what appear to be self-organizing systems may, in fact, be God-organized systems. In other words, instead of creation being a one-time event in the distant past, some type of literal higher power may be involved in a way that makes creation more or less an ongoing event. A person might wonder with the strange confluence of recent events, including the strange weather patterns associated with El Nino, whether today's humans are being warned that a major change in economies will take place soon.
[4] What kinds of things may happen in the near future?(a) Current disturbances in the Middle East and elsewhere are raising long-distance shipping costs for both food and oil. (See this video.) Normally, the price of food and oil must be high enough to satisfy producers and at the same time be low enough to satisfy customers. But now a new layer of costs has been added: the cost of shipping longer routes.
I would argue that because of the problem with low demand (affordability) by consumers, shipping costs must be paid almost entirely through a reduced net oil price available to oil producers and reduced net food prices available to farmers. The amount that consumers can afford doesn't increase because of higher transportation costs.
(b) Furthermore, the use of extra oil for transportation of oil and food will tend to push the overall economy toward contraction because there will be less oil available for other uses, such as to power agricultural machinery and jet airplanes. If the overall economy begins to contract, we can expect dips in oil prices similar to those in 2008 and 2020 (Figure 1). But if recession persists, low oil prices will not reverse themselves as quickly as they did earlier.
(c) I expect home and farm prices will tend to fall around the world. This is related to the low level of demand (affordability problem) in the US and elsewhere. Figure 11, showing median US asking prices for homes, suggests that home prices have been barely holding their own for quite a while. A decrease would not be surprising with all the pressure the economy is now encountering.
 Figure 11. Comparison of US median asking prices for homes from Realtor.com through June 2026.
Farm prices are likely to be under pressure as well, because of the difficulty farmers are having obtaining adequate income from their farms. If farm and home prices fall, there is a substantial chance that the debt bubble holding up these prices will collapse.
(d) There are many other debt bubbles that seem to be waiting to collapse. Some of the debt relating to AI seems to be in a bubble. There is considerable commercial real estate whose value seems to be being held up by "extend and pretend" loans. Collapsing debt bubbles tend to lead to collapsing banks. They also tend to lead to banks less willing to make new loans. Layoffs seem likely. All these things point to a major recession ahead, with less buying power for the population.
(f) Collapses of some top levels of government, similar to the collapse of the central government of the Soviet Union, may be ahead. Such collapses can greatly reduce world energy consumption, including oil, with relatively little violence.
[5] How the nature of the economy may help over the long termAs noted previously, economies seem to have self-healing properties. Troubled periods can last for many years, but there seems to be a substantial chance that a way out will eventually be found.
If a government fails because of excessive debt, a new government (or governments) is likely to take its place. The new government will likely have fewer employees and offer fewer services to citizens. Pensions will likely need to be reduced or eliminated completely.
Even if governments fail, or national boundaries are redrawn, I expect that some businesses will continue operations. Such a situation will take place even if a new currency needs to be created to make this happen. Even in a troubled period, new businesses will start operations. Some of these businesses will make use of recycled materials available from failing businesses.
According to the Maximum Power Principle, if there are resources available that can easily be used, somehow, some organization will develop a way to use them. Over the long term, the economy will likely re-organize itself in a way that is more complex and more sparing in energy use. If energy use is efficient enough, it seems likely that a higher price for that energy supply could be made affordable to consumers. But, such a transition may take many years, if it is possible at all.
There have recently been many warnings about near-term oil shortages stemming from the conflict in Iran. Most analysts assume that shortages mean higher prices. As I will explain, the dynamics of a self-organizing economy suggest the opposite outcome — lower prices, deepening recession, and shortages of goods and services that have little to do with price.
 Figure 1. Wile E. Coyote and Road Runner cartoon showing Wile very surprised after he runs past the edge of the cliff. Source.
Rather than high prices, my major concerns are recession and the disappearing availability of goods and services that we rely on. This might be similar to the empty shelves that many stores experienced in 2020 and 2021. There may also be new government restrictions, intended to work around the reduced oil supply in a way that will allow essential services to continue to operate normally. Oil prices are likely to fall below $40 per barrel, as they did in 2020 with Covid restrictions.
In this post, I will try to explain why this counterintuitive outcome — shortages leading to lower prices rather than higher — is what the self-organizing economy tends to produce. Along the way, I will look at the current state of oil reserves, why the conflict with Iran is unlikely to be quickly resolved, and what the price behavior of oil since February 28 tells us. I will also step back to consider the broader picture: why war can seem like a solution to struggling economies, and what the 2020 Covid experience might teach us about what lies ahead.
[1] Reserves of already-pumped US oil have dropped to concerningly low levels.On June 17, President Trump said, "We will run out of reserves in about four weeks without a deal." According to the article, we are not certain whether Trump intended to apply this statement to US or world emergency reserves.
Also, according to this recent video, the US's largest tank farm seems to be very close to the minimum level at which crude oil can be withdrawn from its tanks. And, on June 23, MSN said, "America may see actual gasoline shortages by July 4."
The already-pumped oil in storage is intended to be used as a buffer if there are variations in supply or demand. The reason that these buffers are falling low is because considerable oil from them has already been used to mitigate the shortfall in crude oil supply to date.
The shortfall in the supply of crude oil supply cannot be expected to disappear quickly. There has been considerable damage to infrastructure in Iran and elsewhere. It will take years rather than months for this to be repaired. In countries where oil production has been shut in, some wells are likely to produce less after being reopened following many months of closure. Furthermore, Iran has no incentive to completely reopen the shipping lanes, since keeping them potentially closed has the potential to raise oil prices per barrel. Higher oil prices would help the finances of Iran.
[2] Perhaps because of concern about low buffer supplies, the US has negotiated a deal with Iran that seems unfavorable to the US.Information keeps coming out that indicates that Trump's current Memorandum of Understanding (MOU) is very favorable to Iran. It looks as if the MOU has been written as if Iran won the war. We are also seeing that other countries have begun acting as if Iran has indeed won the war. For example, on June 23, a joint statement was issued by Iran and Oman. The two countries seem to be co-operating in setting up the collection of funds from ships passing through the strait to cover insurance and other costs.
If we are dealing with a "done-deal," and the US is coming out poorly, the level of conflict within the US is likely to rise. Many people will be angry with Trump for getting the US into the war to begin with. Unfortunately, there is likely close to nothing we can do about this situation.
[3] Trump or another leader cannot restart the war against Iran and expect to do any better.A major problem is that the US has substantially depleted its ammunition supplies, and it will take years to replenish them. While the US could perhaps launch a short attack, it would not be able to carry out a sustained campaign for very long.
Another issue is that the armaments that the US has stocked to date are designed to be used in a different type of war than the one that is being fought today. The US needs drones and close-by locations from which to launch them. Iran damaged most of the US's bases that are close to Iran in the conflict that began on February 28. Without substantial rebuilding, the US has no functioning bases close to Iran from which to launch such drones.
Restocking armaments will likely take several years, especially if new types are needed. Adding to the difficulties of the US is the fact that China has been the primary source of many critical minerals used in the production of high-tech goods and ammunition. In recent years, China has restricted access to these critical elements. The US is now developing mines for some of these minerals, but setting up entire supply chains will take years.
[4] One motivation for attacking Iran might have been to raise oil prices to a higher level.Based on their models, economists typically reach the conclusion that inadequate oil supplies will lead to high oil prices. It is likely that President Trump and his advisors believed that inadequate oil supply would lead to high oil prices.
Some analysts, including me, would argue that the models of economists are very inadequate; they give misleading indications by leaving out the complex self-organizing nature of the economy.
Higher oil prices are sometimes desirable because they encourage more oil extraction. For example, higher prices allow marginal wells to continue to be profitable longer. They can also make a new, higher-cost source, such as tight oil from shale, attractive for drilling. Looking ahead, higher oil prices would make it easier to get oil company support for ramping up oil production in Venezuela.
Figures 2 and 3 show the connection that higher oil prices seem to have had in encouraging tight oil extraction from shale. Figure 2 shows historical oil prices, adjusted for inflation. Noted on this figure is my view of whether prices were high enough to encourage extraction from more difficult locations.
 Figure 2. Figure showing historical average annual inflation-adjusted oil prices, based on data of the 2025 Statistical Review of World Energy, published by the Energy Institute. The 2025 average oil price is estimated based on EIA data. Comments on price levels have been added, as well. An underlying issue is that the price of oil extraction has tended to rise faster than inflation.
Figure 2 indicates that prices started to run up in the 2003 to 2008 era, when China started ramping up its manufacturing, and thus its demand for oil. In this same timeframe, there was also a growing demand for housing in the US, thanks to very liberal underwriting standards for home mortgage loans. Thus, the total demand growth for oil was very high.
Figure 3 shows that production of tight oil started ramping up in 2009, after oil prices had been rising for several years.
 Figure 3. Monthly tight oil production in figure produced by the EIA
Another factor in the growth of tight oil production was the availability of cheap credit after 2008, but this has tended to disappear since 2021. Now, tight oil production seems to be leveling out, leading to rising concerns that tight oil production may soon decline, especially if credit is no longer cheap. Having higher oil prices might help postpone the decline of tight oil.
[5] Oil prices since the war started on February 28 have not bounced very high. Recently, they have tended to fall back, close to their pre-war level. Figure 4. West Texas Intermediate benchmark oil prices, mostly based on EIA data. Most recent points based on Wall Street Journal charts. Amounts through June 26, 2026.
The first thing to note is the fact that the prices on Figure 4 do not reflect the actual prices to the consumer, which have often been greater. The cost of transporting oil has jumped in many markets, but this higher transport cost is not reflected in the "West Texas Intermediate" price of oil, displayed in this chart. These higher prices at the pump have led some of the more price-sensitive buyers of oil products to cut back on their purchases.
Second, there is a lag issue regarding how soon the impact of missing supply actually hits the market. The slow transit time of oil from the Middle East to markets means that the actual disruption of supplies did not hit until at least 50 days later. If crude oil first needs to be processed by local refineries and then the oil products shipped to customers, the lag would be even greater-perhaps 75 or 100 days in total. Thus, much of the price increase to date may be based on a fear of shortages, rather than on an actual shortage issue.
Third, there have been some changes that impact oil "demand." Some consumers have been told by their governments to work from home or otherwise restrict their driving to save on oil consumption. Also, some flight schedules have been cut back. Recently, Ukraine has been targeting some of the oil infrastructure of Russia, leading to reduced gasoline and diesel availability within that country. All these issues have tended to reduce the demand for oil. The lower demand acts to hold down oil prices.
A fourth issue has to do with worldwide economic conditions before February 28. Even before the war, much of the world was in close to a recessionary situation. There were very many low wage earners who could not afford much beyond the basic necessities of life. Even a small run-up in oil prices tends to affect food prices because oil is often used in farming operations and food is usually transported to market using oil. With higher food prices, poor consumers were forced to cut back on other purchases. This recessionary dynamic can be expected to get worse if oil prices inch up even a bit.
[6] I expect that oil prices will continue to remain relatively low, or they will only briefly rise to high ($150+) levels, even if there are actual oil supply disruptions.I expect that the dynamics we have been seeing since February 28 will continue, and may intensify. Governments will add new restrictions that will reduce oil use. Airlines will go bankrupt, or they will reduce flight schedules. Recession will become even more of a problem. These issues will tend to reduce usage without raising prices.
[7] What we may see more of is broken supply chains.There will be more signs in grocery stores and in home product stores saying, "This product is temporarily unavailable." Car repair shops may tell us that a required replacement part will not be available for several months. Physicians may tell us that a medicine or chemotherapy drug that they normally use is, at this time, unavailable.
[8] The operation of the economy depends on an adequate supply of many kinds of energy. If oil supply is reduced, an economy needs to shrink to a smaller size to match. This is what leads to recession.One reason for the above observation is that we know that our own vehicles will not operate without whatever fuel they are designed for. This is clearly also true for all the delivery trucks in the world, and for farm machinery and for ships that transport goods across the ocean. With less fuel, fewer trips of many kinds will be made. Workers will be laid off. This dynamic sounds a lot like recession.
The expected lower world oil supply in the near future is not an issue that can easily be resolved. We are already seeing that even with a supposed settlement, disruption in oil supplies seems likely to continue and even to worsen, as the various limits on buffer supplies are reached. Unfortunately, we cannot expect the situation to be completely fixed for several years.
Furthermore, the economy is facing even more disruptions than I have outlined above. For instance, Ukraine has been disrupting Russia's oil infrastructure with drone attacks. There have also been disruptions to sulfur exports from the Middle East. Sulfur is used in many ways, including as a fertilizer and in the production of sulfuric acid, which is used in the mining of uranium, among other things. In addition, there have been disruptions to liquefied natural gas (LNG) exports from Qatar. The lack of these important products will tend to further damage supply chains and lead the economy deeper into recession.
[9] We are ultimately dealing with multiple not-enough-to-go-around scenarios. This situation will tend to increase conflict in the world.The dynamic we are dealing with is similar to that in the game of Musical Chairs.
 Figure 5. Chairs arranged for Musical Chairs Source: Fund Raising Auctioneer
The game of musical chairs is played in rounds. Players walk around the edge of a circle of chairs while music is played. When the music starts, the number of players is equal to the number of chairs. In each round, one chair is removed. The music plays and then suddenly stops. The players must then scramble to grab a chair. Since the number of chairs is now one fewer than the number of players, small fights can ensue.
The problem is basically, "Not enough to go around." War often sounds like a reasonable solution to leaders.
[10] War can seem like a solution.Strangely enough, war has multiple advantages to economies that are suffering from difficulties related to low commodity prices and, indirectly, low wages in related industries. One commodity is food. If food prices are too low, farmers will be unhappy that their earnings are low. They may stop farming and try to make a living from putting their land into a land bank and working elsewhere.
If oil prices are low, the oil industry can experience pockets of low wages. There have recently been reports of lockouts and strikes in the oil industry. I would expect these labor actions to be most prevalent where oil fields are depleted.
If a government announces a war, it looks like the government is "doing something" about the country's problems. There is suddenly employment, either as a soldier, or in building armaments. GDP tends to rise because the war leads to a larger share of the population working. The war can be used to justify the additional government debt needed to hire the additional workers. What convinced me of this relationship was this chart, showing a huge increase in US GDP during World War II:
 Figure 6. Three-year average increases in US inflation-adjusted GDP, based on data from the US Bureau of Economic Analysis. The last point is 2025.
Looking closely at the chart, it is also possible to see GDP increases during the Korean War (1950-1953) and between the time the US entered the Vietnam War, deploying up to 549,000 soldiers, and the time the US greatly reduced its forces there (1964-1969).
I think much of Europe is now in a situation in which war looks like a solution. Russia may also be in such a situation. Ukraine, with its problems, is also in such a situation.
[11] There may be lessons to be learned from the 2020 Covid restrictions and the ultra-low oil prices that resulted then.Back in 2019, many people in the financial world were concerned about the economy. In 2019, the US faced significant financial issues, including a budget deficit that increased by $205.4 billion to $984.4 billion. In addition, in September 2019, there was a spike in the interest rates financial institutions charge each other (repo rates) that concerned those who followed financial markets closely.
What took place in 2020 seemed to some of us to be close to miraculous. The strange actions related to Covid greatly brought down the price of oil. Covid also provided an excuse to give money to households. US government debt was able to increase greatly, and, somehow, the world economic system has held together until now. Financial problems were "kicked down the road" a while longer. Without the pressure of financial problems, the economy could work on ways to mitigate the energy problem a while longer.
Economies are self-organizing systems, just as the human body is a self-organizing system. Both are powered by "energy dissipation." Human bodies tend to heal wounds, like magic. Economists talk about an "invisible hand" being helpful to economies. In situations where the healing of economies does occur, low oil prices can be part of the magic.
[12] What might be ahead?We are again in a period when the US and world economies are on shaky ground. Debt levels are high, and conflict levels are high.
As I have discussed in this post, I expect the general trend in oil prices will be down, rather than up. The major reason why oil prices are likely to be low is because, with the damage done in the Middle East, the quantity of oil supply available to the world is starting to shrink. As a result of the low oil quantity, the world will produce fewer goods and services. This is close to the definition of recession! (Also, on Figure 1, this is why we expect Wile E. Coyote to fall down, rather than to float up, when his support disappears.)
I expect as oil product shortages hit, local leaders will figure out ways to mitigate the oil bottleneck that the world now seems to be facing. Local leaders will enact rules that make certain that whatever oil is available is used to maintain essential services. It will not be surprising if local leaders keep people at home, using one excuse or another, to keep oil demand in line with the quantity of oil that is available. This is a big part of why oil prices will tend to be low, in a manner similar to 2020.
With low oil prices, I expect that inflation will be low. Pressure to keep raising interest rates will disappear. The economy will not be doing well, but the issue will not be high interest rates preventing new investment.
In my opinion, the world economy needs to reorganize with shorter supply lines to get through the oil "tight spot" that the economy is in. If supply lines could mostly be kept within the areas marked on Figure 7, it seems like a significant amount of transport fuel could be saved.
Figure 7. Map showing world divided into two areas of influence. In my opinion, supply lines need to increasingly come from within the same hemisphere. Areas marked in yellow represent my idea of future centers of trade.
The conflict with Iran doesn't seem to be ending well for the US, but there might be a silver lining. The pain the US is experiencing in Iran will hopefully teach the US to stay out of issues in the Eastern Hemisphere. If a conflict with Iran is to ramp up again in the near future, I expect that it will be a European group that will be getting involved, not the US.
We don't know quite what is ahead, but the experience in 2020 shows that a strange confluence of events leading to low oil prices can actually be helpful. Let us hope that a similar result will be possible this time.
The war with Iran is not going well. It is difficult to supply US troops with adequate food and other necessities. With summer arriving soon, the region will soon be an even more inhospitable place for ground troops to fight. An underlying problem is that the world economy was reaching resource limits even before the Iran War began, adding to the difficulties.
The most pressing resource limit is distillate fuel oil-an industry term for what we think of as diesel and jet fuel. This fuel is heavily used in transportation. It is also used extensively in agriculture and industry. Somehow, the system needs to cut back on these fuels for international trade so that more fuel is available for agriculture and industry.
President Trump of the US and President Xi of China will be meeting in Beijing on May 14-15. This meeting would seem to be the perfect time to start reorganizing the world with shorter trade routes, so that the world economy uses less fuel for transportation. China and the US are the two great powers in the world. Keeping trade mostly within the two areas shown in Figure 1 would be a way of using fuel oil more sparingly.
Figure 1. Map of the world showing how Gail Tverberg expects Presidents Xi and Trump might split most world trade. The vast majority of trade would take place within the two areas shown. Within these groupings, the centers of trade might be the yellow areas shown.
An advantage of such a plan, besides saving on fuel, is that it could stop the Iran War without clearly declaring one side the winner or loser. In this post, I will attempt to explain the situation further.
[1] Based on the ideas of Dr. Mohammed Marandi, I believe that China might be able to mediate a settlement between the US and Iran.Dr. Marandi was born in the United States of Iranian parents. He currently lives in Iran, where he is a professor at the University of Tehran. In the video, One Country Quietly Won this War, he points out that, often, when two countries battle each other, neither one emerges as the clear winner. Both of them are damaged by the war. The actual winner may be a country that does not seem to be directly involved in the war.
In the video referenced above, Dr. Marandi discusses three historical situations in which a nation not directly involved in a conflict gained stature by being the "adult in the room," when two other nations battled each other. In this case, Dr. Marandi believes that China could very well be the country that can exert enough pressure on both sides to get them to accept a proposed solution. He says that China has acted behind the scenes to bring about the ceasefire, and that Trump has acknowledged China's role.
Dr. Marandi suggests the idea that the upcoming meeting of the two presidents might be an opportune moment to make major steps toward a mutually agreed settlement. I believe that the underlying problem is that there isn't enough energy (particularly oil) to support a world population of over eight billion. Dividing up markets in the way I have suggested would at least somewhat alleviate the shortage. Of course, there may be other terms of a settlement, as well. In addition, not all the terms may be determined precisely at this time.
[2] The world doesn't have enough diesel and jet fuel to maintain the current level of trade across the Atlantic and Pacific Oceans. Figure 2. Combined diesel and jet fuel supply, divided by world population, based on data of the 2025 Statistical Review of World Energy, published by the Energy Institute.
Figure 2 shows that per capita diesel and jet fuel started to drop at the time of the Great Financial Crisis in 2007-2009. Their supply took a larger step down in 2020, and it hasn't completely recovered. In 2026, the Iran War has taken out more crude oil supply, for an unknown period of time.
Diesel and jet fuel are both very important as transportation fuels. Diesel is also important in agriculture because it provides the power needed for heavy machinery to till fields, even under the most adverse conditions. Diesel provides the power needed for large commercial trucks, many trains, and ships. Earth moving equipment is also typically operated by diesel fuel.
If the amount of trade across the Atlantic and Pacific could be greatly reduced, it would help alleviate the shortage of distillates. Of course, the tourist trade would also need to be greatly reduced. With recent spikes in aviation fuel prices, many flights are being cut. Some airlines, including Spirit Airlines in the US, are going bankrupt. The problem is starting to solve itself, but more changes will be needed.
[3] Looking at population and oil supplies, the Americas seems likely to come out somewhat ahead. [3a] Comparing the populations of the two areas, the World ex Americas is much larger, and its population is growing faster. Figure 3. World population between the Americas and the world excluding the Americas, based on data of the 2025 Statistical Review of World Energy, published by the Energy Institute.
President Xi (leading one hemisphere) would get the very large and still rapidly growing part of the world population. President Trump would get a smaller and less rapidly growing share of the world population. Between 2021 and 2024, world population grew an average of 0.6% per year in the Americas, and an average of 0.9% per year in the World ex Americas.
[3b] The Americas seem to have an advantage with respect to crude oil production. Figure 4. Crude oil production per capita, based on data of the US Energy Information Administration.
It makes sense to look at energy amounts on a per-capita basis because the quantity needed depends on the number of people requiring the benefits of transportation, agriculture, and industry. On this basis, crude oil production of the Americas has clearly been outshining that of the World ex Americas. It is higher on a per-capita basis. In addition, the amount available has been increasing in recent years.
Figure 5, below, shows total crude oil production (not per capita).
 Figure 5. Crude oil production of the Americas compared to that of the World ex Americas, based on data of the US Energy Information Administration.
Figure 5 suggests that since 2005, crude oil production for the World ex Americas has hardly increased. In fact, total extraction has decreased since 2019. A person viewing this data might conclude that crude oil production in this area may already be past its peak.
On the other hand, Figure 5 shows that oil production of the Americas has increased by about 65% since 2005. Many people believe that US shale production will soon decline. At the same time, however, increases seem likely in several other countries in the Americas, including Canada, Brazil, Argentina, and Guyana. Thus, while crude oil production for the Americas may decline in the near future, its decline is likely to be gradual.
[3c] Crude oil production by geographical area outside of the Americas shows declining production in all areas. Figure 6. Crude oil production by geographical area for the World ex Americas, based on data from the US Energy Information Administration. Russia+ refers to Russia plus nearby countries that used to be part of the Soviet Union.
Figure 6 shows that Europe's crude oil production started its permanent decline in 2001. Asia-Pacific's production hit a maximum in 2010, and it has been declining since. Africa's peak oil production took place in 2008, and it has been mostly declining since.
Russia+, which I use to refer to Russia plus nearby countries that used to be part of the Soviet Union, has an unusual production pattern. Its crude oil production started to decline in 1989, two years before the collapse of the Soviet Union in 1991. (This collapse in crude oil production likely contributed to the collapse of the Soviet Union.) Crude oil production for Russia+ rose from 1998 to 2019.
Russia+'s production took a big step down in 2020, and it has not been able to recover since. A person might think that Russia+'s oil production was post peak, even before the 2022 conflict with Ukraine broke out. If an oil exporter doesn't have enough oil to export, it tends to create financial problems within an economy. Participating in a war can appear to mitigate the country's problems.
Many people assume that the Middle East has endless inexpensive-to-produce crude oil. I don't think that this is the case. Crude oil production of the Middle East (Figure 6 above) hit two similar peaks in 2016 and 2018, and it has been lower in years since then. I think that Middle Eastern oil production is likely past peak partly because of depletion issues and partly because most countries in the area require high taxes on oil exports to provide subsidies for their ever-growing populations. This leads OPEC to try to maintain high prices. Lower crude oil production since 2018 is consistent with the hypothesis that oil production for the Middle East is mostly post-peak.
One additional difficulty of the World ex Americas is that it is so heavily populated that it cannot access tight oil that might be available without displacing a large number of residents. Another difficulty is that very old wells, such as those in Saudi Arabia and Iran, are ones that it might not be possible to restart if they are shut in for an extended time.
[4] In terms of mining and manufacturing, the Americas seems to come out behind the World ex Americas.The World ex Americas has rapidly ramped up mining and manufacturing. Coal has been the preferred industrial fuel, with natural gas consumption also increasing.
 Figure 7. Energy consumption by type for World ex Americas, based on data of the 2025 Statistical Review of World Energy, based on data of the Energy Institute. Fossil fuel extenders include hydroelectric power, nuclear power, wind power, solar power, biofuels including ethanol, and any other types of add-ons to fossil fuels.
Figure 7 shows that the energy consumption of the World ex Americas started increasing more rapidly after China joined the World Trade Organization in 2001. The consumption of coal and natural gas has especially increased.
 Figure 8. Energy consumption by type for the Americas, based on data of the 2025 Statistical Review of World Energy, based on data of the Energy Institute.
The economies of the Americas have tended to shift towards service economies. Emphasis has been placed on fuel efficiency. Homes are now better insulated, light bulbs are more efficient, and engines of vehicles are more efficient. As a result, energy consumption within the Americas has tended to stay flat (Figure 8).
I have used the same scale on Figure 8 as on Figure 7 to emphasize how low energy consumption for the Americas is now, relative to the rest of the world. After US oil prices first rose to a high level in 1973, the US started transferring manufacturing to lower-wage countries. Southeast Asian countries began to be favored after 2001. Moving manufacturing abroad helped hold down US energy consumption and helped make the cost of goods to the consumer cheaper.
The problem today is that moving so much manufacturing elsewhere has made it difficult for the Americas to go back to producing its own goods, including clothing, furniture, and transformers for electrical systems. Supply lines for a particular item, such as a refrigerator, often run through many countries around the world.
[5] The full transition to the configuration shown on Figure 1 could take well over 100 years.Changes, such as new supply lines and the new placement of major population areas, cannot happen very quickly. But I expect that some of the same underlying principles that guided these decisions in the past will continue to guide them in the future.
For example, infrastructure (roads, bridges, pipelines, and (today) long distance electricity transmission lines) seems to be the most difficult part of an economy to maintain because of the huge amount of energy required. Before the days of fossil fuels, I understand that slave labor was often used to build and maintain infrastructure. Similarly, slave labor was sometimes used to staff the mines needed to support the building of such infrastructure. As we lose fossil fuels, we will need to think about reducing our reliance on infrastructure.
One low-infrastructure approach used in the past was to build cities near bodies of water, so that fewer roads would be needed. Boats could be used to transport goods without building roads or bridges. If fish were available, they could be caught and used for food. In Figure 1, I am imagining that we will head back in this direction, with cities especially along navigable bodies of water and the ocean.
Unless we discover ways to replace fossil fuel energy, I would expect that the system will tend to go down in the reverse order of when it was put up. In general, electricity was last to be added, after coal, oil, and gas from coal. Electrification was first built in cities; then electricity transmission lines were added to provide electricity to rural areas. Above-ground lines tend to be damaged in storms, leading to a need for frequent repairs. Because of this issue, I would expect rural electricity to disappear quite quickly, unless it is generated at the location where it is used.
Natural gas shipped as Liquefied Natural Gas (LNG) was added very late. Its cost tends to be much higher than that of pipeline gas. I expect it to disappear quite quickly.
A full transition to the two trading zones shown on Figure 1 would require a huge number of changes in supply lines. A 2025 chart by Visual Capitalist shows how much control China has over critical minerals. It states, "China controls key materials such as graphite, rare earths, and gallium-essential for green technologies and defense industries." While the US has started working on its own production of minerals, it will also need to develop the processing capability for these minerals. Putting all of this in place will likely take many decades. This is a significant factor in the 100-year estimate.
[6] If energy supplies are limited, I would expect population centers closest to fuel sources to be especially favored.Writers today talk about possibly running short of diesel and jet fuel in a few weeks or months. Clearly, if a population center is at a location where there are both oil wells and refineries for the oil from those wells, the area has a better chance of having fuel than an island in the middle of the Pacific with nothing to sell other than tourism. Thus, Houston, Texas, will likely have fuel, even when models suggest there will be shortfalls in many places.
Often writers concerned about resource shortages talk about the core and the periphery. The core needs to be near whatever source of energy is available that can be used to help grow crops and transport goods. At this point, oil is the fuel that is closest to filling this need. Electricity is a nice-to-have, and it can provide services like refrigeration for food. But it is not good for paving roads or building bridges. So, it can only add to the mix, not substitute completely for oil. Slave labor is the closest substitute for oil that the world has discovered. We would rather not go back to using such an approach.
[7] I am concerned that a major downward economic step will be necessary in the upcoming months and years, but I am hopeful that the meeting between President Trump and President Xi on May 14-15 can help smooth the way.We are at a point at which it is clear that the current organization of the global economy is not working. I hope that the meeting between Trump and Xi will help put an end to fighting in the Middle East. I also hope it will help pave the way for a new path forward.
I expect that the path ahead will be a difficult one, both for the people in the Americas and the people in the World ex Americas. While the US has considerable energy supplies, it lacks manufacturing capability for many everyday goods. The US is also lacking in many critical minerals, especially those used in making high-tech products. With its high wages, it will need extremely high prices, unless processes can be made very efficient.
The World ex Americas may have an even more difficult step down. Its oil supply was already more stretched before the Iran War. Its overpopulation problem seems to be worse than that of the Americas. The World ex Americas is more directly affected by the damage done in the Middle East and the resulting loss of oil supply. And there seem to be many groups looking for war, even if the US leaves.
Let's all keep our fingers crossed that the upcoming meeting will have a beneficial effect, both in the short term and in working toward a longer-term solution.
As I will explain, the outcome that looks like losing may actually be the best path forward for the world's remaining economies.
The fighting today is with respect to which parts of the world will get which energy resources, and at what prices. Even before the current conflict, there was a shortage of jet fuel and diesel. The only reasonable outcome I can think of is that the US will only be able to tap its own energy resources, plus those of its nearby neighbors (Figure 1). Consequently, the economy will gradually reorganize in ways that use fuels more sparingly.
 Figure 1. A chart I made when trying to explain that it is really the heavy oil portion of oil, which disproportionately makes diesel and jet fuel, that is especially constrained. Reducing travel across the Atlantic and Pacific Oceans would leave more heavy oil for other purposes, such as growing food.
The outcome outlined in Figure 1 implies that Donald Trump and the US-Israel coalition will lose the war against Iran. It appears that the physics of the situation (or perhaps the Higher Power behind the physics of the situation) has chosen the flawed personality of Donald Trump to accomplish the required result. This is a situation where what seems to be the US losing in its conflict against Iran is actually winning for the overall world economy. If oil can be used more sparingly in the future by servicing people closer to where end products are made, the available energy resources will provide greater benefit to society as a whole.
In the remainder of this article, I will try to explain the situation more fully.
[1] BackgroundIn physics terms, an economy is a dissipative structure. In order to stay away from a dead state (collapse), it needs to "dissipate" energy of the right kinds. A human is also a dissipative structure. We dissipate food to stay away from a dead state.
From a physics point of view, fossil fuels are as essential to economies as food is to humans. Without fossil fuels, economies tend to collapse and die. With an adequate supply of easily extractable and transportable fossil fuels, economies are able to grow. However, when these fuels become less available due to the exhaustion of nearby resources, or for other reasons, economies are forced to shrink. Rising population can also be a factor because every person in the world needs food and at least minimal transportation. The war is about future standards of living in countries around the world.
An underlying problem is that the world now has too many people for the available resources, such as fresh water. One chart showing data through the end of 2023 indicates that the Middle East is home to 4,863 desalination plants, or about 42% of the world's total. This region is acutely stressed for fresh water. The Middle East cannot grow much of its own food; it must depend on imports, which are grown and transported using oil.
Previous analyses (here and here) have shown that diesel and jet fuel supplies have been in increasingly short supply since long before the Iran War.
 Figure 2. World per capita diesel supply, based on data of the 2025 Statistical Review of World Energy, published by the Energy Institute.
Critical minerals, used in electrification, are also in very short supply. In a finite world, the easy-to-extract minerals are extracted first, leaving the high-cost-to extract minerals for the future.
In today's fossil fuel economy, oil is the largest component. Oil is usually the highest-priced of the fossil fuels because it is energy-dense and easy to transport and store. If oil supply fails, an economy is likely to collapse. Coal and natural gas are the other fossil fuels. Liquefied natural gas (LNG) is natural gas that is super-chilled and shipped long-distance by boat. Similarly to oil, its price is under pressure today.
[2] The world's fossil fuel economy already seems to be at a turning point in its economic cycle.It is well known that economies exhibit cyclical behavior. Researchers Peter Turchin and Sergey Nefedov analyzed eight economies that collapsed and published their findings in their book Secular Cycles. They found that populations that discovered new resources were able to grow for a period of time until they came close to the carrying capacity of the resources available. After approaching the carrying capacity, economies reached a period of stagflation, characterized by slower growth, inflation, and spiking prices as shown on Figure 3.
 Figure 3. Chart by author based on information provided in Turchin and Nefedov's book, Secular Cycles
At this point, the fossil fuel system has been growing for over 200 years. It has undergone stagflation since the early 1970s. It is now ready to begin the downswing of the Crisis Years.
Now, the Iran War seems to mark the beginning of a fairly long Crisis Period. The Stagflation Period was expected to last 50 to 60 years. The year 2026 is 56 years after the time US crude oil production stopped growing, so the timing is roughly in line with expectations. However, we don't know whether the Crisis Period will really last between 20 and 50 years, since the situation is now quite different compared to cycles before fossil fuels were added to the economy. But it does look like the world economy is headed for reorganization based on the limited fuel supply.
[3] In order for an economy to "work," oil prices need to be both low enough for consumers, buying end products such as food made possible by the use of oil, and high enough for oil producers.This issue is not one most people think much about. There are really two different oil price levels that are important:
(a) The price level affordable by consumers. If consumers cannot afford food or basic transportation, this quickly becomes a problem that leads to unhappiness with elected officials. This is the reason why elected officials often try to hold down oil prices.
(b) The price that oil producers require in order to make an adequate profit and allow investment in new wells to offset depletion in existing wells. In the case of oil exporters, oil prices may need to be very high to permit high taxes on oil exports to support food subsidies and other government programs.
I believe that a major problem we have reached today is that countries that are primarily oil exporters, such as Russia and countries in the Middle East, need far higher oil prices than consumers are able to pay. Even if the wars in Ukraine and Iran stopped tomorrow, the world would still have this underlying issue.
[4] Since 2014, oil prices have been too low for countries that use taxes on oil exports as a major source of tax revenue.
Figure 4. Oil prices in 2025 US$, with ovals marking three different oil price periods. Oil prices are based on oil data from the 2025 Statistical Review of World Energy, published by the Energy Institute, adjusted by the US CPI Urban increase to 2025 levels. The 2025 average Brent oil price is from EIA data.
Figure 4 shows average world oil prices on an inflation-adjusted basis, to 2025 price levels. As such, prices for earlier dates appear much higher on the graph than past observers would have seen them.
The low oil prices from 1948 until early 1973 were good for economies around the world, including the US. In the early days of oil extraction, oil was easy to extract and close to where it was to be used. The cost of extraction and transport was low. Consumers started seeing many more products become available. Many families in the US could afford a car for the first time. Also, the US was able to support the recovery of European economies from the impact of World War II at a cost that was not excessive.
In recent years, costs have risen. This is especially the case for the price needed by oil exporters. Part of the problem is that the size of the population requiring subsidy keeps growing, while oil production has been close to flat.
 Figure 5. Crude oil production of the Middle East and population based on data from the 2025 Statistical Review of World Energy, published by the Energy Institute.
A second part of the problem is that economies of oil exporters often have few other sources of taxable revenue. Oil exporters are trying to change this by adding downstream manufacturing that uses the oil and gas they produce. A third part of the problem is that, as population grows, the higher population tends to use more of the available oil supply, leaving less for export.
Figure 6 shows that, in the 2011-2013 period, oil prices seemed to be high enough for most OPEC members (except Iran). Fiscal break-even prices indicate how high oil prices need to be, including the amount of tax revenue needed to balance budgets.
 Figure 6. OPEC Fiscal Breakeven prices, published by APICORP in approximately 2013.
The notation in yellow on Figure 6 shows that the expected fiscal breakeven break-even for the period under analysis for all OPEC members combined was $105. EIA data shows that the average Brent oil prices during this period were $111 in the year 2011, $112 in the year 2012, and $109 in 2013. Thus, prices were high enough for most producers. Iran was an outlier on the high side, with a range for the 2013-2014 period of $110 to $172. (A more recent forecast for Iran shows a 2025 fiscal breakeven price of $124, which remains far above the pre-Iran war oil price.)
Figure 4 shows that oil prices began to fall in 2014. At these lower levels, it became increasingly difficult for oil exporters to obtain enough tax revenue to significantly help their local populations. They started needing to use more debt to fund their local economies. As a result, they gradually became increasingly unhappy. Figure 4 shows that the average price 2025 for Brent oil was only $65.
To make matters worse for oil exporting countries requiring high prices, oil price forecasts by the EIA and IEA for the year 2026 were even lower because of an expected oversupply of oil. Countries with growing oil production included Argentina, Brazil, China, and Guyana. In addition, some counties on the coast of Africa are hoping to add oil production. Unless world demand is growing rapidly, more oil supply tends to lead to lower prices and a worse situation for oil exporters trying to balance their budgets with taxes on exported oil.
[5] Without the war, LNG prices would also have been too low for LNG exporters.LNG is a "modern" way of shipping natural gas. Only about 13% of natural gas is transported as LNG. It tends to be an expensive method of transport. Recent reports indicate that a huge amount of future LNG supply is planned for the next few years.
 Figure 7. From "Will QatarEnergy's LNG Fiasco Derail Goldman's Prewar View Of A Mega LNG Wave." Source.
Adding a huge amount of LNG would probably cause prices to drop significantly. This would be great from the point of view of consumers, but it would likely leave prices too low for producers. As I see the situation, Middle Eastern producers are likely to need prices in the $15 to $20 range per million metric tons of LNG, while India is not willing to pay more than $10 per unit, and those wanting to replace coal are unwilling to pay more than $5 per unit. Thus, without the war, LNG would have had a similar problem to that of oil, with prices far too low for exporters.
[6] From Iran's point of view, I see the war as similar to a suicide, when a farmer can no longer support his family.With Iran's fiscal breakeven price at $124 per barrel and the pre-war Brent price at only $65, Iran was already in an impossible position. In fact, Iran could see that all of the Middle East infrastructure would be close to worthless, at expected 2026 oil and LNG prices. So why not take it down as well?
If nothing else, a war might help raise prices, at least a bit. Notice that on Figure 4, oil prices bounced up a little from their very low level in 2022, the year when the Ukraine conflict started.
[7] Losing any significant share of energy supply is likely to significantly reduce world GDP.If the energy supply were to be lost, the world would be dealing with the losing something equivalent to its food supply. If the world economy loses even 10% of its oil and LNG, it is not difficult to imagine world GDP falling by 10%. At this point, we don't know precisely how much energy supply, of which kind, will be lost, or for how long. The amount lost could be far higher than 10%. Also, the outage could last for years.
There are many issues involved. Supply lines are breaking down forcing businesses to find closer sources for both energy products and products made using cheap local energy products, such as fertilizer and aluminum. The war, as it is taking place today, is leading to major damage to energy-related structures in the Middle East. Destroyed LNG structures are estimated to take at least five years to replace. Damage elsewhere is also immense. Rebuilding the oil infrastructure will also likely take at least five years.
[8] The US understands the importance of Middle Eastern oil and gas. It uses its strong relationship with Israel to further its military presence in the Middle East.Israel is a very high-level ally. In fact, a 2025 US Department of State Fact Sheet says that the US is committed to helping Israel in the case of an attack:
Steadfast support for Israel's security has been a cornerstone of American foreign policy for every U.S. Administration since the presidency of Harry S. Truman. . . Israel is the leading global recipient of Title 22 U.S. security assistance under the Foreign Military Financing (FMF) program. . .Israel has been designated as a U.S. Major Non-NATO Ally under U.S. law. This status provides foreign partners with certain benefits in the areas of defense trade and security cooperation and is a powerful symbol of their close relationship with the United States. Consistent with statutory requirements, it is the policy of the United States to help Israel preserve its QME, or its ability to counter and defeat any credible conventional military threat from any individual state or possible coalition of states or from non-state actors, while sustaining minimal damages and casualties.
However, if we look to see where US military bases are located, they are not in Israel. Instead, a map shows that the "persistent" US military bases are all located around the Persian Gulf (Figure 8).
 Figure 8. Figure shown by Congress.Gov of US bases in the Middle East, as of July 10, 2024. Source.
These bases were clearly intended to protect oil transiting through the Persian Gulf. At this point, all of the persistent bases have been severely damaged by missiles from Iran.
The major interest of the US has been the availability of oil and natural gas from the Middle East. No one ever considered the idea that low prices might be the force that would bring down Middle Eastern oil and natural gas exports.
Friendship with Israel provides the US a convenient close by ally. It also pleases both Jewish Americans who support Israel and those evangelical Christians who hold a religious view that Israel is needed for the second coming of Christ. Some of the latter may even believe that a war in the Middle East could perhaps hasten this event.
[9] Trump realizes that winning the war against Iran is absolutely essential if the US is to retain global hegemony.The US has been the holder of the world's reserve currency since immediately after World War II. It was chosen for this role because it was the most trusted and dominant country in the world. International trade took place almost exclusively in US dollars, creating a high demand for US government debt. This allowed the US to import more goods and services than it exported, year after year. This advantage tended to raise the standard of living of US residents.
At one time, Saudi Arabia insisted that all oil purchases be made in US dollars. This requirement has recently expired, but, as a practical matter, the majority of purchases have continued to be through trades in US dollars.
One of the main ways that the US has maintained its hegemony is by building military bases around the world. With these bases, the US can claim to protect countries against aggressors. However, recent events have shown that Iran is able to take down the radar systems at these bases. Without radar, the bases are virtually useless. If the US is to maintain the illusion that it is truly at the top of the pecking order with its sophisticated weaponry, it must show that, together with Israel, it can prevail against Iran.
A disadvantage of the role of being the chief hegemon is ever-rising US government debt and the need to pay interest on that debt. This growing debt and the interest on the debt has become an increasing burden.
If the US should lose its hegemony role, the advantage the US has had over other countries in trade is likely to disappear. Repaying debt with interest is likely to become an even worse problem. If this should happen, Trump will no longer be able to think about making America great again.
[10] ConclusionThe world is now facing a problem that most people never considered possible: Oil and LNG prices can fall so low that production becomes unprofitable for major oil and LNG exporters. Until now, the trend among world leaders, including President Trump, has been to try to hold prices down for consumers, so that food and fuel for vehicles would remain affordable. However, this has created a problem in that prices have become too low for countries whose primary industry is being an oil exporter.
At this point, the world economy needs to make a major transition in order to deal with the inadequate level of fuels available for long-distance transportation. These same fuels are heavily used for farming and for many for commercial endeavors, such as building homes and roads. It is therefore necessary to find ways to use these fuels more sparingly. One way to achieve this is by reducing the length of most supply lines, as shown on Figure 1. Shorter supply lines will also be needed elsewhere in the world.
It is ironic that the world economy cannot make a change such as this without a war to focus our attention in this direction. Other changes will also be needed. Governments will probably have to become smaller and provide fewer services. Vacation travel will become the exception rather than the rule. "Working from home" will become the norm, whenever possible. I expect that the world's population will need to fall, albeit in a fairly subtle way. I expect this will mostly be the result of shorter life expectancies.
We are fortunate that economies are self-organizing. If resources are available, even after a major schism such as the loss of the war against Iran, the self-organizing nature of the economic system will try to knit together pieces that can productively provide goods and services. This cannot happen instantly, but this feature means that there are likely to be some jobs and some goods and services available. Past cycles of the type illustrated in Figure 3 have eventually led to new beginnings.
If the US and Israel lose the current war against Iran, I expect President Trump to be blamed for this loss. However, I believe that this outcome would be best for the world as a whole.
A few years ago, I analyzed the growth of world energy consumption, breaking it down into (a) the growth in energy consumption needed to support the growth in world population, and (b) the growth in energy consumption available to support higher standards of living. This analysis covered the period 1820 to 2020. I found that periods of low growth tended to coincide with wars, depressions, and collapses. This is not surprising in a world economy governed by the laws of physics. Every part of the economy requires adequate energy of appropriate kinds.
 Figure 1. Chart from 2021, showing average annual growth in world energy consumption for 10-year periods. These increases were divided into the portion needed to cover the population increase, and the remaining amount available to support an increase in living standards.
In this post, I analyze data for 5-year periods, ending in 2024, to obtain an updated view of recent energy consumption and population trends. My conclusion is that total energy consumption growth in recent years has not been sufficient to forestall major problems. A more detailed analysis reveals that growth in certain vital resources (the diesel+jet fuel part of oil supply, and critical minerals related to electricity production and usage) is particularly problematic.
These findings indicate that the economy is already beginning to hit energy limits. Because of energy-related shortages that are already being encountered, national economies are beginning to act like the players in a game of musical chairs, with one too few chairs. Leaders have taken to building up armies, cutting off exports of critical minerals, imposing tariffs, and bombing other countries, even though these actions might not make sense to peace-loving citizens.
[1] Figure 2 is a stacked bar chart showing similar indications to Figure 1. Figure 2. Average worldwide growth in energy consumption, divided into two segments: (a) the portion needed to provide for existing population at the current standard of living, and (2) the portion available to support growth in worldwide living standards. This chart displays the same data as Figure 1, differently.
The total of the red and blue segments is the average annual increase in world energy consumption over a particular 10-year period. The blue amounts (usually at the bottom) are those necessary to provide services at the same level as in the past, given the population increase. The red amounts (usually at the top) are determined by subtraction. Large red caps are good, while red caps below the zero line are very bad. They indicate that the per-capita energy supply is declining.
[2] The largest increases in Figure 2 correspond to favorable economic times.The vertical text in Figure 1 provides examples of how low points in energy consumption have proven to be very bad. In this section, I show that the opposite is also true: High points tend to correspond to very good times economically.
One peak in Figures 1 and 2 coincides with the 1901 to 1910 period. This period corresponds to early electrification and advances in the mechanization of agriculture. It was before 1913 when the United Kingdom hit peak coal, limiting the amount of coal that could be profitably extracted. Germany hit peak hard coal shortly before World War II. After peak coal was reached, less coal was available per capita. Leaders felt the pressure of "not enough coal to go around" and opted for war.
In Figures 1 and 2, rapid energy growth occurred after World War II, during the 1950s, 1960s and 1970s. The lower peak in the 2001-2010 period coincided with much greater use of coal after China was added to the World Trade Organization (WTO) in late 2001. High-wage countries started transferring their industry to China because costs would be lower in two ways: Wage costs were lower, and coal was an inexpensive fuel, reducing energy costs. Furthermore, by transferring industry, including manufacturing and mining, to China, high-wage countries could also lower their own CO2 emissions, as required by the 1997 Kyoto Protocol.
We would expect the patterns we are seeing in Figures 1 and 2 if the world economy is governed by the laws of physics. The availability of plenty of inexpensive energy, of kinds that match built infrastructure, is what is needed to allow the world economy to grow.
[3] Figure 3 shows more recent world energy data organized by 5-year periods. It shows how small the "red caps" of the types leading to favorable economic outcomes have been in the last decade. Figure 3. Chart showing similar information to that in Figure 2, calculated for 5-year periods, instead of 10-year periods. Underlying data is from the 2025 Statistical Review of World Energy, published by the Energy Institute.
The latest two 5-year periods comprise the years 2015 to 2024. The short red caps on these two 5-year periods mean that the economy is already being squeezed in the direction of not-enough-to go-around.
[4] Viewed on this same basis, diesel and jet fuel supplies are being squeezed even more than the overall supply of energy products.Diesel and jet fuel are somewhat similar in composition. They are grouped together in some energy reports as "middle distillates." They are relatively heavy oil products that come out of oil refineries. If there is a shortage of one, there likely is a shortage of the other as well.
 Figure 4. Chart showing similar information to Figures 2 and 3, calculated for 5-year periods, with respect to "middle distillates," a category that includes diesel and jet fuel. The underlying data is from the 2025 Statistical Review of World Energy, published by the Energy Institute.
Diesel and jet fuel are of concern because, since 2015, there has been an actual shrinkage in the amount of these fuels available relative to population. In fact, every five-year period since the 2000 to 2004 period has shown less growth in diesel and jet fuel than in the overall world energy supply. (Compare Figures 3 and 4.)
The low growth of diesel+jet fuel is particularly concerning because these fuels are essential for international transportation. With too little of these oil types, trade across the Atlantic and Pacific needs to shrink back. The physics of the situation makes tariffs look like an attractive solution for reducing trade.
Figure 5. Chart made by the author, pointing out the need for shorter trade routes.
Another concern is that diesel is essential for food production and transporting. Even if some other types of energy are available in plentiful supply, we cannot get along without food. While wind and solar are popular energy types today, they are not very useful for either international transport or for operating modern agricultural equipment.
[5] The underlying problem is that populations tend to outgrow their resource bases, including energy supplies.The issue of the world not being able to support endlessly rising human population is an issue that no politician, auto maker, or economist wants to mention. The standard work-around is to show energy supplies without using an adjustment to a per-capita basis. This tends to make the energy situation look much better than it really is. Figure 6 is an example of such a chart.
 Figure 6. World energy divided between fossil fuels and other types, based on data from the 2025 Statistical Review of World Energy, published by the Energy Institute.
Figure 6 emphasizes how modest the recent add-ons to the fossil fuel supply really are. These add-ons are made possible by fossil fuels; they would tend to disappear if fossil fuels were to disappear. Nuclear, which is the largest of the add-ons, requires both uranium and fossil fuels. The category "Wind+Solar" is the tiny green stripe at the top of Figure 6. In 2024, Wind+Solar amounted to 2.8% of world energy supply.
[6] It is easy to make electricity look like a growth area that can continue its pattern forever.Figure 7 is a world electricity chart that, like Figure 6, is not on a per-capita basis.
 Figure 7. World electricity divided between fossil fuels and other types, based on data from the 2025 Statistical Review of World Energy, published by the Energy Institute.
There are a few details that are easy to miss:
(a) Current electricity production is quite small compared to the total energy supply. As counted by the Energy Institute, electricity amounts to only about 20% of total energy, varying by year and by part of the world. It is already incorporated in Figure 6.
(b) Almost all the non-fossil fuel part of the energy supply ("Add-Ons") is electricity. In Figure 6, the only type of non-fossil energy shown that is not electricity is biofuels. These are mostly ethanol and biodiesel.
(c) Another detail that is easy to miss is the fact that the growth in the world's electricity supply, as shown in Figure 7, has been almost exclusively outside the Advanced Economies-that is, members of the Organization for Economic Co-operation and Development (OECD). The Advanced Economies group includes the US, most of Europe, Japan, Australia, and several other countries.
 Figure 8. Electricity generation divided between Advanced Economies and Other Economies, based on data from the 2025 Statistical Review of World Energy, published by the Energy Institute. The amounts are not per capita.
Figure 8 shows the growth in electricity generation separately for the Advanced Economies and the Other Economies. The chart shows that generation of electricity by the Advanced Economies grew until 2007 but flattened after that date. Electricity generation by the Other Economies has grown the entire time since 1985. The rate of electricity production growth of Other Economies became noticeably more rapid after China joined the WTO in 2001.
Also, population growth since 1985 has disproportionately taken place in Other Economies, as contrasted with Advanced Economies.
 Figure 9. Population of Advanced and Other Economies, based on the population assumptions underlying the per capita calculations shown in the 2025 Statistical Review of World Energy, published by the Energy Institute.
[7] In the Advanced Economies, electricity production has recently been falling on a per capita basis, making a shift to greater electrification seem difficult.
A major issue is that the Advanced Economies are already seeing their electricity supplies per capita declining as shown on Figure 10 below. This is true for all five of the selected economies. Some of the lower consumption is due to efficiency improvements, but some is the result of the offshoring of jobs and industries to low-wage countries.
 Figure 10. Per capita electricity production in five selected Advanced Economies, based on data from the 2025 Statistical Review of World Energy, published by the Energy Institute.
In comparison, electricity production per capita of other economies, with typically lower wages than Advanced Economies and often accompanies by more rapid population growth, has tended to rise, as shown on Figure 11.
 Figure 11. Per capita electricity production in four selected economies, not included in Advanced Economies, based on data from the 2025 Statistical Review of World Energy, published by the Energy Institute.
The four "Other Economies" are less similar to each other than the five Advanced Economies. But what is striking is that they all have shown growth in per-capita electricity production since 1999. In 2024, Saudi Arabia's electricity production had risen to about the per-capita level of the US's electricity production. By 2024, China's per-capita electricity production had surpassed that of both the EU and the UK. Russia was part of the Soviet Union before the latter collapsed in 1991. Once Russia's economy had started recovering from the collapse, about 1999, its per-capita electricity production also began to rise.
[8] Other issues are also making a continued shift to electrification appear difficult, particularly for the Advanced Economies.Trying to work around using fossil fuels leads to the need for more specialized minerals to produce high tech electrical goods and electricity transmission. The problem faced by Advanced Economies is that they produce practically none of these minerals; they must import them. The US has a long list of minerals it considers critical.
 Figure 12. Chart of 60 Critical Minerals. Source: https://www.usgs.gov/programs/mineral-resources-program/science/about-2025-list-critical-minerals
Some of these minerals aren't rare in the earth's crust. Part of the problem is the lack of industrial capacity in Advanced Economies today, as industry has been moved overseas to reduce costs and local CO2 emissions. For example, the US used to be a major producer of aluminum, but this production has dwindled; other countries, including China, can produce aluminum at lower cost.
Another issue is that China produces the majority of quite a few of these minerals. The US, and probably the other Advanced Economies, had planned to buy what they needed on the world market. Now, production is not keeping up with the amount the world could easily use. In 2025, China announced export restrictions on some minerals, including gallium, germanium and antimony. It has become clear that if Advanced Economies want to have adequate supplies of high-demand minerals (including silver, copper, platinum, rare earth minerals, and uranium, among others), they need to start producing them themselves.
Diesel is used in extracting many of these minerals. If diesel is in short supply, that adds another layer of problems. All these issues may lie behind President Trump's interest in Greenland.
[9] We don't hear about these issues partly because academic researchers live in ivory towers, and partly because politicians don't dare explain the issues to voters.Part of the problem is that economists don't understand how tightly the various parts of the world economy are interconnected through the laws of physics. Economists tend to believe that if there is a shortage, prices will rise, and these higher prices will solve nearly all problems. This is not necessarily the case. Buyers cannot purchase more than they can afford. Prices may spike temporarily and then fall back. Production of fossil fuels or minerals may end because prices do not rise high enough, for long enough, for producers to depend upon the higher prices for the long term.
In the case of a shortage, most people assume that the only change the economy will make is in prices. However, the economy is tightly interconnected. It can move production to a different part of the world, where wages and energy costs are lower. An indirect result, in the country losing jobs, may be more wage and wealth disparity. The US seems to be experiencing this issue now, with fewer young people being able to find a job that pays well.
Needless to say, politicians aren't willing to admit, "We have difficulties for which we can see no solution." Even leaders of universities are reluctant to suggest that there might be major problems ahead. They don't want to frighten students or their parents. University officials want all problems to be ones their students can work on, with the hope of solving them in the next few years.
[10] What is happening now is similar to the outcome of a game of musical chairs, when there is one fewer chair than the number of players.Figure 13. Chairs arranged for Musical Chairs Source: Fund Raising Auctioneer
In the game of musical chairs, players walk around a group of chairs until the music stops. At the end of each round, one chair is removed, leaving one fewer chair than the number of players. In the next round, the remaining players all scramble for the chairs available, which often leads to small fights over who gets a chair. This not-enough-to-go-around problem explains the poor relations we see today among countries and political parties. It is also the underlying reason for the interest in imposing tariffs and in bombing other countries.
Financial markets tend to perform well during periods of economic growth. However, if certain kinds of essential resources are in short supply, this will tend to hold back growth. Debt defaults and falling stock markets could result. For these reasons, problems in financial markets may be ahead.
Major governmental changes may be ahead. Representative governments require more energy than simpler types of organizations, such as dictatorships. Furthermore, citizens do not like disorder; they may want to overthrow leaders who seem to allow too much disorder. They may vote them out of office or even try to assassinate them. The problem of resource inadequacy is structural, however. Getting rid of a particular leader doesn't necessarily help the situation.
Everywhere in the world, at least part of today's problem is that there are not enough jobs available that pay well. Economists have told us to expect high prices if there are shortages. In a way, not having enough jobs that pay well is the opposite problem. But from a physics standpoint, the result is the same. Only a few people can afford many of the goods that are available. The economists' misinterpretation of what is going wrong further confuses people's understanding of our current situation.
Mainstream media needs to cater to advertisers. Because of this issue, we cannot expect them to tell us what is happening. That task seems to fall to bloggers, like me. I try to write an article approximately every month. I hope that the graphs and other figures I have presented in this article will help readers understand why we are currently seeing more types of disruptions, such as tariffs and bombings.
 Understanding Deglobalization: The Role of Diesel and Jet Fuel [ 02-Feb-26 3:23pm ]
We are starting to see the beginnings of deglobalization: Countries are increasingly at odds with each other. There is wider disparity among political parties. Trump is making what look to many people like unreasonable demands, both within the US and around the world.
I believe that there is an underlying problem that most people are missing. A worldwide shortage of diesel and jet fuel is forcing international trade to begin moving into a new downward phase, relative to the recent share of GDP shown on Figure 1.
 Figure 1. Trade as a share of GDP, 1960 to 2024, in a chart prepared by OurWorldinData.org.
While international trade grew as a percentage of GDP between the 1960s and 2008, it has been basically flat since then. Now the shortages of diesel and jet fuel are forcing the international trade percentage to start falling to a lower level.
In this post, I will try to explain the situation further. One conclusion: Conflict results from the need to reorganize the world economy in a way that uses less long-distance international trade.
[1] Background: The world economy is a dissipative structure, operating under the laws of physics.The economy behaves differently than most researchers assume because economies are dissipative structures, operating under the laws of physics. Most researchers model tiny parts of economies, and because of their views are so narrow, they reach misleading or wrong conclusions.
Most structures that we see, such as books or houses, are, in a sense, dead. Dissipative structures, however, are different in that they can temporarily grow. In order to stay away from being in a dead state, they need to "dissipate" energy of the proper kinds, in adequate amounts. Examples of dissipative structures include plants and animals of all kinds, ecosystems, and hurricanes.
The human body is a dissipative structure that requires food to stay away from a dead state. Hurricanes are dissipative structures that dissipate the heat of a warm body of water.
If an ecosystem doesn't get enough energy of the right kinds, it will adapt to accommodate the actual mix of fuels and other resources available. If an ecosystem doesn't get enough sunlight, or enough warm temperatures, or enough water, it will gradually shift toward a different mix of plants and animals that can operate within the mix of resources available. This is similar to what happens within the human body. If a human doesn't get enough food, their body will shrink or become thinner.
I believe that without adequate diesel and jet fuel, our economy will make a transition analogous to a human going on a diet, or analogous to an ecosystem changing when a different mix of resources is available.
Academic researchers around the world have misunderstood how the process works because they tend to work in ivory towers. They create models based on the narrow view of the economy that their academic area considers appropriate. Once they have developed a narrow model, they cling to it, even though recent insights from physics suggest that a very different model is more appropriate.
[2] Researchers in academic settings make many unwarranted simplifications in their models.Researchers like to assume that all energy is alike. Substitution is assumed to be relatively easy and quick. Models tend to indicate that if the supply of energy is inadequate, prices will rise. With these higher prices, the economic system will keep problems away practically indefinitely.
The real world doesn't work this way. When we eat food, we cannot simply substitute kale for all our other food consumption and expect to thrive, even though models would seem to suggest that kale is good for us. Within ecosystems, it is the mix of resources and predators that matters. If the top-level predator is killed off, the system will change. The world economy will face similar changes if today's international transport system runs into difficulties.
[3] The fuels especially used for international transport today are diesel and jet fuel.To be useful in international transport, fuels need to
- Be energy dense
- Be easy to store
- Match current infrastructure, unless change is many years away, and system is rebuilt
- Be inexpensive; not requiring a lot of capital investment in infrastructure to support
Diesel and jet fuel have long been the prime fuels used for international travel and transport. "Bunker fuel," which tends to be heavier and more polluting, has also been used. Its use is strongly discouraged today because of pollution issues.
[4] An issue we have today is that diesel is also essential for many other uses.Diesel is an essential fuel today for food production and local transport. Most of the agricultural equipment now in use operates using diesel fuel. Diesel-powered machines can easily navigate muddy fields. In addition, diesel also powers most of the heavy semi-trucks around the world. These trucks deliver goods of all kinds, locally, including food.
Another essential use for diesel is building and maintaining infrastructure. This would include:
- Roads
- Bridges
- Pipelines
- Commercial buildings
- Factories
- Pipelines
- Electricity transmission lines
- Building and maintaining structures used to produce electricity, such as nuclear power plants and hydroelectric plants
The importance of diesel to the economy is difficult for most people to see because these are behind the scenes types of activities.
[5] It is very difficult to get the price of diesel to rise for any extended period.If the price of diesel rises, the price of food tends to rise. This happens because diesel is heavily used in food production and transport. Needless to say, high food prices tend to be unpopular with voters. For this reason, even if the diesel supply is low, the price of the fuel doesn't necessarily rise. If this happened, voters would be very unhappy. They would elect new politicians.
What, in fact, tends to happen is that oil prices (not just diesel and jet fuel prices) tend to bounce up and down. Figure 2 shows a chart of average annual oil prices.
 Figure 2. Average annual Brent equivalent oil prices, in 2024 US$. Data for 1948 through 2024 from the 2025 Statistical Review of World Energy, published by the Energy Institute. Data for 2024 estimated based on EIA estimates of spot Brent prices for 2025, adjusted for inflation.
Figure 2 smooths out some of the price irregularities. For example, there was a very high peak in July 2008, but the price fell to a low level by December of the same year. The peak doesn't appear very high on this chart, but it greatly affected financial markets. See my article, Oil Supply Limits and the Continuing Financial Crisis.
[6] Diesel and jet fuel disproportionately come from oil that is quite "heavy." Oil refineries tend to offer lower prices for heavy oil, making it unattractive to extract.There is a price compression problem with heavy oil:
- Heavy oil tends to be difficult to ship because it doesn't flow through pipelines well. It often needs to be heated, or diluted with a very light oil, to make transportation possible.
- To make matters worse, heavy oil quite often contains sulfur and other impurities that need to be removed, adding refining costs.
- The problem is that these higher costs cannot easily be passed on to the ultimate consumers of diesel and jet fuel. For example, food production and transport depend significantly on diesel, and sometimes even on jet fuel. Consumers of food do not like high food costs.
Because of these issues, the prices refineries are willing to pay for heavy oil tend to be lower than the prices they offer for "light, sweet" oil. For example, the current oil prices shown on OilPrice.com are $70.51 for Brent Crude (a light, sweet European crude), $65.13 for West Texas Intermediate (a sweet US crude) and $50.86 for Western Canadian Select, from Canada's Oil Sands. Russia also has moderately heavy oil; Russia's Urals blend is diluted to make it flow adequately. Its price is listed at $54.48.
These pricing issues make the extraction of heavy oil, especially very heavy oil, unattractive to oil companies. Basically, oil prices do not rise high enough, for long enough, to make extraction profitable. People who look at the Energy Return on Energy Invested (EROEI) of resource extraction would say that the EROEI is very low. In other words, a huge amount of energy needs to be invested to make heavy oil extraction possible. This tends to make the cost of oil extraction expensive.
Because of this price compression, and thus the low prices paid to oil producers, it is not very profitable for oil companies to extract heavy oil. This means that governments cannot charge these companies very high taxes, or they will stop producing oil completely. In addition, tax revenue collected from oil producers tends to fall too low to provide adequate government services., and it also becomes difficult to pay workers adequate wages. These issues lead to unrest in countries with heavy oil reserves, but not much other industry, such as Venezuela.
[7] A naive look at the oil data received from the various agencies does not disclose the nature of the world's oil problem.A chart summarizing the consumption of different types of oil, based on data from the 2025 Statistical Review of World Energy, is as shown in Figure 3. Note that the Diesel+Jet Fuel layer is the product grouping with the largest consumption. In the US, we hear a lot about Gasoline, but Diesel+Jet Fuel is the layer with the greatest fuel consumption. Diesel+Jet Fuel provides a huge quantity of services, but its usage is mostly hidden from sight.
 Figure 3. Figure prepared using data from the "Oil-Regional Consumption" tab of the 2025 Statistical Review of World Energy, published by the Energy Institute. The Light Group is the combination of naphtha, ethane, and liquid petroleum gas (LPG). These are close to gases. The other categories have longer molecules, and thus higher boiling points. The Heavy Group includes waxes, lubricants, asphalt, as well as a fairly unrefined oil, used as a cheap but polluting fuel, shown as "Fuel Oil" on the same tab.
Most published data show only the sum of the four layers in Figure 3. It seems to be rising. This amount represents a combination of quite a few types of oil. When this increasing production is considered along with the reported high oil reserves (particularly heavy oil in Canada and Venezuela), and the belief that prices will always rise if there is a shortage, most researchers cannot imagine that a problem might be occurring.
Researchers often overlook how crucial oil is to the economy. People all over the world need food, roads, and many other things that depend on oil. The number of people who can make an adequate living seems to depend upon the oil supply. It makes sense to look at oil supply per capita. The chart below uses the same amounts, divided by world population. On this basis, world oil consumption is flatter. In fact, per capita oil supply has been somewhat declining recently.
 Figure 4. Amounts shown in Figure 3, divided by world population used by the Energy Institute in its 2025 Statistical Review of World Energy. Different colors are used in this chart compared to Figure 3.
The other thing that becomes apparent from this chart is that the overall mix of products coming out of current processes (extracting and refining oil) has been getting lighter over time. This should not be surprising because the most rapidly growing oil supply since 2008 has been tight oil, extracted from shale in the United States. This tight oil tends to be quite light, adding output to the Light Group and to Gasoline, far more than to Diesel+Jet Fuel or the Heavy Group.
[8] The pattern of diesel supply growth provides insight into what is going wrong with world trade.Figure 5. World per capita diesel supply based on data of the 2025 Statistical Review of World Energy, published by the Energy Institute.
Diesel is about 78% of the combined grouping Diesel+Jet Fuel. The two are similar enough that refineries can slightly change the output mix between the two.
The World Trade Organization began operation in 1995. Its purpose was to encourage more world trade. The Kyoto Protocol of 1997 encouraged countries to cut their own CO2 emissions. The easiest way to do this was by sending manufacturing, mining, and other industries to other countries around the world. Thus, indirectly, the Kyoto Protocol also encouraged world trade. Figure 5 shows that between 1995 and 2008, per-capita world diesel consumption was increasing. The restriction in supply that began around 2008 corresponds with the flattening of world international trade shown in Figure 1.
[9] Several issues contributed to the drop in per-capita diesel supply starting about 2008.(a) In the period before 2008, there was relatively more oil in the Heavy Group that could be refined into Diesel + Jet Fuel (Figure 4). Notice how the Heavy Group layer gets narrower, especially between 1980 and 2008. The Heavy Group includes end uses such as lubricants, waxes, and asphalt. It also includes some heavy oil consumed in close to an unrefined state, such as bunker fuel for ships. Burning such oil is very polluting, so laws have been changed to discourage its use. Simple refining could transform oil such as bunker oil into diesel and jet fuel.
(b) A technique called hydrocracking can be used to transform long hydrocarbon molecules, such as the ones that make up asphalt, into shorter ones. The EIA in 2013 reported, Hydrocracking is an important source of diesel and jet fuel. This technique is expensive, however. It needs a high selling price of crude oil for the economics to work. If the price of oil is high enough, it makes sense to make less asphalt, and more diesel oil and jet fuel.
(c) Price differentials tend to discourage the development of heavy oil fields. As documented in Section [6], the price refineries are willing to pay for heavy oil tends to be quite a bit lower than the price of lighter oil. In the early days of extraction, medium grades of oil tended to give a range of products, from light to heavy. But peak conventional oil took place about 2005, forcing oil companies to extract both very light grades and very heavy grades, with the hope of combining the two types of output to meet the needs of society. Since 2008, the growth in light oil extraction has been spectacular, particularly in the US, with its tight oil from shale. But growth in heavy oil supply has tended to lag.
(d) Depletion is an issue for oil supplies. As with many other resources, the oil taken first is the oil that is easiest to extract and the closest to where the end product is to be used. The oil that is left for later tends to be higher cost to extract and transport. High-cost oil is likely to produce high-cost food. High-cost food tends to upset family budgets, making voters unhappy.
(e) Political issues play a role as well. A major issue is the low profitability of heavy oil extraction because of its low sales price to refineries. With low profitability, tax revenue based on oil royalties tends to be low. Without adequate tax revenue, leaders of countries producing heavy oil for export tend to become belligerent. Examples include Venezuela, Russia, and Canada. Within the US, California produces heavy oil.
[10] The world order seems to on the verge of radical change.We are now facing a situation in which the world economic order seems to be breaking apart, in order to form a new order that "works" better with the changing quantity of Diesel+Jet Fuel available.
We are dealing with a situation that has much in common with a game of musical chairs.
 Figure 6. Chairs arranged for Musical Chairs Source: Fund Raising Auctioneer
The game of musical chairs is played in rounds. At the beginning, there are as many players as chairs. In each round, one of the chairs is removed. The players walk around the circle of chairs until the music stops. When the music stops, all the players try to grab a chair to sit on. There can be small fights over who gets a chair. The person who does not get a chair is eliminated from the game.
When an economy is faced with an inadequate supply of Diesel+Jet Fuel, it needs to regroup in a different way. To do this, some existing businesses and governments must fail, so that others can take their place. In addition, supply lines need to be rearranged to use the resources that are actually available. Customs and beliefs may need to change, as well.
The way nations interact can change as well. In the years of growing international trade, (1970s to 2008), co-operation seemed to be important. Working together was relatively easy. During the tearing down stage, which seems to be starting now, the situation can be expected to be very different. We can expect assertive leaders, and lots of conflict. We are facing this strained situation today.
[11] What lies ahead?I don't think that any of us know for certain what will happen in the future. Nevertheless, the self-organizing world economy seems to be organizing for itself what is ahead. Or perhaps, the hand of a Higher Power is organizing what is happening.
I have only discussed the problem of inadequate Diesel+Jet Fuel, and its impact on international trade and some other parts of the economy. There are other shortages we need to work around as well:
In many parts of the world, one shortage is of fresh water. This is often connected with depleted aquifers and today's high human population.
Another shortage relates to the critical minerals we need for a high-tech society. Billionaire Robert Friedland describes the issue in this video. We have plunged headlong into high tech goods of all kinds, including wind turbines, solar panels, electric vehicles, batteries, computers, and electrification of many kinds of things without realizing that we would soon reach limits in the supply of many minerals used in making these high-tech devices. China controls the vast majority of the critical minerals that are mined. Countries must try to start producing their own critical minerals, or remain on good enough terms with China to purchase some of the limited supplies available.
A third shortage relates to nuclear, and our plans to ramp up nuclear energy. As far as I can see, uranium extraction is currently constrained. In theory, it can be ramped up, but it takes a long chain of events to do so.
With these shortages, AI seems to be constrained in how quickly its use can be expanded. It needs to become far more energy efficient to be truly useful.
With all of these issues, it seems impossible to keep forging ahead as we have done in the recent past. We are being forced to source more of our manufactured output locally. We need to greatly reduce the transportation of goods across the Atlantic and Pacific. Using tariffs seems to be a way of trying to accomplish this change.
Strange as it may seem, some of Trump's policies make a certain amount of sense, when viewed in the light of the issues the world is facing. I expect that a replacement leader would be just as abrasive. The new leader would likely have different strange policies, but the underlying problems are structural. The new leader would likely also face difficulties in trying to fix today's problems.
I am afraid we will have to wait for the self-organizing economic system to find a solution for us. Perhaps innovations can bring us new ways of doing things that will eventually work around these difficulties. But, for the near term, higher levels of conflict because of resource shortage problems seem likely.
Recently, many people have begun talking about the US having a k-shaped economy. In it, a handful of wealthy people are doing very well financially, while many others are falling further and further behind. I expect that the low wages of the majority of workers will soon lead to adverse impacts on businesses, governments, and international organizations. This phenomenon is likely to lead to a very uneven world economic downturn in 2026.
The world economy is subject to the laws of physics. The world economy seems to be reaching growth limits because there are too few easily extractable energy resources (as well as other resources, such as fresh water), relative to the world's population. The Maximum Power Principle strongly suggests that even as limits are hit, the world economy cannot be expected to collapse all at once. Instead, the most efficient producers of goods and services will be able to succeed as long as resources are available, while less efficient producers will tend to fall by the wayside. Thus, the Maximum Power Principle somewhat limits the speed of the world's economic downturn.
In this post, I will try to explain the challenges the world economy is now facing. I will also provide some thoughts on how 2026 will turn out.
[1] The k-shaped economy that the US and many other countries are experiencing is an indication that resources are, in some way, "running short."Humans all have similar basic needs. They need food to eat, and they need to cook at least some of this food before they eat it. They tend to need transportation services, both for themselves (to get to work) and for goods, such as the food they eat. They also need governments to keep order and to provide basic services, such as roads and schools. All these goods and services require energy of a suitable kind, such as human labor, burned biomass, or fossil fuel energy. They also require arable land, fresh water, and minerals of many kinds.
If there are not enough resources to go around, the easiest way to accomplish this is by creating a k-shaped economy. One example is with farmland. In many traditions, when a farmer dies, his oldest son inherits the farm. Younger children are then forced to find other kinds of employment, such as being a craftsman, farmer's helper, or priest in a church. Wages for these younger children can easily fall lower than the income of their land-holding older brothers, especially if large families become common. Creating jobs that pay well for all the younger children becomes a problem.
A similar phenomenon has been happening in many Advanced Economies (US, UK, and other countries included in the OECD) in recent years. Parents are doing quite well financially, but their children often have difficulty finding jobs that pay well, even after advanced schooling. Some adult children are also left with educational debt to repay. This is a new type of k-shaped economy.
[2] The world's current problem is an ever-rising population paired with resources that are becoming ever-more "expensive" to extract.World population has exploded since fossil fuel consumption became abundant. This has allowed more food to be grown, inexpensive transportation of goods and people, and the development of antibiotics and other drugs.
 Figure 1. Chart made by Gail Tverberg based on several population sources.
At the same time, the most accessible resources were extracted first. For example, fresh water initially came from streams, lakes, and shallow aquifers. As the population grew and industrial needs became increased, wells had to be dug deeper and aquifers began to be drained. In some places, desalination now needs to be used. Each of these advances in producing fresh water became more resource-intensive. It became increasingly difficult to gather enough fresh water using human labor alone. Instead, increasing quantities of physical materials, energy supplies, and debt were needed to make the new systems work.
The reason debt was needed to purchase capital goods, such as those required to obtain high-cost water, was because the devices purchased were expected to provide the desired output (water, in this case) for a long time in the future. Securing this future benefit required advance funding, using an approach such as debt. The sale of shares of stock, which are expected to appreciate over time and pay dividends, provides a similar benefit to debt.
A similar issue arises with the increasing extraction of minerals of many kinds, such as copper, tin, uranium, lithium, coal, and oil. Early on, extraction using manual labor and simple tools was sufficient. However, once the easiest to extract resources were removed, capital goods became necessary to make extraction efficient.
Capital goods, such as coal fired power plants, wind turbines, solar panels, and hydroelectric power plants also allowed electricity to be produced, extending the benefits of fossil fuels. Producing these capital devices requires physical materials and energy supplies, as well as debt or the sale of shares of stock for financing.
[3] A major limit on the system seems to be debt and the interest required on the debt.In an economy, the growth of inexpensive energy supply acts very much like leavening works in making bread; it greatly helps economic growth. With the increasing use of inexpensive energy supply, vehicles can be made ever-less expensively, compared to using much hand labor for manufacturing (literally, making goods by hand). With this growing efficiency, wages rise faster than inflation. In the 1950s and 1960s, young people found that they could marry and live in nicer homes than their parents. Now, the reverse seems to be happening: many adult children are finding it difficult to keep up with the lifestyles of their parents.
Once the inexpensive-to-extract energy supply is depleted, economies tend to add an increasing amount of debt, in an attempt to pull the economy forward. It seems to me that a major limit on the system comes when an economy slows down so much that it can no longer repay its debt with interest.
 Figure 2. The author's view of the analogy of a speeding upright bicycle and a speeding economy. "Debt with its time-shifting ability helps pull the economy forward, but it only works if the economy is moving fast enough."
Political leaders like to believe that growing debt, by itself, will pull the economy forward. In fact, this does work, for a time, as long as interest rates are falling. But falling interest rates stopped happening in 2022.
 Figure 3. Interest rates on 10-year Treasuries (red) and on 3-month Treasuries (blue), based on data of the Federal Reserve of St. Louis.
Of course, all the added debt contributes to the k-shaped economy. The already wealthy disproportionately benefit from debt payments. They also tend to benefit from dividends on shares of stock and from share price appreciation. The poorer people find that an increasing share of their wages goes to paying interest on debt, especially as interest rates rise.
As debt levels grow, governments eventually have a problem with repayment of debt with interest. They need to raise taxes simply to cover their rising interest payments. This is the reason why Donald Trump wants to get interest rates down. Interest payments are rising rapidly, with near-zero interest rates in the rear-view mirror (Figure 3).
[4] Added technology and economies of scale have been adding to the k-shaped economy.Technology requires specialization. People with more training and higher skill levels tend to earn more than others. Economies of scale encourage the growth of ever-larger businesses. The people at the top of huge organizations tend to earn more than those at the bottom. Also, as international trade is added, low-wage people in the hierarchy increasingly compete for wages with workers from countries with much lower wage scales. Thus, the wages of less-skilled individuals are increasingly squeezed down.
Furthermore, both added technology and economies of scale require added debt. Again, the interest on this debt (and dividends on stock) disproportionately benefits those who are already wealthy.
[5] In a sense, artificial intelligence (AI) is simply an extension of added technology, with a huge need for electricity, water, and debt.The hope for AI is that it will make our already k-shaped economy, a great deal more k-shaped. The hope is that AI can eliminate a significant share of jobs, with such high profits that the owners of this technology can become very rich. If it works, the wealth will be even more concentrated at the top than today.
I see the need for electricity, water, and debt as stumbling blocks for AI. I expect that, starting in 2026, the AI rapid growth spurt will seize up because it is already using more resources than are available in some areas. I expect that a significant downshift in AI will adversely affect the US stock market and the rate of growth of the US economy. My hope is that the loss of growth in the AI sphere will not, by itself, bring down the US economy-just nudge it toward recession.
[6] In 2026, with an increasingly k-shaped economy, I expect that world oil prices will drift lower than today."Demand" for oil really means "the quantity of oil that people, businesses, and governments around the world can afford to purchase." As the economy becomes more k-shaped, fewer people can afford to buy vehicles of any kind. Poor people, in the lower part of the k, are hardest hit. They will tend to increasingly rely on low energy approaches, such as ride-sharing, walking, or using a bicycle. They will tend to buy fewer goods that are transported internationally. Governments, as they begin collecting less in tax revenue from the many poorer people, will be inclined to cut back their spending on new buildings and road improvements. These changes work in the direction of reducing oil demand, and thus oil prices.
It is this increasingly k-shaped economy that has been holding world oil prices down in 2025. I expect that prices will drift even lower in 2026 because of the increasingly k-shaped world economy. There aren't enough very rich people to hold up oil and other resource demand by themselves.
Oil production will not immediately drop in response to these low prices, although it may start drifting lower in 2027. The US Energy Information Administration is forecasting that world oil production will rise by 1.1 million barrels per day in 2025 and by 1.2 million barrels per day in 2026. These amounts do not seem unreasonable based on new developments that have already started producing higher amounts of crude oil.
[7] The heavier types of oil, from which diesel and jet fuel are disproportionately made, are in short supply now. They are likely to continue to be in short supply in 2026.World oil production has risen in recent months. When I investigated, I found that the vast majority of the recent growth seems to be in light oil. Thus, the shortfall in diesel and other heavy fuels is likely to continue as in the recent past.
Figure 4. Chart showing the level of per-capita diesel consumption, relative to the per-capita consumption in 1980. Amounts are based on Diesel/Gasoil amounts shown in the "Oil-Regional Consumption" tab of the 2025 Statistical Review of World Energy, published by the Energy Institute.
This shortage of the heavy types of oil has several impacts:
a. With a shortage of heavy oil, a fairly strong country, such as the US, is tempted to attack Venezuela, which has the world's largest reserves of heavy oil.
b. Island nations without their own fossil fuel supplies tend to use a disproportionately large share of diesel and jet fuel, for several reasons: (1) Such islands often burn diesel fuel for electricity. This is an expensive way to make electricity; goods produced with this electricity become too expensive to export. (2) Imports and exports need to be shipped in by boat or by air, again using limited types of fuel supply. Physics tends to push these economies down by making their products expensive to sell elsewhere. Examples of islands with these problems include Cuba, Puerto Rico, Madagascar, and Sri Lanka. Such places tend to be adversely affected by shortages of heavy oil sooner than other locations.
c. Without enough jet fuel, long distance tourism is likely to be reduced in 2026. One issue is the lack of jet fuel for flying planes. Another issue is that an increasing share of the population will not be able to afford long-distance tourism because of the k-shaped economy.
d. Tariffs are a way of discouraging the shipping of goods long distance, to indirectly save on heavy oil. We should not be surprised by their increasing usage.
[8] In my view, deflation is a greater risk than inflation in 2026.With a k-shaped economy, demand for apartments (especially smaller ones) tends to stay low. As an economy becomes increasingly k-shaped, low-paid workers tend to share an apartment with one or more friends or move in with family members to save money. In a December 23 report, Apartment Advisor writes that the US average asking rent for studio apartments fell by 2.81% in 2025 compared to 2024. The similar comparison for one-bedroom apartments showed a price drop of 1.72% in 2025. In an increasingly k-shaped economy, I would expect this trend toward lower rental prices of smaller apartments to continue and perhaps become more pronounced.
Real estate selling prices may also be an area for downward price pressure. Young people who have not built up equity through prior home ownership tend to find themselves shut out from buying homes. Also, commercial real estate of many kinds seems to be grossly oversupplied in many areas. Given this situation, downward price adjustments seem likely.
Underlying this downward pressure on prices may be some actual cuts in wages. One law firm reports that cuts in wages are becoming increasingly common, especially for employees of smaller companies.
There are precedents for deflation becoming a problem. The US had problems with deflation at the time of the Great Depression. Japan had problems with deflation after its crash in real estate prices in the 1990s, and China (with its real estate price crash) has recently been having problems with deflation.
[9] "Bread and circuses" become more important as the economy becomes more k-shaped.Many readers have heard about bread and circuses. Before the Roman Empire collapsed, it used bread and circuses to keep its citizens from rioting from a lack of food. The way to prevent food riots is by making sure everyone has enough to eat through food distribution programs, described as "bread." Providing circuses offers a distraction from the fact that there are not enough well-paying jobs to go around.
Today, with our increasingly k-shaped economies, leaders have figured out that meeting citizens' basic needs is essential if unrest is to be avoided. Political leaders somehow need to provide food and healthcare to their poorer citizens. They also need to keep people distracted with entertainment. For many years, governments of Advanced Economies have been trying to provide the equivalent of bread and circuses. In the US, legislation providing Social Security for the elderly was enacted in 1935, during the Great Depression. Many other financial support programs have been added over the years. Today's circuses today are provided through televised entertainment and video games.
A major problem is that the costs of these programs have become more expensive than tax revenue can support. This is especially true of the cost of "bread," if its cost is defined as including healthcare and pensions for the elderly, in addition to food. Ultimately, these high-cost programs can bring an economy down. The high cost of bread and circuses is thus a second limiting factor, besides excessive interest payments on government debt, (discussed in Section [3]).
[10] Leaders of many countries are already making plans that can be used to deal with shrinking resources per capita.If there aren't enough resources to go around, what can governments do to prevent riots? Two obvious choices come to mind:
(a) Tighten controls on citizens to prevent riots. China has been a leader in this area, and the UK and US seem to be trending in a similar direction. In a sense, the Covid requirements of 2020 were practice with respect to restrictions on movement.
(b) Develop a rationing system that can be used, in case of a shortfall of essential goods. Many countries are looking at central bank digital currencies (CBDCs). These are a digital form of central bank money that is widely available to the public. In the US, I expect CBDCs will be rolled out initially as a way for those who are entitled to food stamps to easily access their benefits. If these digital currencies work, CBDCs can easily be expanded into a widespread rationing system. Government leaders will then be able to decide who can afford to buy what, rather than depending on the way the k-shaped economy currently allocates buying-power.
[11] What lies ahead in 2026?I don't think any of us know for certain. The general direction of the world economy seems to be toward contraction, but some parts of the world economy will fare better than others.
Europe looks increasingly like it is an "also-ran" behind the US and China in the world economy. I expect its resource use will continue to shrink back in 2026, indirectly benefiting the United States and the rest of the world. I am hoping that with cutbacks in oil usage by island nations and Europe, and the resulting lower world oil prices, the United States will be able to avoid the worst of the recessionary tendencies looming in 2026.
There are some reports that AI, as it is being applied in China, is providing major success in reducing the cost of coal mining in China. If this is true, it may allow China's economy to grow in 2026, despite downturns in many other countries.
I am fairly certain that AI, as it is being developed in the US and Europe, cannot continue its recent exponential growth trajectory, and I expect this to become obvious in the next few months. This shift seems likely to pull down US stock market indices. Here again, I am hoping that despite this issue, the US will be able to avoid the worst of the world's recessionary tendencies.
I don't expect a world war in 2026. For one thing, no country has adequate ammunition capability. I think civil wars and wars against nearby countries are more likely.
It is possible that the EU will collapse in 2026, leaving the individual countries on their own.
At some point in the future, I expect that the central government of the US will also collapse, in the manner of the Soviet Union in 1991. States will likely regroup and issue new local currencies; the new combined governments will likely provide much more limited benefits than the US government provides today.
Many people think that different leadership will change the current trajectory, but I am doubtful about this. Most of the world's problems are "baked into the cake" by resource shortages and by too high a population relative to resources. Keeping immigration down is one way of trying to keep resources and population in closer balance.
All in all, I expect a very uneven world economic downturn in 2026. Economies will continue to become more k-shaped. Governments will do their best to hide problems from the public. Stock markets will likely not do well in 2026, if they can no longer count on AI for an uplift.
- Today's financial system allows many promises of future goods and services. These include debts, pensions, and even prices of shares of stock.
- However, the quantity of actual physical goods and services that can be produced appears likely to be shrinking in future years because of resource depletion.
- This mismatch means that many/most of these promises likely cannot be paid as promised. The economy will somehow change to match what is actually available. We should not be surprised if, one way or another, we receive much less than has supposedly been promised. Even if a high currency amount is provided, it likely will not buy very much. Or a new government may be in power, with virtually no promises of benefits.
- Today's economic system requires both increasing energy supplies and increasing debt to function properly. We are now encountering limits with respect to both world energy supplies and US government debt. The parts of the world economy that are most affected by limits will likely begin to contract soon.
- We don't know precisely how this contraction will take place, but we can examine a list of countries whose GDP has already been contracting to see how they are faring.
- Perhaps we need to be relying more on our families and/or on "villages" made up of extended relatives or friends for our long-term support, rather than on government programs.
The world is filled with financial promises, including loans, pensions, and even the market value of stocks. So far, the system seems to be working, but in a finite world, it is hard to believe that the system will work indefinitely. Governments can create money simply by adding more promises, but they cannot create goods and services in a similar fashion.
We know that actual physical materials are needed to make the goods and services that people depend upon. Energy supplies are particularly important in making goods and services because, according to the laws of physics, energy is required to produce physical goods and services. Forecasts that support current financial promises ignore the fact that we live in a finite world. Eventually, we will run short of easy-to-extract essential materials, including fossil fuels, uranium, lithium, and copper. Economic growth will need to be replaced by economic contraction.
In this post, I will try to explain the situation in more detail, together with some charts showing what is going wrong now, such as Figure 1. In some ways, we already seem to be reaching limits to growth.
 Figure 1. Per capita energy growth rates are based on data from the 2025 Statistical Review of World Energy, published by the Energy Institute, with trend line and note.
[1] At first, added debt is helpful to an economy.
In some sense, added debt pulls an economy forward.
 Figure 2. The author's view of the analogy of a speeding upright bicycle and a speeding economy.
As long as there are plenty of inexpensively available resources and not too much interest to pay, added debt seems to make sense. It pulls the economy forward, in the direction that those resources are to be used. It "feels good" to the recipients of the goods and services made possible by the debt. People like the homes and cars that added debt makes possible.
Ordinary citizens have clear limits on their credit card debt. The limits on government promises seem to be hidden until they are actually reached.
As long as an economy is growing, that growth seems to hide many problems. Carmen Reinhart and Kenneth Rogoff are two well-known US economists. In a 2008 working paper (p.15) examining 800 years of government debt defaults, they remarked, "It is notable that the non-defaulters, by and large, are all hugely successful growth stories." Without "hugely successful economic growth," it is impossible to keep adding debt and repaying it with interest. The growth allows debt to be paid back with interest. It allows the fiction that an economy will continue to grow, and this growth will provide the margin needed to repay the debt with interest.
While the world economy has been an amazingly successful growth story since the industrial revolution, we now seem to be running short of the inexpensively available fossil fuels that have made economic growth so far possible. With this change, the economy is likely to start a major shift from economic growth to economic contraction.
We don't know exactly how this shift from economic growth to economic contraction will take place, but we can hypothesize that the economies that have recently been growing fastest might be farthest from contraction, and the economies that are already struggling with low growth might be the ones most likely to slip into contraction. The countries slipping into contraction can be expected to have special difficulty repaying debt with interest and meeting other financial promises. Some governments may even collapse, perhaps in the way the government of the Soviet Union collapsed in 1991.
[2] Not too surprisingly, given the physics connection stated in the introduction, total world GDP and world energy consumption are highly correlated. Figure 3. Energy based on data from the 2025 Statistical Review of World Energy, published by the Energy Institute; GDP in constant 2015 US$ is as published by the World Bank.
In fact, the growth rate of energy consumption and the growth rate of GDP are also correlated, as can be seen from the similar patterns on Figure 4.
 Figure 4. Three-year average growth rates are used for stability. Energy growth rates are based on energy data from the 2025 Statistical Review of World Energy, published by the Energy Institute; GDP growth rates are based on GDP in constant 2015 US$ as published by the World Bank.
A scatter diagram of the X-Y data used in Figure 4 gives the result shown in Figure 5:

Figure 5. Three-year average growth rates are used for stability. Energy growth rates are based on energy data from the 2025 Statistical Review of World Energy, published by the Energy Institute; GDP growth rates are based on GDP in constant 2015 US$ as published by the World Bank. [3] A major issue is the fact that the growth rate of world energy consumption is trending downward.
 Figure 6. Energy growth rates are based on data from the 2025 Statistical Review of World Energy, published by the Energy Institute.
Figure 6 shows a big upward bump starting not long after the year 2000, driven by the addition of China's inexpensive coal resources to the global energy supply. The low-cost portion of China's coal resources is now mostly depleted. In addition, we don't seem to have any other energy sources that will be available in large quantity in the near future. We have been adding wind and solar, but their impact has been small. Their impact is reflected in the total energy increases shown in Figure 6, and in the other charts above.
[4] Even worse, the rate of growth of world energy consumption per capita is trending downward. In fact, if the trend line were extended to 2025, it would seem to indicate contraction in per capita energy supplies.Figure 7. Per capita energy growth rates are based on data from the 2025 Statistical Review of World Energy, published by the Energy Institute with trend line and note by Gail Tverberg. (Same as Figure 1.)
We know that it takes energy to make physical goods. Even services require some level of physical goods and energy, such as a building to perform these services, electricity to operate tools, and the materials needed to make any tools, such as computers or scissors.
On Figure 7, note that the trend line is dropping below 0% in 2024, and even farther below 0% in 2025. This means that a smaller energy supply is available, relative to the population. If less energy supply is available, fewer physical goods relative to the population are likely to be available, as well. No one announces this, but we see the impact in many ways. For example, we discover that our daily newspaper is no longer being delivered. Or we discover that the products we see in stores are becoming increasingly flimsy. Meanwhile, young people are becoming less able to afford cars, homes, and almost everything else.
Furthermore, with limited total energy supply, international fighting about physical goods becomes more of a problem. The place we see this first is with respect to minerals. With limited energy supply and ores that are increasingly less concentrated, it is becoming difficult to extract enough materials such as uranium, rare earths, and platinum to meet the needs of all countries. Prices may temporarily spike, but they do not rise high enough, for long enough, to allow production to rise to the overall needed level.
[5] Falling interest rates push the economy along; rising interest rates act like putting brakes on the economy.Figure 8. Interest rates on 10-year Treasuries (red) and on 3-month Treasuries (blue), based on data of the Federal Reserve of St. Louis.
Interest rates play a far greater role in the economy, and in economic growth, than many people would expect. Falling interest rates between 1981 and 2022 greatly supported the economy (Figure 8). Since 2022, higher interest rates have acted like a headwind to the economy. This is a concern when it comes to the possibility that the economy is heading into economic contraction because of an inadequate supply of low-cost energy.
Another piece of the picture is the effect of the "yen carry trade." It allows international investors to borrow money at low rates in Japan, and invest this money in the United States and other countries at higher rates. The yen carry trade has been supporting international borrowing, but it now seems to be at the edge of unwinding because Japanese interest rates are now higher. With this change, it is more difficult to borrow yen at a low rate and invest the proceeds elsewhere at a higher rate. The unwinding of the yen carry trade could push US interest rates up, regardless of what the Federal Reserve tries to do.
[6] Interest payments on US government debt are already getting to be a problem.US government debt is now close to $38 trillion, and total interest payments have recently risen because interest rates are no longer near zero. Total payments now exceed $1 trillion per year.
 Figure 9. US federal government interest payments through June 30, 2025.
The US Congressional Budget Office (CBO) is now concerned about the high level of interest payments. When interest rates were very low in the 2008 to 2020 period (Figure 8), it was possible to add debt without substantially raising the amount of interest to be paid. But now, with higher interest rates and the debt balance increasing, interest payments have become very high, to the point where they even exceed defense spending. It becomes difficult to raise taxes enough to cover both interest outlays and other funding shortfalls.
 Figure 10. Chart by CBO showing annual deficit in two pieces-(a) the amount simply from spending more than available income, and (b) interest on outstanding debt. Source.
I talk more about some of these issues in post called "Energy limits are forcing the economy to contract." Clearly, if the US economy is being forced to contract, it is very difficult for it to be a hugely successful growth story.
[7] Which countries of the world seem likely to be most resilient against energy limits?If we believe Reinhart and Rogoff, the countries that would be most resistant to collapse would be the countries that have been growing most rapidly, in recent years. Figure 11 shows a listing of the most rapidly growing countries during the 2019 - 2024 period, based on World Bank GDP data.
 Figure 11. Listing based on World Bank GDP data (in 2015 US$) for the years 2019 to 2024. The average growth rate of these countries was 4.9% per year or higher.
The only country on Figure 11 that is an "Advanced Economy" (member of the OECD) is Ireland. Ireland is known for its pharmaceutical exports and for its unusually low taxes on corporations. Many companies choose to domicile in Ireland to take advantage of the country's low tax rates.
All the other countries are, in some sense, "less advanced economies." Wages are likely lower, giving them an edge in extracting resources and in manufacturing, and then selling the goods to more advanced countries. Some of these countries may have been given loans by the IMF or China to help them develop their resources.
China and India are both known for their coal use; historically, coal has been an inexpensive energy product, allowing countries to make goods inexpensively, for export. The only country listed whose growing GDP is based on oil extraction seems to be Guyana in South America. Its oil extraction started very recently.
 Figure 12. Listing based on World Bank GDP data (in 2015 US$) for the years 2019 to 2024. Average growth rates were strictly less than 0% for shrinking economies, and between 0% and 0.5% (inclusive) for slowly growing economies.
On Figure 12, the list of shrinking economies reads like a list of sad situations that we have read about in the news, way too many times. Many of the countries have recently been in wars or similar situations. None of the countries are Advanced Economies. A few of the countries (Iraq, Libya, Trinidad and Tobago, South Sudan, Venezuela) are oil producing countries.
With respect to the list of slowly growing countries, shown on the right side of Figure 12:
- Austria, Czechia, Estonia, Finland, Germany, and Japan are all Advanced Economies with inadequate energy supplies of their own.
- Puerto Rico is an island territory that has recently had debt problems.
- Thailand is, in some sense, a dropout from the rapidly growing nations of Southeast Asia. My impression when I visited Thailand earlier this year was that a great deal of overbuilding had taken place. Excuses for more debt had mostly stopped.
- Argentina is an oil-producing country with difficulties.
- China tightened its grip on Hong Kong in 2019, leading to much slower economic growth. Presumably, there were underlying issues that caused this tightened grip.
- South Africa has both coal supply problems and inadequate water supplies.
I think that we are already in a world of "not enough to go around," because resource limits are leading to an inadequate supply of finished goods and services for the world economy as a whole. Some countries are already being squeezed out, particularly the countries listed as having "shrinking GDP" in Figure 12. I expect that, over time, an increasing number of countries will be added to the shrinking GDP list. The outcomes may be as bad as seem to be happening to the economies that are shrinking today.
History shows that governments of shrinking countries tend to be overturned by their citizens, or they may collapse on their own. If collapse happens in either of these ways, governmental promises of pensions, and of guarantees on bank accounts, are likely to disappear. Even if the current governments can be maintained, countries will be forced to cut back greatly on the programs they are providing. Pensions may be cut, or they may be inflated away by hyperinflation.
Some governments today talk about possibly introducing Central Bank Digital Currencies (CBDCs). If these currencies are implemented, I would expect that they will be used to ration the increasingly limited supplies of goods and services that are available among their populations.
I do not expect that there will be a formal World War III. Instead, I think the United States is already in a cold war against practically every other country because there cannot be enough goods and services to go around. The US can't go into a formal war against China because it provides parts of the supply chains for many essential goods the US uses today. Even Europe is a competitor for essential goods. For example, the less oil Europe uses, the more oil will be available for other countries.
While new technologies such as artificial intelligence and energy recovery may eventually alleviate our energy problems, it is unlikely that such approaches will solve our problem in the near term. As a result, governments are likely to be less able to keep their promises. Historically, families or "villages" of extended kin have provided safety nets, rather than government programs. Perhaps now is a good time to be thinking about how we can move in this direction, as well.
Economists, actuaries, and others tend to make forecasts as if whatever current situation exists will continue indefinitely or will perhaps improve a bit. No one wants to consider the possibility that things will somehow change for the worse. Politicians want to get re-elected. University presidents want their students to believe that their degrees will be truly useful in the future. Absolutely no one wants to hear unfavorable predictions.
The issue I see is that many promises were made during the period between the end of World War II and 1973, when oil prices were very low, and most people assumed that oil supply could grow endlessly. No one stopped to think that this was a temporary situation that likely could not be repeated. If things didn't work out as planned, debt bubbles could bring down the economy. This was a heading I used in my talk at the recent Minnesota Degrowth Summit:
 Figure 1. Text: Our economy has been built as if a growing supply of $20 oil (EROI of 50 - 100) would continue! Simply add more debt if this isn't true.
In this post, I will provide a few highlights from my recent talk. I also provide a link to a PDF of my Degrowth Summit talk and a link to a Vimeo recording of the summit, which includes a transcript. To access the transcript and an outline of the timings of the various talks, scroll down on the front page of the recording. Joseph Tainter spoke first; there was a recorded section showing clips by other speakers that only online viewers saw, and I spoke last (starting at about 1:55 on the video).
- - - - - - - - - - - - - - - - - -
Between 1920 and 1970, US oil supply grew rapidly. The early oil was easy to extract and close to customers wanting to purchase it. There had been warnings from physicists (including, most notably, M. King Hubbert) that this could not go on indefinitely, but most people assumed that any obstacles were far in the future.
 Figure 2
Of course, there were other countries producing oil besides the US at that time, so it was possible to purchase imported oil. The US still had some oil it could produce, but it tended to require more complex operations. For example, some of the oil was in Alaska. Bringing this oil to market required working in a cold climate, laying a long pipeline, and using ships to transport the oil to locations with refineries.
Low oil prices were very beneficial to the economy, for as long as they lasted.
 Figure 3
We don't appreciate how important low-cost food is to our personal finances. If food purchases amounts to, say, 50% of available income, necessities such as clothing and housing would take nearly all our income. There would be little left over for optional items. On the other hand, if purchases of food require only 5% to 10% of available pay, there would much more likely be money left over for discretionary purchases, such as buying a vehicle or paying for school tuition for a child.
Oil and other energy products are like food for the economy. During the period when oil prices were very low, there was sufficient margin for purchasing all kinds of "extras," such as the items listed in Figure 4 below.
 Figure 4
In the low-priced oil era, small businesses were sufficient for many types of operations. There was little need for a deep organizational hierarchy, or for advanced energy-saving versions of manufactured devices. Most goods used in the US were made in the US.
 Figure 5
Once the economy started to need more complexity, things began to change.
 Figure 6
The economy needs a strong middle class to maintain the buying power needed to purchase goods such as vehicles, motorcycles, and new homes, to keep the price of oil up. If the middle class starts to disappear, or if young people start earning less than their parents did at the same age (adjusted for inflation), then it becomes difficult to keep the prices of oil and other energy products up. Prices must be both high enough for producers and low enough for consumers.
 Figure 7
Recessions took place when oil prices rose. Governments found that they needed to bail out their economies with more debt when oil prices rose. Since 2008, the ratio of US debt to GDP has skyrocketed. Quite a bit of the added debt has been to pay for programs for poor people and the elderly.
 Figure 8. Chart by the Federal Reserve Bank of St. Louis, showing the ratio of US public debt to GDP. The ratios would have been even higher if internal debt, such as debt owed to pay for Social Security benefits, were included.
The current level of debt of the US government is widely viewed as being too high. One analysis suggests that if the ratio of government debt to GDP exceeds 90%, economic growth is inhibited. The US debt to GDP ratio is now 120% on the basis shown, which is well above the 90% threshold. One concern is that interest payments on debt already exceed the amount the US spends on defense each year. Taxes need to rise, simply to pay the interest on the debt.
Growing debt, particularly during the Stagflation Stage, is one of the issues mentioned by researchers into so-called secular cycles, which are long-term cycles that take centuries to complete. In the book Secular Cycles by Peter Turchin and Sergey Nefedov, a group of people somehow obtain possession of an area of land (often by cutting down trees or winning a war) that allows the population of the group to temporarily surge. When the population reaches the carrying capacity of the area, population growth greatly slows in a period referred to as Stagflation. Wage and wealth disparity become more of a problem, as does debt.
Eventually, according to Turchin and Nefedof's study examining eight societies, populations tended to collapse over long periods, ranging from 20 to 50 years. Such cycles are closely related to the periods of growth and collapse analyzed in Prof. Joseph Tainter's book, "The Collapse of Complex Societies."
 Figure 9. This chart is my chart, using information from the book Secular Cycles. The extent of the decline of the in population during the Crisis Period is quite variable.
The time ahead looks worrying, if my analysis is correct.
 Figure 10
 Figure 11
 Figure 12
A few comments for my regular readers:
- My presentation included 51 slides. Look at the PDF to see the full presentation.
- Even though I didn't mention it, having a rapidly growing energy supply at a very high EROI would not be sufficient to forestall collapse indefinitely. Other issues would emerge. Population would rise higher, and pollution would be more of a problem. Eventually, the system would still reach a limit and tend to collapse.
- I only included EROI because I thought a few people would already be aware of the concept. I didn't define it or talk about it.
- My analysis seems to suggest that extenders of fossil fuels, such as wind, solar, and nuclear, need to have very high EROIs. But even with high EROIs, they are unlikely to be helpful for very long because the system would still tend to reach its limits.


