This report belongs to a weekly series summarising the Covid situation across the UK's home nations and other countries.
Thanks for reading Seeing The Forest for the Trees! Subscribe for free to receive new posts and support my work.
This week's report covers the latest weekly indicators of respiratory illness activity for England, along with the most recent data for Scotland, Wales, and Northern Ireland. The report also presents the data on Covid levels in selected countries in Europe and North America.
USA charts will be updated on Friday, February 20 to reflect the latest available data.
Summary.
Once again the main Covid indicators in England, Scotland, Wales, and Northern Ireland stayed low, indicating a low level of risk.
Flu activity levels continued to fall across all home nations, indicating that this year's Flu season is over.
In England, all main indicators of Covid activity remained well within the baseline activity level. Flu and RSV activity has also fallen and is circulating at low activity levels.
In Scotland, all indicators for Covid remained stable and at low levels. Positivity rates and hospital admissions for Flu and RSV have fallen significantly from the recent peak and are also at low levels.
In the past week, Covid hospital admissions in Wales stayed at low levels. Flu admissions continued to fall this week and are now at low activity levels.
In Northern Ireland, Covid activity increased slightly across most surveillance indicators but remained at low levels. Flu and RSV activity has fallen across all indicators.
Covid levels in wastewater remained low in most European countries that still report this data.
Covid activity in the USA for week ending February 7 remained stable this week and at a moderate level of activity nationwide, though there are significant variations from state to state. Flu activity continued to fall, but is still high in a few states.
The NHS Spring 2026 Covid booster campaign is set to run from April 13 to June 30, 2026 and will use the same eligibility criteria as the Autumn 2025 campaign.
As always, it's important to remember that the risk of hospitalisation from Covid increases significantly with age and for the clinically vulnerable. Therefore, it is important to take appropriate measures such as self-isolating when experiencing Covid symptoms and enhancing ventilation or wearing masks whenever possible.
Status of main respiratory diseases in England.
This section starts with the latest data on test positivity rates for Covid in England. It's important to note that positivity is different from prevalence, which reflects the overall percentage of Covid cases in the general population. Appendix 1 offers a more detailed explanation of the distinction.
The following chart shows the test positivity rate for all Covid tests taken mapped against the UKHSA activity thresholds. The thresholds are based on the historical trend for Covid test positivity and, consequently, represent a relative risk. More details on this approach can be found in the Guide to Covid Surveillance Metrics.
The chart shows that the test positivity rate remained stable this week and continues to be well below the baseline level, indicating a low risk. Positivity rates remained low in all regions, with only slight differences between them.
The next chart highlights four key indicators of Covid in hospitals: weekly Emergency Department visits for Covid-like symptoms, test positivity rates among patients with respiratory issues, hospital admission rates, and admission rates for intensive care.
All key hospital indicators for Covid activity remain at historically low levels indicating a low level of risk.
The following chart shows hospital admission rates per 100,000 for the three main respiratory viruses. Covid admissions are at historic lows, while Flu and RSV cases have peaked and are at low activity levels. Both remain slightly higher than Covid, suggesting they currently pose a bit more of a risk.
While hospital admissions have fallen significantly, they still differ by age. Below are the hospital admission rates per 100,000 people by age group for Covid, Flu, and RSV for the week ending February 15, 2026.
The chart shows that the risk of hospitalisation remains highest among the very youngest age group and the elderly for both Flu and RSV. While current hospital admissions for Covid are slightly lower, the elderly remain more likely to be hospitalised.
Human metapneumovirus (hMPV) positivity rates also fell and are now just within the low level of activity.
Scotland weekly hospital admissions and test positivity
Public Health Scotland (PHS) continue to publish weekly data on Covid hospital admissions and test positivity as well as wastewater monitoring data. The latest Viral respiratory diseases in Scotland surveillance report can be accessed here.
The following panel chart presents the most recent data for Covid levels in wastewater in blue, weekly Covid test positivity shown in red, Covid hospital admissions depicted in orange, and beds occupied by Covid patients in brown.
Once again, all Covid indicators in Scotland stayed low this week, suggesting the risk from the virus remains low.
The final chart in this section compares the test positivity rates for hospital patients with respiratory symptoms for Covid, Flu, and RSV. Flu positivity rates have continued to fall to baseline levels and are now lower than for Covid.
This week, Covid test positivity fell from 4.2 to 3.7% and activity remained at baseline levels overall. Activity is higher in those aged 1-14 compared to other age groups, although there are indications that these are decreasing. Hospitalisations have increased slightly in recent weeks with just over a half of Covid admissions being in children aged 0-14 yrs.
Laboratory-confirmed Flu cases remained at baseline activity , with test positivity remaining stable or decreasing in all age groups. Hospital admissions decreased, with individuals aged 75 years continuing to account for the highest proportion at 36.2%.
RSV cases and test positivity continued to fall and remained at a low activity level overall. Hospital admissions also decreased from 118 to 79, with the highest proportion reported in the over 75 age group (25.3%).
Wales Covid hospital admissions.
During the winter season, Public Health Wales publishes a weekly respiratory infection report, which is available here. The following chart provides the latest trend for weekly hospital admissions for the main respiratory viruses in Wales up to week ending February 15, 2026.
Covid hospital admissions have stayed fairly steady over the past few months and remain low. Flu cases needing hospitalisation continue to fall and are now lower than for Covid. RSV admissions also fell and are approaching low levels.
This weeks Weekly Acute Respiratory Infection Report shows that Flu activity has returned to low levels. Confirmed case numbers have decreased in the current week, as has test positivity.
In addition, GP consultations for influenza-like illness remained stable and are well below the 'low intensity' threshold. Respiratory Syncytial Virus (RSV) activity is decreasing overall and is now at low intensity levels. Covid case numbers have remained broadly stable in recent weeks.
Status of main respiratory diseases in Northern Ireland.
Public Health Northern Ireland publish a weekly surveillance report on influenza, respiratory syncytial virus (RSV), and Covid providing an overview of these infections within Northern Ireland.
Covid activity increased across the majority of surveillance indicators but activity levels remain at low levels. Flu activity also has fallen across all surveillance indicators and is now at baseline levels. RSV activity fell across the majority of indicators and is now circulating at low levels.
The following chart shows the test positivity rates in Northern Ireland for the main respiratory illnesses — Flu, RSV, and Covid and RSV. Shading represents 95% confidence intervals.
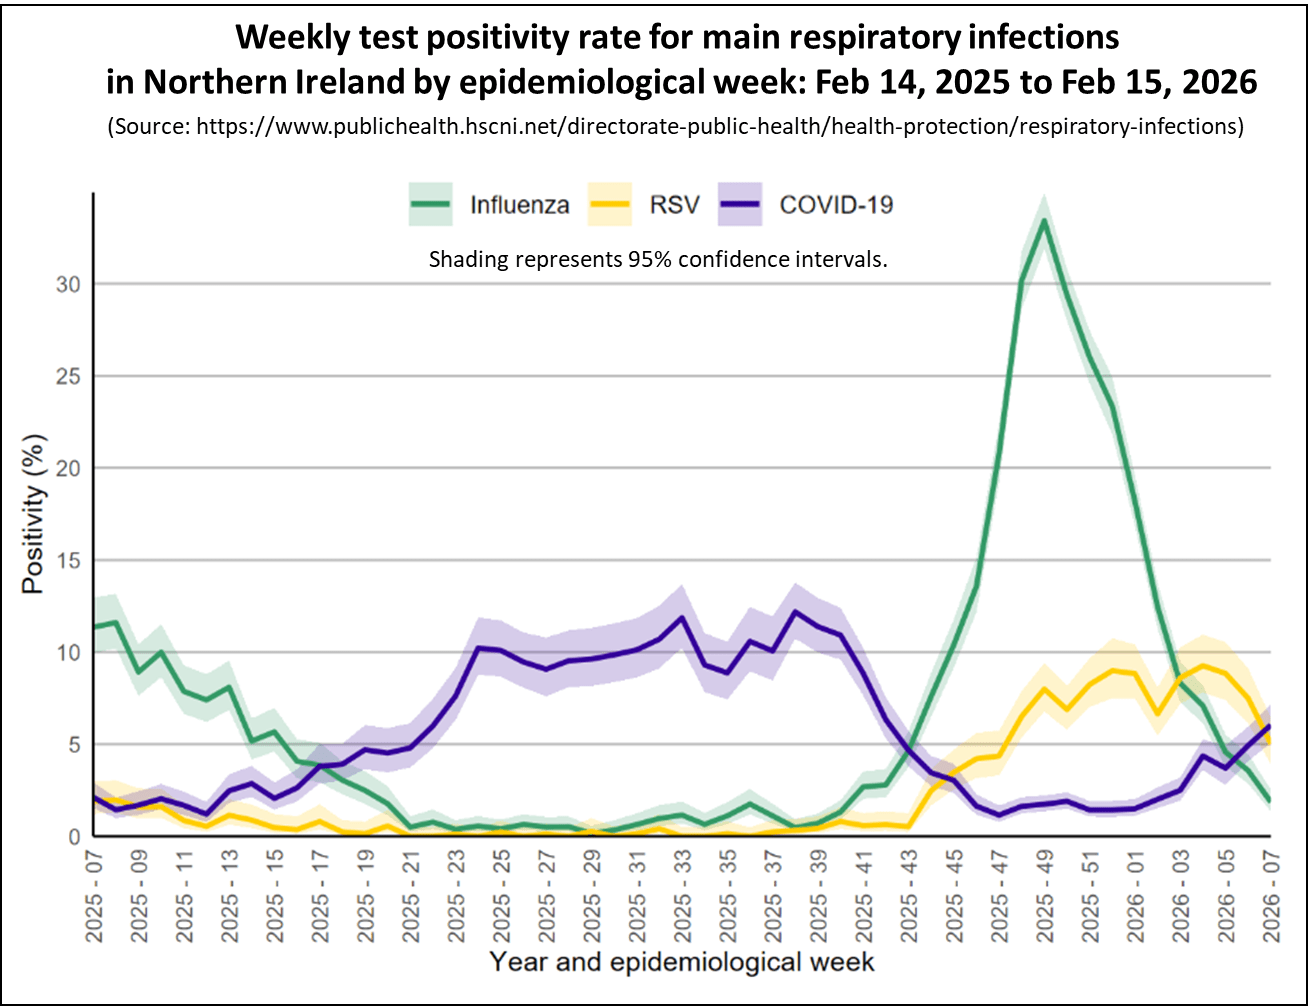
The chart shows that the Covid test positivity rate for patients with respiratory illnesses, marked in blue, again increased slightly this week but stayed relatively low. Covid activity also increased across the majority of all other surveillance indicators but remains low.
Flu test positivity, shown in green, has continued to fall along with all other surveillance indicators indicating that the winter Flu wave is over.
Covid Levels in Europe and North America.
This section looks at the latest data on Covid activity in Europe and North America. Covid levels have fallen in most countries across these regions and remain lower than those observed during earlier waves.
The following chart shows latest levels of Covid up to week ending February 12, 2026 as measured by monitoring wastewater in a number of European countries that still publish this information.
This week, Covid levels in wastewater remained low in most European countries that still share this data, with only France showing a slight increase. Note that no update was provided for Sweden this week.
The next release of data for the USA is on Friday, February 20 when this section will be updated to provide the latest information.
As of week ending February 7, 2026 Covid activity in the USA remained stable, though the situation varies across different parts of the country.
The following chart shows the weekly trend for the national key Covid indicators covering wastewater activity levels, percent of emergency department visits due to Covid, test positivity, and the hospital admission rate in the USA.
The panel chart shows Covid levels in wastewater remained stable and are at moderate activity for the week ending February 7, 2026. Emergency department visits and hospital admissions fell slightly, while Covid test positivity remained broadly unchanged.
Wastewater analysis shows that Covid levels are highest Mid West and Northeast states, while staying relatively low in the South and West regions, as illustrated in the following map. Each state is coloured based on activity levels, ranging from very high (dark red) to very low (light green), with grey indicating no data available. States with increasing activity levels are marked with cross-hatching.
The interactive map lets you hover over any state using your cursor to see more details about wastewater viral activity levels. It shows data from states nationwide for the week ending February 7, 2026.
The next chart compares the percentage of Emergency Department visits caused by Covid and Flu. It indicates that while activity for Covid is moderate, Flu activity has has continued to fall and is now at a low level nationally.
However, Flu activity varies across states, with cases increasing in 21 and decreasing in 27. While most states are experiencing moderate or low activity levels, six are still facing high or very high activity, as shown on the interactive map.
Finally, the latest data from Canada, up to February 7, 2026, shows that Covid wastewater levels are holding steady at moderate levels, flu activity has dropped to low, while RSV activity remained broadly stable.
In conclusion
Although the amount of data currently being published is reduced, the information available for all home nations show that Covid activity is relatively low. Flu activity had fallen from its recent peak and is now at very low levels.
Covid levels in wastewater are low across European countries In the USA, Covid activity also fell slightly but remains at high levels in a some states. Flu activity in both the USA and Canada is falling to low levels
As always, if you have any comments on this Covid Situation Report or suggestions for topics to cover, please post a message below.
Thanks for reading Seeing The Forest for the Trees! Subscribe for free to receive new posts and support my work.
Appendix 1. Test positivity rates and prevalence
Positivity rates are derived from the results of hospital laboratory tests conducted on patients exhibiting symptoms of respiratory diseases. Test positivity is the percentage of patients who test positive for Covid of the total number of patients tested. Since the individuals tested for this measure are not a representative sample of the general population it differs from prevalence, which is derived from a representative sample of the population.
It is reasonable to avoid hurt after such a big betrayal, writes advice columnist Eleanor Gordon-Smith, but don't mistake isolation for safety
Read more Leading questions
I was in a relationship for 26 years, married for 17, and my husband had an affair. It was hidden, long term and denied until discovery. I divorced him but that was delayed and I had to live with him for a further two years. I spent a year alone in my new house with my now adult sons. Now I am a little over a year into a new relationship and suddenly panicking about it. I'm scared to go forward. I'm not sure I can commit to long term again, and if I see him looking at other women (we work together in a predominantly female workplace), I panic! I'm older than him by nine years and I feel like I want to end things to prevent getting hurt. But then I feel I'm being cowardly. How can I stop going down this road in my head?
Eleanor says: On behalf of everyone everywhere, let me say: what a schmuck thing for your husband to do. That is such a big betrayal. And the cruelty you're living through now is that as well as teaching you to be mistrustful of others, betrayal on that magnitude teaches you to be unsure of yourself. If I misread things once …
Continue reading...Andreas Graf lived without screens and no idea of the date or time. The conditions were often brutal - but he found kindness and friendship as he rode
In April 2022, Andreas Graf set off on his bike from his home in Norway. His dream was to cycle to India. A week later, having reached Sweden, it was already becoming more of a nightmare. "It was pouring with rain and I was lying in my tent in my half-wet sleeping bag and I was like, I could be in my very cosy Oslo apartment," he says. "I had this good life, a career, a partner, and I had left everything behind."
He was 31. Friends were settling down. Graf had a well-paid job in industrial engineering, but was still renting in a houseshare. "I had started to think about whether to make a financially reasonable and sensible decision, or do something else. I went for option two."
Continue reading...