This report belongs to a weekly series summarising the Covid situation across the UK's home nations and other countries.
Thanks for reading Seeing The Forest for the Trees! Subscribe for free to receive new posts and support my work.
This week's report covers the latest weekly indicators of respiratory illness activity for England, along with the most recent data for Scotland, Wales, and Northern Ireland. The report also presents the data on Covid levels in selected countries in Europe and North America.
USA charts will be updated on Friday, February 20 to reflect the latest available data.
Summary.
Once again the main Covid indicators in England, Scotland, Wales, and Northern Ireland stayed low, indicating a low level of risk.
Flu activity levels continued to fall across all home nations, indicating that this year's Flu season is over.
In England, all main indicators of Covid activity remained well within the baseline activity level. Flu and RSV activity has also fallen and is circulating at low activity levels.
In Scotland, all indicators for Covid remained stable and at low levels. Positivity rates and hospital admissions for Flu and RSV have fallen significantly from the recent peak and are also at low levels.
In the past week, Covid hospital admissions in Wales stayed at low levels. Flu admissions continued to fall this week and are now at low activity levels.
In Northern Ireland, Covid activity increased slightly across most surveillance indicators but remained at low levels. Flu and RSV activity has fallen across all indicators.
Covid levels in wastewater remained low in most European countries that still report this data.
Covid activity in the USA for week ending February 7 remained stable this week and at a moderate level of activity nationwide, though there are significant variations from state to state. Flu activity continued to fall, but is still high in a few states.
The NHS Spring 2026 Covid booster campaign is set to run from April 13 to June 30, 2026 and will use the same eligibility criteria as the Autumn 2025 campaign.
As always, it's important to remember that the risk of hospitalisation from Covid increases significantly with age and for the clinically vulnerable. Therefore, it is important to take appropriate measures such as self-isolating when experiencing Covid symptoms and enhancing ventilation or wearing masks whenever possible.
Status of main respiratory diseases in England.
This section starts with the latest data on test positivity rates for Covid in England. It's important to note that positivity is different from prevalence, which reflects the overall percentage of Covid cases in the general population. Appendix 1 offers a more detailed explanation of the distinction.
The following chart shows the test positivity rate for all Covid tests taken mapped against the UKHSA activity thresholds. The thresholds are based on the historical trend for Covid test positivity and, consequently, represent a relative risk. More details on this approach can be found in the Guide to Covid Surveillance Metrics.
The chart shows that the test positivity rate remained stable this week and continues to be well below the baseline level, indicating a low risk. Positivity rates remained low in all regions, with only slight differences between them.
The next chart highlights four key indicators of Covid in hospitals: weekly Emergency Department visits for Covid-like symptoms, test positivity rates among patients with respiratory issues, hospital admission rates, and admission rates for intensive care.
All key hospital indicators for Covid activity remain at historically low levels indicating a low level of risk.
The following chart shows hospital admission rates per 100,000 for the three main respiratory viruses. Covid admissions are at historic lows, while Flu and RSV cases have peaked and are at low activity levels. Both remain slightly higher than Covid, suggesting they currently pose a bit more of a risk.
While hospital admissions have fallen significantly, they still differ by age. Below are the hospital admission rates per 100,000 people by age group for Covid, Flu, and RSV for the week ending February 15, 2026.
The chart shows that the risk of hospitalisation remains highest among the very youngest age group and the elderly for both Flu and RSV. While current hospital admissions for Covid are slightly lower, the elderly remain more likely to be hospitalised.
Human metapneumovirus (hMPV) positivity rates also fell and are now just within the low level of activity.
Scotland weekly hospital admissions and test positivity
Public Health Scotland (PHS) continue to publish weekly data on Covid hospital admissions and test positivity as well as wastewater monitoring data. The latest Viral respiratory diseases in Scotland surveillance report can be accessed here.
The following panel chart presents the most recent data for Covid levels in wastewater in blue, weekly Covid test positivity shown in red, Covid hospital admissions depicted in orange, and beds occupied by Covid patients in brown.
Once again, all Covid indicators in Scotland stayed low this week, suggesting the risk from the virus remains low.
The final chart in this section compares the test positivity rates for hospital patients with respiratory symptoms for Covid, Flu, and RSV. Flu positivity rates have continued to fall to baseline levels and are now lower than for Covid.
This week, Covid test positivity fell from 4.2 to 3.7% and activity remained at baseline levels overall. Activity is higher in those aged 1-14 compared to other age groups, although there are indications that these are decreasing. Hospitalisations have increased slightly in recent weeks with just over a half of Covid admissions being in children aged 0-14 yrs.
Laboratory-confirmed Flu cases remained at baseline activity , with test positivity remaining stable or decreasing in all age groups. Hospital admissions decreased, with individuals aged 75 years continuing to account for the highest proportion at 36.2%.
RSV cases and test positivity continued to fall and remained at a low activity level overall. Hospital admissions also decreased from 118 to 79, with the highest proportion reported in the over 75 age group (25.3%).
Wales Covid hospital admissions.
During the winter season, Public Health Wales publishes a weekly respiratory infection report, which is available here. The following chart provides the latest trend for weekly hospital admissions for the main respiratory viruses in Wales up to week ending February 15, 2026.
Covid hospital admissions have stayed fairly steady over the past few months and remain low. Flu cases needing hospitalisation continue to fall and are now lower than for Covid. RSV admissions also fell and are approaching low levels.
This weeks Weekly Acute Respiratory Infection Report shows that Flu activity has returned to low levels. Confirmed case numbers have decreased in the current week, as has test positivity.
In addition, GP consultations for influenza-like illness remained stable and are well below the 'low intensity' threshold. Respiratory Syncytial Virus (RSV) activity is decreasing overall and is now at low intensity levels. Covid case numbers have remained broadly stable in recent weeks.
Status of main respiratory diseases in Northern Ireland.
Public Health Northern Ireland publish a weekly surveillance report on influenza, respiratory syncytial virus (RSV), and Covid providing an overview of these infections within Northern Ireland.
Covid activity increased across the majority of surveillance indicators but activity levels remain at low levels. Flu activity also has fallen across all surveillance indicators and is now at baseline levels. RSV activity fell across the majority of indicators and is now circulating at low levels.
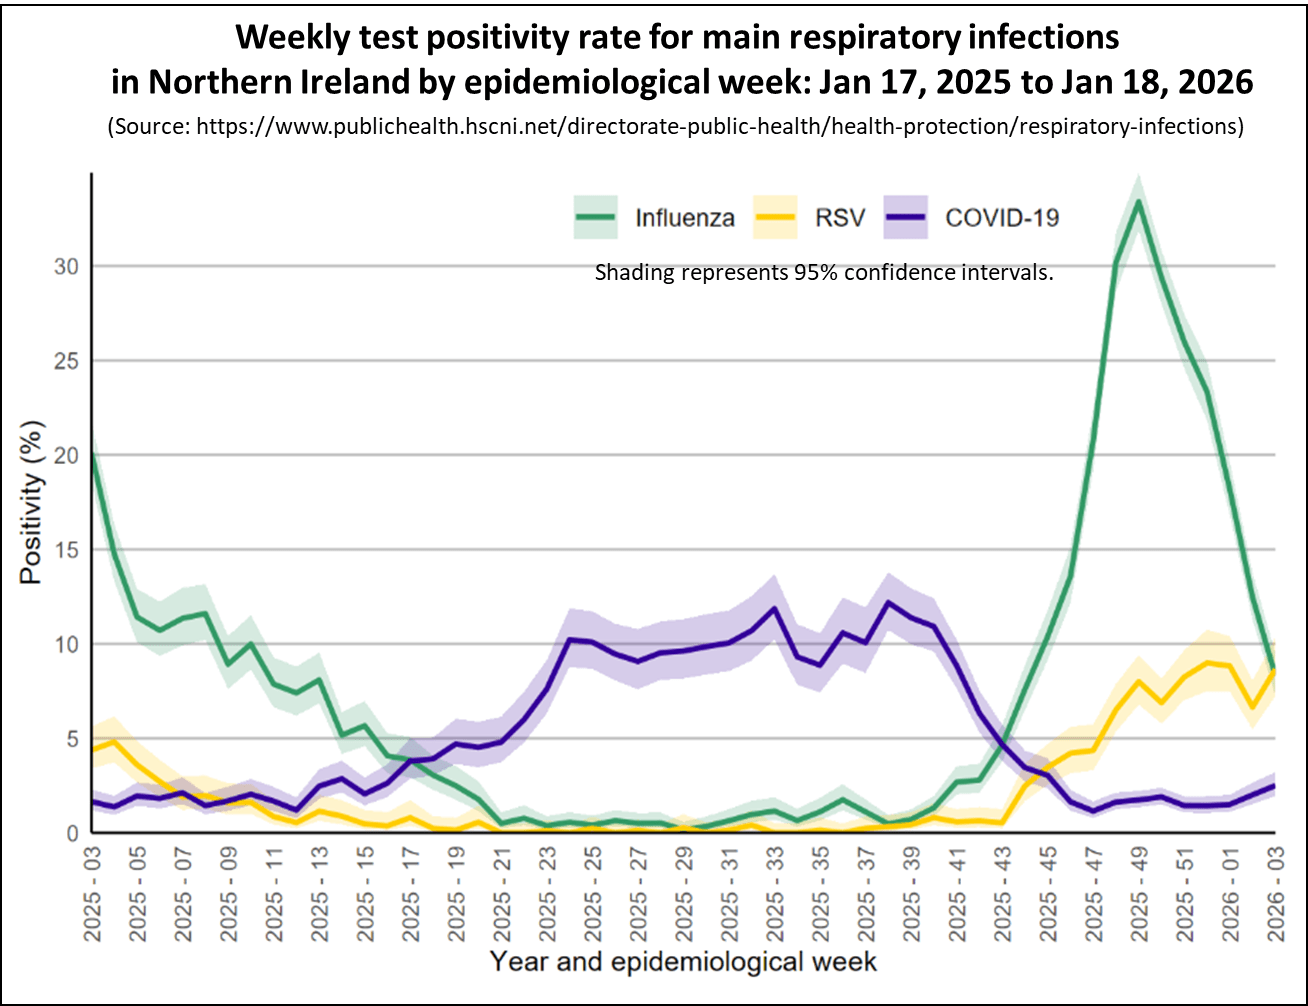
The following chart shows the test positivity rates in Northern Ireland for the main respiratory illnesses — Flu, RSV, and Covid and RSV. Shading represents 95% confidence intervals.
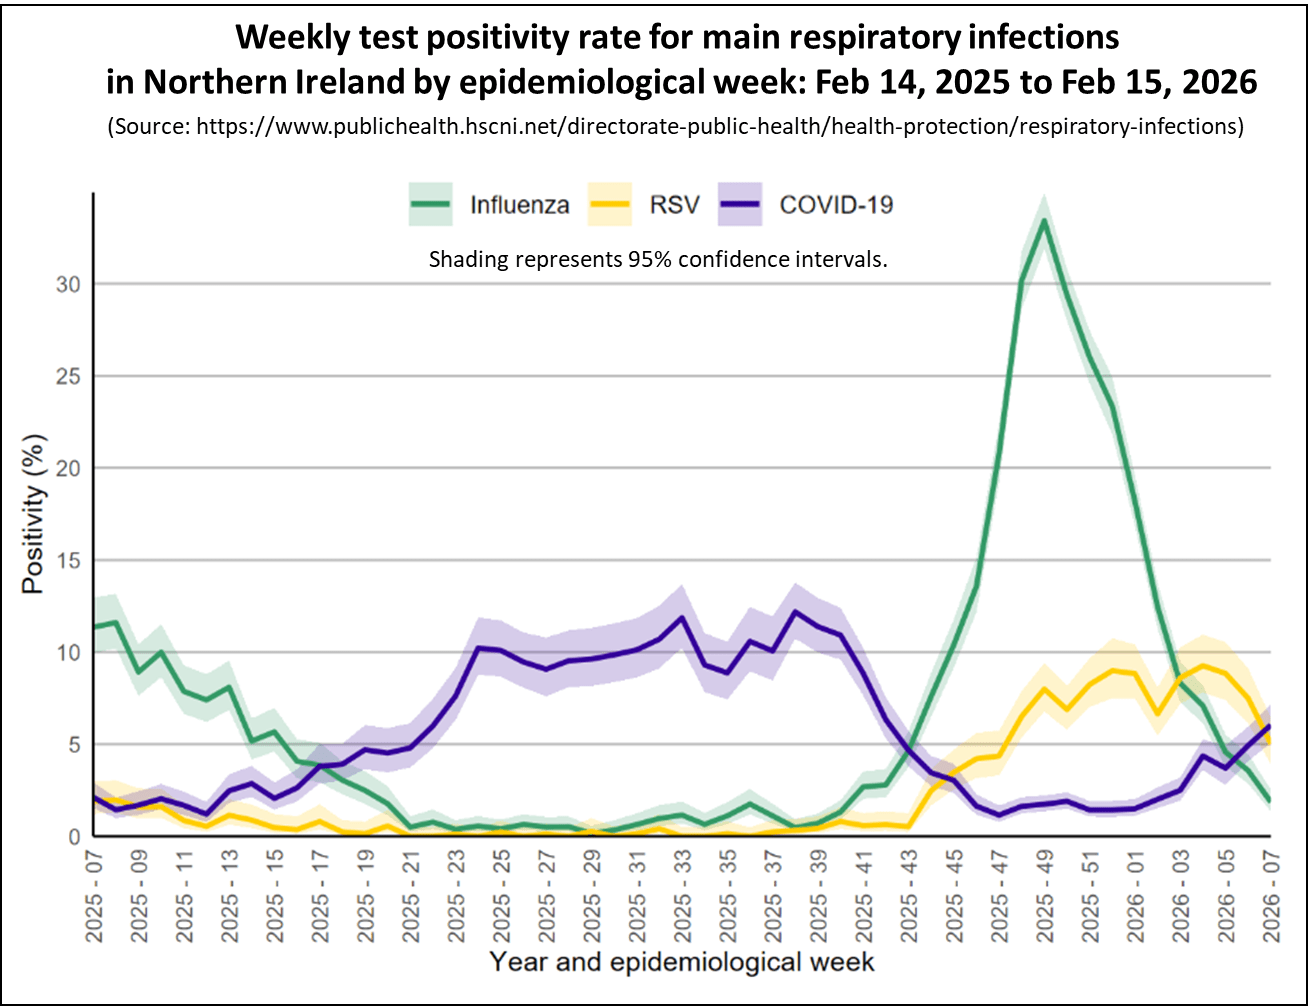
The chart shows that the Covid test positivity rate for patients with respiratory illnesses, marked in blue, again increased slightly this week but stayed relatively low. Covid activity also increased across the majority of all other surveillance indicators but remains low.
Flu test positivity, shown in green, has continued to fall along with all other surveillance indicators indicating that the winter Flu wave is over.
Covid Levels in Europe and North America.
This section looks at the latest data on Covid activity in Europe and North America. Covid levels have fallen in most countries across these regions and remain lower than those observed during earlier waves.
The following chart shows latest levels of Covid up to week ending February 12, 2026 as measured by monitoring wastewater in a number of European countries that still publish this information.
This week, Covid levels in wastewater remained low in most European countries that still share this data, with only France showing a slight increase. Note that no update was provided for Sweden this week.
The next release of data for the USA is on Friday, February 20 when this section will be updated to provide the latest information.
As of week ending February 7, 2026 Covid activity in the USA remained stable, though the situation varies across different parts of the country.
The following chart shows the weekly trend for the national key Covid indicators covering wastewater activity levels, percent of emergency department visits due to Covid, test positivity, and the hospital admission rate in the USA.
The panel chart shows Covid levels in wastewater remained stable and are at moderate activity for the week ending February 7, 2026. Emergency department visits and hospital admissions fell slightly, while Covid test positivity remained broadly unchanged.
Wastewater analysis shows that Covid levels are highest Mid West and Northeast states, while staying relatively low in the South and West regions, as illustrated in the following map. Each state is coloured based on activity levels, ranging from very high (dark red) to very low (light green), with grey indicating no data available. States with increasing activity levels are marked with cross-hatching.
The interactive map lets you hover over any state using your cursor to see more details about wastewater viral activity levels. It shows data from states nationwide for the week ending February 7, 2026.
The next chart compares the percentage of Emergency Department visits caused by Covid and Flu. It indicates that while activity for Covid is moderate, Flu activity has has continued to fall and is now at a low level nationally.
However, Flu activity varies across states, with cases increasing in 21 and decreasing in 27. While most states are experiencing moderate or low activity levels, six are still facing high or very high activity, as shown on the interactive map.
Finally, the latest data from Canada, up to February 7, 2026, shows that Covid wastewater levels are holding steady at moderate levels, flu activity has dropped to low, while RSV activity remained broadly stable.
In conclusion
Although the amount of data currently being published is reduced, the information available for all home nations show that Covid activity is relatively low. Flu activity had fallen from its recent peak and is now at very low levels.
Covid levels in wastewater are low across European countries In the USA, Covid activity also fell slightly but remains at high levels in a some states. Flu activity in both the USA and Canada is falling to low levels
As always, if you have any comments on this Covid Situation Report or suggestions for topics to cover, please post a message below.
Thanks for reading Seeing The Forest for the Trees! Subscribe for free to receive new posts and support my work.
Appendix 1. Test positivity rates and prevalence
Positivity rates are derived from the results of hospital laboratory tests conducted on patients exhibiting symptoms of respiratory diseases. Test positivity is the percentage of patients who test positive for Covid of the total number of patients tested. Since the individuals tested for this measure are not a representative sample of the general population it differs from prevalence, which is derived from a representative sample of the population.
It is reasonable to avoid hurt after such a big betrayal, writes advice columnist Eleanor Gordon-Smith, but don't mistake isolation for safety
Read more Leading questions
I was in a relationship for 26 years, married for 17, and my husband had an affair. It was hidden, long term and denied until discovery. I divorced him but that was delayed and I had to live with him for a further two years. I spent a year alone in my new house with my now adult sons. Now I am a little over a year into a new relationship and suddenly panicking about it. I'm scared to go forward. I'm not sure I can commit to long term again, and if I see him looking at other women (we work together in a predominantly female workplace), I panic! I'm older than him by nine years and I feel like I want to end things to prevent getting hurt. But then I feel I'm being cowardly. How can I stop going down this road in my head?
Eleanor says: On behalf of everyone everywhere, let me say: what a schmuck thing for your husband to do. That is such a big betrayal. And the cruelty you're living through now is that as well as teaching you to be mistrustful of others, betrayal on that magnitude teaches you to be unsure of yourself. If I misread things once …
Continue reading...Andreas Graf lived without screens and no idea of the date or time. The conditions were often brutal - but he found kindness and friendship as he rode
In April 2022, Andreas Graf set off on his bike from his home in Norway. His dream was to cycle to India. A week later, having reached Sweden, it was already becoming more of a nightmare. "It was pouring with rain and I was lying in my tent in my half-wet sleeping bag and I was like, I could be in my very cosy Oslo apartment," he says. "I had this good life, a career, a partner, and I had left everything behind."
He was 31. Friends were settling down. Graf had a well-paid job in industrial engineering, but was still renting in a houseshare. "I had started to think about whether to make a financially reasonable and sensible decision, or do something else. I went for option two."
Continue reading...This report belongs to a weekly series summarising the Covid situation across the UK's home nations and other countries.
Thanks for reading Seeing The Forest for the Trees! Subscribe for free to receive new posts and support my work.
This week's report covers the latest weekly indicators of respiratory illness activity for England, along with the most recent data for Scotland, Wales, and Northern Ireland. The report also presents the data on Covid levels in selected countries in Europe and North America.
Charts for the USA were updated on Friday, Feb 13 to reflect the latest available data.
Summary.
This week the main Covid indicators in England, Scotland, Wales, and Northern Ireland stayed low, indicating a low level of risk.
Flu activity has continued to fall across all home nations, indicating that this year's Flu season is over. However, there's still a chance of some late seasonal activity.
In England, all main indicators of Covid activity remained well within the baseline activity level. Flu activity has fallen from its recent peak and is now circulating at low activity levels.
In Scotland, all indicators for Covid remained stable and within baseline levels though the slight rise in test positivity continued. Positivity rates and hospital admissions for Flu and RSV have fallen significantly from the recent peak and are at low levels.
In the past week, Covid hospital admissions in Wales stayed at low levels. Flu admissions continued to fall this week and are now at low activity levels.
In Northern Ireland, Covid activity increased slightly across some surveillance indicators but remained at low levels. Flu and RSV activity has fallen across all indicators.
Covid levels in wastewater remained low in most European countries that still report this data.
Covid activity in the USA remained broadly stable this week and is at a moderate level of activity nationwide, though there are significant variations from state to state. Flu activity continued to fall, but is still high in some states.
At the close of the Autumn 2025 booster campaign, coverage is highest among residents in care homes, but much lower for immunosuppressed individuals at risk. Scotland recorded the highest coverage, while Northern Ireland had the lowest.
The NHS Spring 2026 Covid booster campaign will use the same eligibility criteria as the Autumn 2025 campaign and is set to run from April 13 to June 30, 2026.
As always, it's important to remember that the risk of hospitalisation from Covid increases significantly with age and for the clinically vulnerable. Therefore, it is important to take appropriate measures such as self-isolating when experiencing Covid symptoms and enhancing ventilation or wearing masks whenever possible.
Status of main respiratory diseases in England.
This section starts with the latest data on test positivity rates for Covid in England. It's important to note that positivity is different from prevalence, which reflects the overall percentage of Covid cases in the general population. Appendix 1 offers a more detailed explanation of the distinction.
The following chart shows the test positivity rate for all Covid tests taken mapped against the UKHSA activity thresholds. The thresholds are based on the historical trend for Covid test positivity and, consequently, represent a relative risk. More details on this approach can be found in the Guide to Covid Surveillance Metrics.
The chart shows that the test positivity rate increased slightly this week and continues to be well below the baseline level, indicating a low risk. Positivity rates remained low in all regions, with only slight differences between them.
The next chart highlights four key indicators of Covid in hospitals: weekly Emergency Department visits for Covid-like symptoms, test positivity rates among patients with respiratory issues, hospital admission rates, and admission rates for intensive care.
While all key hospital indicators for Covid activity remained at historically low levels there were slight increase in the positivity rate.
The following chart shows hospital admission rates per 100,000 for the three main respiratory viruses. Covid admissions are at historic lows, while Flu and RSV cases have peaked and are now dropping to low activity levels. Both remain slightly higher than Covid, suggesting they currently pose a bit more of a risk.
While the activity levels for most respiratory viruses are falling, Human metapneumovirus (hMPV) levels increased but remained at a moderate level.
Scotland weekly hospital admissions and test positivity
Public Health Scotland (PHS) continue to publish weekly data on Covid hospital admissions and test positivity as well as wastewater monitoring data. The latest Viral respiratory diseases in Scotland surveillance report can be accessed here.
The following panel chart presents the most recent data for Covid levels in wastewater in blue, weekly Covid test positivity shown in red, Covid hospital admissions depicted in orange, and beds occupied by Covid patients in brown.
Once again, all Covid indicators in Scotland stayed low this week, suggesting the risk from the virus remains low, though there was a slight rise in test positivity for the second week in a row.
The final chart in this section compares the test positivity rates for hospital patients with respiratory symptoms for Covid, Flu, and RSV. While Flu positivity rates have continued to fall to low levels they remain higher than for Covid.
Despite influenza levels peaking earlier than expected this season, high activity has not been sustained, with continued decreases seen across all measures.
This week, Covid laboratory test positivity increased from 3.5 to 4% in week 6, though activity remained at baseline levels. Activity remains higher in those aged 1-14 compared to other age groups. Hospitalisations remained stable.
Flu cases remained at baseline activity overall, though with an increase in test positivity in those aged 5-14. Hospital admissions remained stable, with individuals aged 75 years and older accounting for 29.4% of admissions.
RSV cases continued to fall, remaining at a low activity level overall. Hospital admissions due to RSV also fell from 142 to 109, with the highest proportion reported in the 1-4 age group (33%).
Wales Covid hospital admissions.
During the winter season, Public Health Wales publishes a weekly respiratory infection report, which is available here. The following chart provides the latest trend for weekly hospital admissions for the main respiratory viruses in Wales up to week ending Feb 8, 2026.
Covid hospital admissions have stayed fairly steady over the past few months and remain very low. Flu cases needing hospitalisation continue to fall and are now lower than for Covid. RSV admissions also fell and are approaching low levels.
This weeks Weekly Acute Respiratory Infection Report shows that Flu activity has returned to low levels. Confirmed case numbers have decreased in the current week, as has test positivity.
In addition, GP consultations for influenza-like illness remained stable and are well below the 'low intensity' threshold. Respiratory Syncytial Virus (RSV) activity is decreasing overall but remains at medium intensity levels. Covid case numbers have remained broadly stable in recent weeks.
Status of main respiratory diseases in Northern Ireland.
Public Health Northern Ireland publish a weekly surveillance report on influenza, respiratory syncytial virus (RSV), and Covid providing an overview of these infections within Northern Ireland.
Covid activity fell across all surveillance indicators and remains at low levels. Flu activity also has fallen across all surveillance indicators and is now at low levels, while RSV activity remained stable across the majority of surveillance indicators and is circulating at moderate levels.
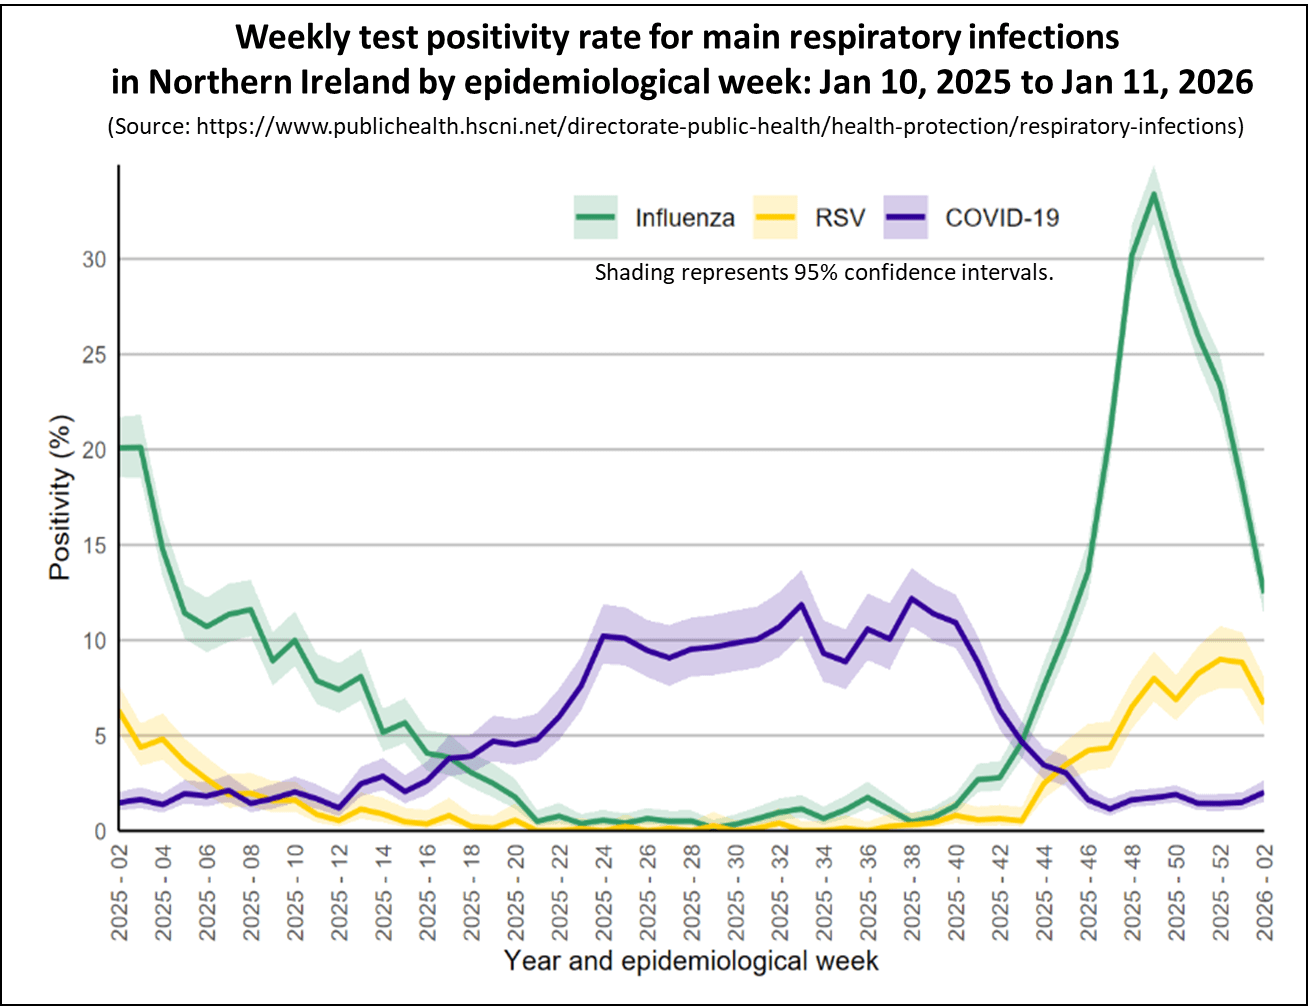
The following chart shows the test positivity rates in Northern Ireland for the main respiratory illnesses — Flu, RSV, and Covid and RSV. Shading represents 95% confidence intervals.
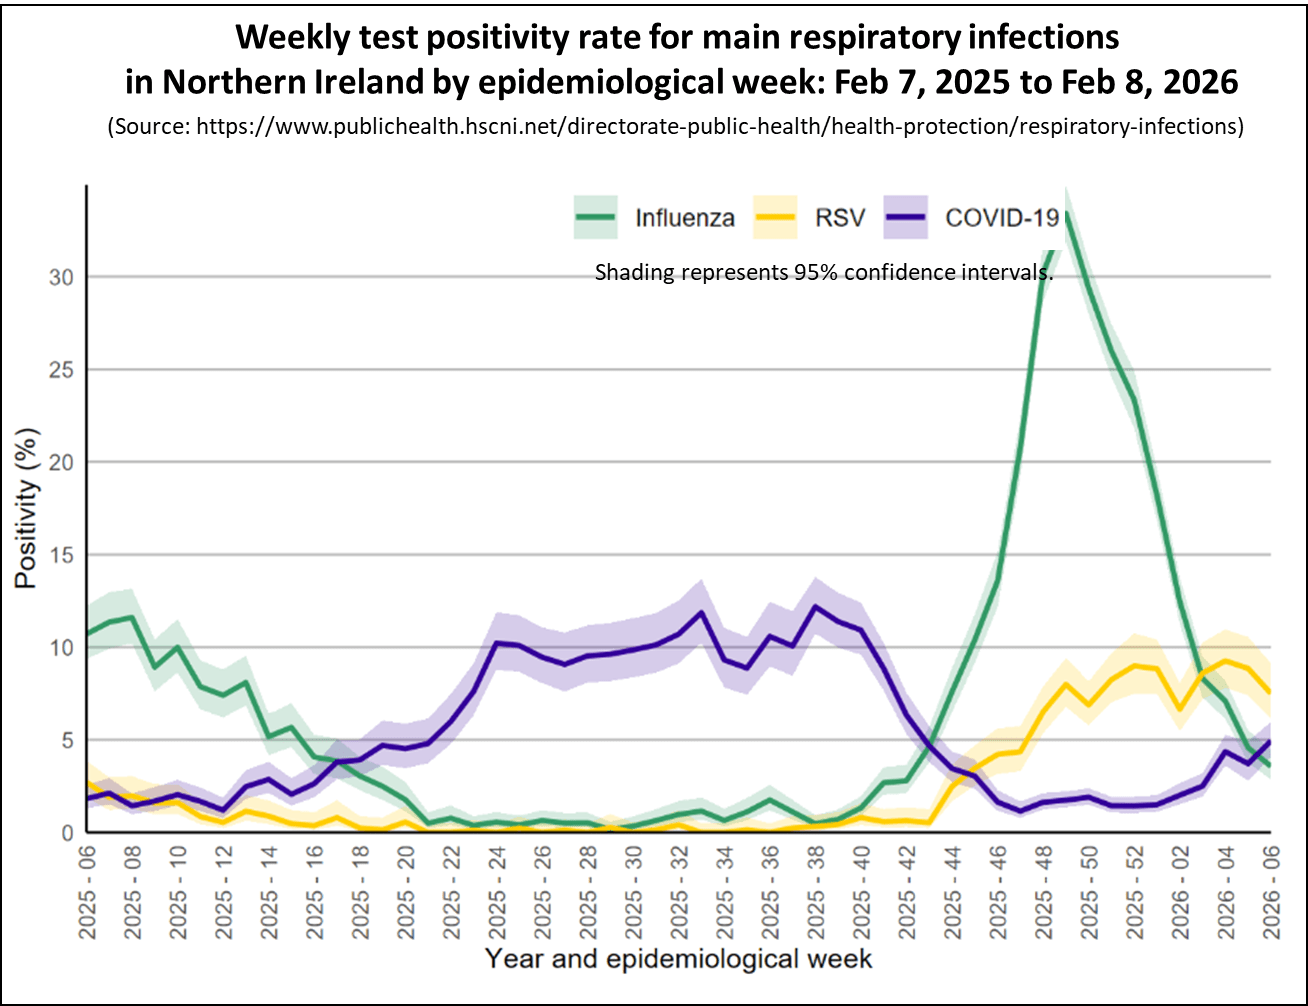
The chart shows that the Covid test positivity rate for patients with respiratory illnesses, marked in blue, increased slightly this week and stayed relatively low. Covid activity increased across the majority of surveillance indicators but remains low.
Flu test positivity, shown in green, has continued to fall along with all other surveillance indicators indicating that the winter Flu wave is over.
Covid Levels in Europe and North America.
This section looks at the latest data on Covid activity in Europe and North America. Covid levels have fallen in most countries across these regions and remain lower than those observed during earlier waves.
The following chart shows latest levels of Covid up to week ending February 5, 2026 as measured by monitoring wastewater in a number of European countries that still publish this information.
This week, Covid levels in wastewater remained low in most European countries that still share this data, with only Denmark staying at moderate levels.
Updated on Friday, February 13 to reflect the latest published data.
As of week ending February 7, 2026 Covid activity in the USA remained stable, though the situation varies across different parts of the country.
The following chart shows the weekly trend for the national key Covid indicators covering wastewater activity levels, percent of emergency department visits due to Covid, test positivity, and the hospital admission rate in the USA.
The panel chart shows Covid levels in wastewater remained stable and are at moderate activity for the week ending February 7, 2026. Emergency department visits and hospital admissions fell slightly, while Covid test positivity remained broadly unchanged.
Wastewater analysis shows that Covid levels are highest Mid West and Northeast states, while staying relatively low in the South and West regions, as illustrated in the following map. Each state is coloured based on activity levels, ranging from very high (dark red) to very low (light green), with grey indicating no data available. States with increasing activity levels are marked with cross-hatching.
The interactive map lets you hover over any state using your cursor to see more details about wastewater viral activity levels. It shows data from states nationwide for the week ending February 7, 2026.
The next chart compares the percentage of Emergency Department visits caused by Covid and Flu. It indicates that while activity for Covid is moderate, Flu activity has has continued to fall and is now at a low level nationally.
However, Flu activity varies across states, with cases increasing in 21 and decreasing in 27. While most states are experiencing moderate or low activity levels, six are still facing high or very high activity, as shown on the interactive map.
Finally, the latest data from Canada, up to January 31, 2026, shows that Covid wastewater levels are holding steady at moderate levels, flu activity has dropped to low, while RSV activity fell this week after last weeks rise.
UK Autumn 2025 Covid Booster Campaign Update
The NHS Autumn 2025 Covid booster campaign closed on January 31, 2026 across all Home Nations. The campaign provided free vaccinations for all individuals aged 75 years and older; residents in care homes for older adults; and immunosuppressed individuals aged 6 months and above.
The following chart shows the coverage for these three eligible groups at the end of the campaign.
Overall, coverage is the highest among residents in care homes, but much lower for immunosuppressed individuals at risk. Scotland recorded the highest coverage, while Northern Ireland had the lowest.
The next chart highlights the overall coverage trends for each booster campaign carried out in England.
Until this booster campaign, coverage had been declining for both the Autumn and Spring campaigns in England. However, for those aged 75 and over, the Autumn 2025 campaign matched the coverage levels seen in Autumn 2024.
The chart shows that, unlike past Autumn campaigns, people aged 65 to 74 weren't eligible for Covid boosters. On top of that, the rules for being considered immunosuppressed were made stricter, which meant far fewer people qualified for the Autumn 2025 campaign compared to previous years. As a result, in England the number of boosters given during the Autumn 2025 campaign (4.7 million) was just under half of those administered in Autumn 2024 (9.8 million).
Finally, the NHS Spring 2026 Covid booster campaign will use the same eligibility criteria as the Autumn 2025 campaign and is set to run from April 13 to June 30, 2026.
In conclusion
Although the amount of data currently being published is reduced, the information available for all home nations show that Covid activity is relatively low. Flu activity had fallen from its recent peak although and is now at low levels.
Covid levels in wastewater are low across European countries In the USA, Covid activity also fell slightly but remains at high levels in a some states. Flu activity in both the USA and Canada is falling.
As always, if you have any comments on this Covid Situation Report or suggestions for topics to cover, please post a message below.
Thanks for reading Seeing The Forest for the Trees! Subscribe for free to receive new posts and support my work.
Appendix 1. Test positivity rates and prevalence
Positivity rates are derived from the results of hospital laboratory tests conducted on patients exhibiting symptoms of respiratory diseases. Test positivity is the percentage of patients who test positive for Covid of the total number of patients tested. Since the individuals tested for this measure are not a representative sample of the general population it differs from prevalence, which is derived from a representative sample of the population.
This report belongs to a weekly series summarising the Covid situation across the UK's home nations and other countries.
Thanks for reading Seeing The Forest for the Trees! Subscribe for free to receive new posts and support my work.
This week's report covers the latest weekly indicators of respiratory illness activity for England, along with the most recent data for Scotland, Wales, and Northern Ireland. The report also presents the data on Covid levels in selected countries in Europe and North America.
Charts for the USA were updated on Friday, Feb 6 to reflect the latest available data.
Summary.
This week the main Covid indicators in England, Scotland, Wales, and Northern Ireland remained low, indicating a low level of risk.
Flu activity has continued to fall across all home nations, indicating that this year's Flu season is over. However, there's still a chance of some late seasonal activity.
In England, the all main indicators of Covid activity remained well within the baseline activity level. Flu activity has again fallen from its recent peak and is now circulating at low activity levels. Hospital admissions remain highest among those over 85 years old with Flu and children under 5 years with RSV.
In Scotland, although all indicators for Covid remained stable and within baseline levels. Positivity rates and hospital admissions for Flu and RSV have fallen significantly from the recent peak and are at low levels of activity.
In the past week, Covid hospital admissions in Wales stayed at low levels. Flu admissions continued to fall this week and are now at low activity levels.
In Northern Ireland, Covid activity remained stable across all surveillance indicators and remains at low levels. Flu and RSV activity has fallen across all indicators.
Covid levels in wastewater remained low in most European countries that still report this data.
Covid activity in the USA again fell slightly last week and is at a moderate level of activity nationwide, though there are significant variations from state to state. Flu activity continued to fall, but is still high in some states.
As always, it's important to remember that the risk of hospitalisation from Covid increases significantly with age and for the clinically vulnerable. Therefore, it is important to take appropriate measures such as self-isolating when experiencing Covid symptoms and enhancing ventilation or wearing masks whenever possible.
Status of main respiratory diseases in England.
This section begins with the latest data on test positivity rates for Covid in England. It's important to note that positivity is different from prevalence, which reflects the overall percentage of Covid cases in the general population. Appendix 1 offers a more detailed explanation of the distinction.
The following chart shows the test positivity rate for all Covid tests taken mapped against the UKHSA activity thresholds. The thresholds are based on the historical trend for Covid test positivity and, consequently, represent a relative risk. More details on this approach can be found in the Guide to Covid Surveillance Metrics.
The chart shows that the test positivity rate fell slightly this week and continues to be well below the baseline level, indicating a low risk. Positivity rates remained low in all regions, with only slight differences between them.
The next chart highlights four key indicators of Covid in hospitals: weekly Emergency Department visits for Covid-like symptoms, test positivity rates among patients with respiratory issues, hospital admission rates, and admission rates for intensive care.
While all key hospital indicators for Covid activity remained at historically low levels there were slight increase in Emergency Department visits.
The following chart shows hospital admission rates per 100,000 for the three main respiratory viruses. Covid admissions are historically low, while Flu and RSV admissions have peaked and are returning to low activity levels. Both still remain higher than Covid, indicating that Flu and RSV currently pose a slightly greater risk. If you're experiencing Covid-like symptoms, there's a good chance it is Flu or RSV.
While hospital admissions are falling, they still differ by age. Below are the hospital admission rates per 100,000 people by age group for Covid, Flu, and RSV for the week ending February 1, 2026.
The chart shows that the risk of hospitalisation remains highest among the very youngest age group and the elderly for both Flu and RSV. While current hospital admissions for Covid are much lower, the elderly remain more likely to be hospitalised.
While the activity levels for most respiratory viruses are falling, Human metapneumovirus (hMPV) levels have remained at a moderate level.
Scotland weekly hospital admissions and test positivity
Public Health Scotland (PHS) continue to publish weekly data on Covid hospital admissions and test positivity as well as wastewater monitoring data. The latest Viral respiratory diseases in Scotland surveillance report can be accessed here.
The following panel chart presents the most recent data for Covid levels in wastewater in blue, weekly Covid test positivity shown in red, Covid hospital admissions depicted in orange, and beds occupied by Covid patients in brown.
Once again, all Covid indicators in Scotland stayed stable and low this week, indicating the risk from the virus remains low.
The final chart in this section compares the test positivity rates for hospital patients with respiratory symptoms for Covid, Flu, and RSV. While Flu positivity rates have continued to fall to low levels they remain higher than for Covid.
Despite influenza levels peaking earlier than expected this season, high activity has not been sustained, with continued decreases seen across all measures.
Laboratory-confirmed Flu cases continued to fall to 125 from the peak of 1,994, with overall activity remaining at baseline for this week. Test positivity also fell and hospital admissions for Flu also decreased from 139 to 82, with individuals aged 75 years and older accounting for 29.3% of admissions.
RSV laboratory‑confirmed cases fell to low levels this week with test positivity falling to 8.1% from 9.9%. Hospital admissions due to RSV also decreased; the highest proportion occurred in under 1 age group followed by the 1-4 age group.
Although Covid test positivity increased slightly this week, overall activity remained stable and within baseline levels. Activity rose from low to medium among 5-14 year olds, while dropping to low in children under four. Hospitalisations also declined, falling to 77 from 85 the week before.
Wales Covid hospital admissions.
During the winter season, Public Health Wales publishes a weekly respiratory infection report, which is available here. The following chart provides the latest trend for weekly hospital admissions for the main respiratory viruses in Wales up to week ending Feb 1, 2026.
Covid hospital admissions have stayed fairly steady over the past few months and remain very low. Flu cases needing hospitalisation continue to fall and are now lower than for Covid. RSV admissions also fell but remain at moderate levels.
This weeks Weekly Acute Respiratory Infection Report shows that Flu activity has returned to low levels, but warns that the potential remains for late seasonal activity. Confirmed case numbers have decreased in the current week, as has test positivity.
In addition, GP consultations for influenza-like illness have fallen below the 'low intensity' threshold. Respiratory Syncytial Virus (RSV) activity is decreasing overall but remains at medium intensity levels. Covid case numbers have remained broadly stable in recent weeks.
Status of main respiratory diseases in Northern Ireland.
Public Health Northern Ireland publish a weekly surveillance report on influenza, respiratory syncytial virus (RSV), and Covid providing an overview of these infections within Northern Ireland.
Covid activity fell across all surveillance indicators and remains at low levels. Flu activity also has fallen across all surveillance indicators and is now at low levels, while RSV activity remained stable across the majority of surveillance indicators and is circulating at moderate levels.
The following chart shows the test positivity rates in Northern Ireland for the main respiratory illnesses — Flu, RSV, and Covid and RSV. Shading represents 95% confidence intervals.
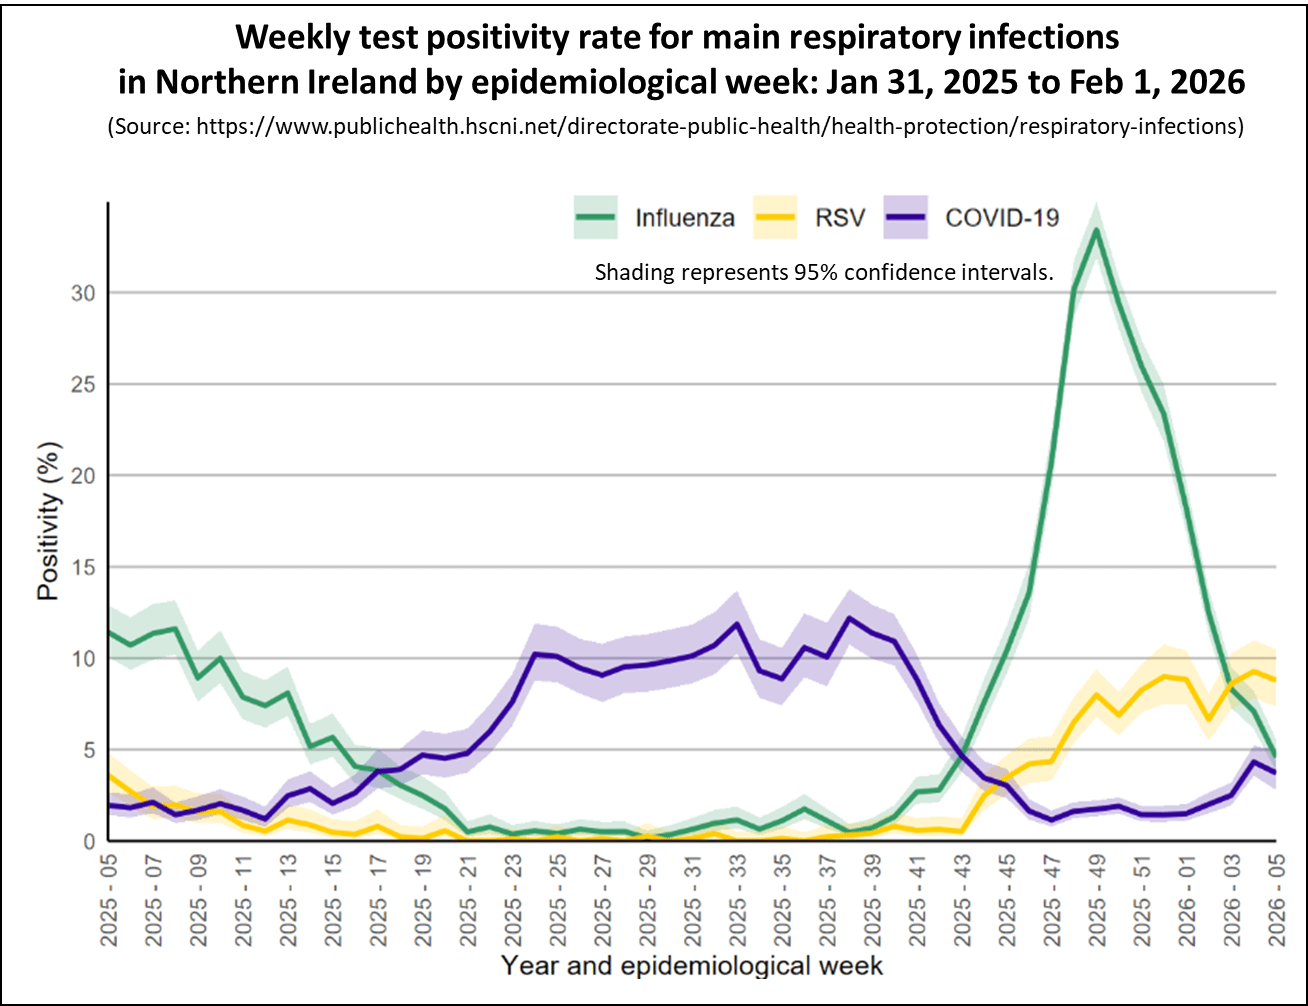
The chart shows that the Covid test positivity rate for patients with respiratory illnesses, marked in blue, fell slightly this week and stayed relatively low. Flu test positivity, shown in green, has continued to fall indicating that the winter Flu wave is over.
Covid Levels in Europe and North America.
This section looks at the latest data on Covid activity in Europe and North America. Covid levels have fallen in most countries across these regions and remain lower than those observed during earlier waves.
The following chart shows latest levels of Covid up to week ending January 29, 2026 as measured by monitoring wastewater in a number of European countries that still publish this information.
This week, Covid levels in wastewater dropped in most European countries that still share this data, with only Denmark and Sweden reporting increases while staying at moderately low levels.
Updated on Friday, February 6 to reflect the latest published data.
As of week ending January 31, 2026, Covid activity in the USA continued to fall, though the situation varies across different parts of the country.
The following chart shows the weekly trend for the national key Covid indicators covering wastewater activity levels, percent of emergency department visits due to Covid, test positivity, and the hospital admission rate in the USA.
The panel chart shows Covid levels in wastewater remained stable and are at moderate activity for the week ending January 31, 2026. Emergency department visits and hospital admissions also fell, while Covid test positivity remained broadly unchanged.
Wastewater analysis shows that Covid levels are highest Mid West and Northeast states, while staying relatively low in the South and West regions, as illustrated in the following map. Each state is coloured based on activity levels, ranging from very high (dark red) to very low (light green), with grey indicating no data available. States with increasing activity levels are marked with cross-hatching.
The interactive map lets you hover over any state using your cursor to see more details about wastewater viral activity levels. It shows data from states nationwide for the week ending January 31, 2026.
The next chart compares the percentage of Emergency Department visits caused by Covid and Flu. It indicates that while activity for Covid is moderate, Flu activity has has continued to fall and is now at a moderate level.
Flu activity varies across states, with cases increasing in 24 and decreasing in 23. While most states are experiencing moderate levels, seven are still facing high or very high activity, as shown on the interactive map.
Finally, the latest data from Canada, up to January 24, 2026, shows that Covid wastewater levels are holding steady at moderate levels, flu activity has dropped to low, but RSV activity is on the rise.
In conclusion
Although the amount of data currently being published is reduced, the information available for all home nations show that Covid activity is relatively low. Flu activity had fallen from its recent peak although and is now at low levels.
Covid levels in wastewater are dropping across European countries and are low in most areas. In the USA, Covid activity also fell slightly but remains at high levels in a some states. Flu activity in both the USA and Canada is falling.
As always, if you have any comments on this Covid Situation Report or suggestions for topics to cover, please post a message below.
Thanks for reading Seeing The Forest for the Trees! Subscribe for free to receive new posts and support my work.
Appendix 1. Test positivity rates and prevalence
Positivity rates are derived from the results of hospital laboratory tests conducted on patients exhibiting symptoms of respiratory diseases. Test positivity is the percentage of patients who test positive for Covid of the total number of patients tested. Since the individuals tested for this measure are not a representative sample of the general population it differs from prevalence, which is derived from a representative sample of the population.
This report belongs to a weekly series summarising the Covid situation across the UK's home nations and other countries.
Thanks for reading Seeing The Forest for the Trees! Subscribe for free to receive new posts and support my work.
This week's report covers the latest weekly indicators of respiratory illness activity for England, along with the most recent data for Scotland, Wales, and Northern Ireland. The report also presents the data on Covid levels in selected countries in Europe and North America.
Charts for the USA were updated on Friday, January 30 to reflect the latest available data.
Summary.
This week the main Covid indicators in England, Scotland, Wales, and Northern Ireland remained low, indicating a low level of risk. However, there were slight increases in some indicators for England and Northern Ireland.
Flu activity has continued to fall across all home nations, indicating that this years winter Flu season is almost over.
In England, the Covid test positivity rate and key hospital indicators showed mixed trends this week, but remain well within the baseline activity level. Flu activity has again fallen from its recent peak and is now circulating at low activity levels. Hospital admissions remain highest among those over 85 years old with Flu and children under 5 years with RSV.
In Scotland, all indicators of Covid activity remained at low levels of activity this week. Positivity rates and hospital admissions for Flu have fallen significantly from the recent peak and are at low levels of activity.
In the past week, Covid hospital admissions in Wales stayed at low levels. Flu admissions continued to fall this week and are returning to low activity levels.
In Northern Ireland, Covid activity increased across some surveillance indicators but remains at low levels. Flu activity has fallen across all indicators.
Covid levels in wastewater fell in most European countries that still report this data.
Covid activity in the USA again fell slightly last week and is at a medium level of activity nationwide, though there are significant variations from state to state. Flu activity continued to fall, but is still high in some states.
As always, it's important to remember that the risk of hospitalisation from Covid increases significantly with age and for the clinically vulnerable. Therefore, it is important to take appropriate measures such as self-isolating when experiencing Covid symptoms and enhancing ventilation or wearing masks whenever possible.
Status of main respiratory diseases in England.
This section begins with the latest data on test positivity rates for Covid in England. It's important to note that positivity is different from prevalence, which reflects the overall percentage of Covid cases in the general population. Appendix 1 offers a more detailed explanation of the distinction.
The following chart shows the test positivity rate for all Covid tests taken mapped against the UKHSA activity thresholds. The thresholds are based on the historical trend for Covid test positivity and, consequently, represent a relative risk. More details on this approach can be found in the Guide to Covid Surveillance Metrics.
The chart shows that the test positivity rate increased slightly this week but continues to be well below the baseline level, indicating a low risk. Positivity rates remained low in all regions, with only slight differences between them.
The next chart highlights four key indicators of Covid in hospitals: weekly Emergency Department visits for Covid-like symptoms, test positivity rates among patients with respiratory issues, hospital admission rates, and admission rates for intensive care.
While all key hospital indicators for Covid activity remained at historically low levels there were slight increases in Emergency Department visits and the positivity rate.
The following chart shows hospital admission rates per 100,000 for the three main respiratory viruses. Covid admissions are historically low, while Flu and RSV admissions have peaked and are returning to low activity levels. Both still remain higher than Covid, indicating that Flu and RSV currently pose a slightly greater risk. If you're experiencing Covid-like symptoms, there's a good chance it is Flu or RSV.
While hospital admissions are falling, they still differ by age. Below are the hospital admission rates per 100,000 people by age group for Covid, Flu, and RSV for the week ending January 25, 2026.
The chart shows that the risk of hospitalisation remains highest among the very youngest age group and the elderly for both Flu and RSV. While current hospital admissions for Covid are much lower, the elderly remain more likely to be hospitalised.
While the activity levels for most respiratory viruses are falling, Human metapneumovirus (hMPV) levels have increased recently although they remain at a moderately low level.
Scotland weekly hospital admissions and test positivity
Public Health Scotland (PHS) continue to publish weekly data on Covid hospital admissions and test positivity as well as wastewater monitoring data. The latest Viral respiratory diseases in Scotland surveillance report can be accessed here.
The following panel chart presents the most recent data for Covid levels in wastewater in blue, weekly Covid test positivity shown in red, Covid hospital admissions depicted in orange, and beds occupied by Covid patients in brown.
Once again, all Covid indicators in Scotland stayed stable and low this week, indicating the risk from the virus remains low.
The final chart in this section compares the test positivity rates for hospital patients with respiratory symptoms for Covid, Flu, and RSV. While Flu positivity rates have continued to fall to low levels they remain higher than for Covid.
Despite influenza levels peaking earlier than expected this season, high activity has not been sustained, with continued decreases seen across all measures.
Wales Covid hospital admissions.
During the winter season, Public Health Wales publishes a weekly respiratory infection report, which is available here. The following chart provides the latest trend for weekly hospital admissions for the main respiratory viruses in Wales up to week ending Jan 25, 2026.
Covid hospital admissions have stayed fairly steady over the past few months and remain very low at baseline levels. Flu cases needing hospitalisation are falling, while RSV admissions remain stable at moderate levels.
This weeks Weekly Acute Respiratory Infection Report shows that Flu activity is returning to low levels, but potential remains for late seasonal activity. Confirmed case numbers have decreased in the current week, as has test positivity.
In addition, GP consultations for influenza-like illness have fallen below the 'low intensity' threshold. Respiratory Syncytial Virus (RSV) activity is decreasing overall but remains at medium intensity levels. Covid case numbers have remained broadly stable in recent weeks.
Status of main respiratory diseases in Northern Ireland.
Public Health Northern Ireland publish a weekly surveillance report on influenza, respiratory syncytial virus (RSV), and Covid providing an overview of these infections within Northern Ireland.
Covid activity increased across some surveillance indicators but remains at low levels. Meanwhile, Flu activity has fallen across all surveillance indicators and is reaching low levels, while RSV activity increased slightly across the majority of surveillance indicators and is circulating at moderate levels.
The following chart shows the test positivity rates in Northern Ireland for the main respiratory illnesses — Flu, RSV, and Covid and RSV. Shading represents 95% confidence intervals.
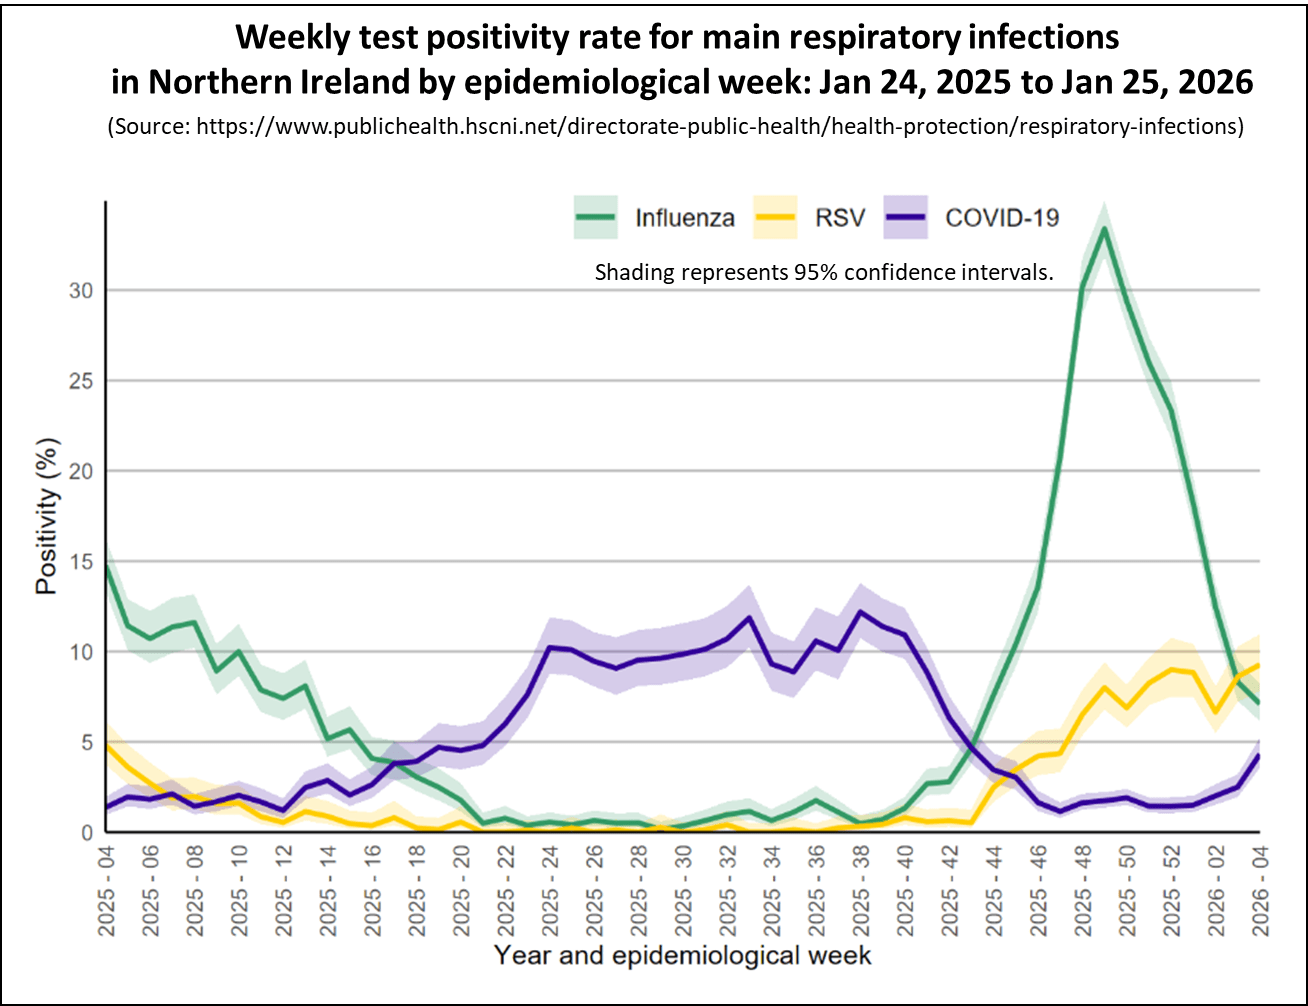
The chart shows that the Covid test positivity rate for patients with respiratory illnesses, marked in blue, increased slightly this week although remaining relatively low. Flu test positivity, shown in green, has continued to fall confirming that the winter Flu wave is over.
Covid Levels in Europe and North America.
This section looks at the latest data on Covid activity in Europe and North America. Covid levels have fallen in most countries across these regions and remain lower than those observed during earlier waves.
The following chart shows latest levels of Covid up to week ending January 22, 2026 as measured by monitoring wastewater in a number of European countries that still publish this information.
This week, Covid levels in wastewater dropped in most European countries that still share this data, with only Denmark and Austria reporting increases while staying at moderate levels.
Updated on Friday, January 30 to reflect the latest published data.
As of week ending January 24, 2026, Covid activity in the USA continued to fall, though the situation varies across different parts of the country.
The following chart shows the weekly trend for the national key Covid indicators covering wastewater activity levels, percent of emergency department visits due to Covid, test positivity, and the hospital admission rate in the USA.
The panel chart shows Covid levels in wastewater fell slightly and are now moderate for the week ending January 24, 2026. Emergency department visits and hospital admissions also fell, while Covid test positivity remained broadly unchanged.
Wastewater analysis shows that Covid levels are highest Mid West and Northeast states, while staying relatively low in the South and West regions, as illustrated in the following map. Each state is coloured based on activity levels, ranging from very high (dark red) to very low (light green), with grey indicating no data available. States with increasing activity levels are marked with cross-hatching.
The interactive map lets you hover over any state using your cursor to see more details about wastewater viral activity levels. It shows data from states nationwide for the week ending January 24, 2026.
The next chart compares the percentage of Emergency Department visits caused by Covid and Flu. It indicates that while activity for Covid is moderate, Flu activity has has continued to fall and is now at a moderately low level.
Flu activity varies across states, with cases falling in 29 states, with only 6 still seeing high or very high levels, as shown on the interactive map.
Finally, the latest data from Canada, up to January 17, 2026, shows that Covid wastewater levels remain steady at moderate levels, while flu activity has fallen to low activity levels.
In conclusion
Although the amount of data currently being published is reduced, the information available for all home nations show that Covid activity is relatively low. Flu activity had fallen from its recent peak although and is now at low levels.
Covid levels in wastewater are dropping across European countries and are low in most areas. In the USA, Covid activity also fell slightly but remains at high levels in a some states. Flu activity in both the USA and Canada is falling.
As always, if you have any comments on this Covid Situation Report or suggestions for topics to cover, please post a message below.
Thanks for reading Seeing The Forest for the Trees! Subscribe for free to receive new posts and support my work.
Appendix 1. Test positivity rates and prevalence
Positivity rates are derived from the results of hospital laboratory tests conducted on patients exhibiting symptoms of respiratory diseases. Test positivity is the percentage of patients who test positive for Covid of the total number of patients tested. Since the individuals tested for this measure are not a representative sample of the general population it differs from prevalence, which is derived from a representative sample of the population.
This report belongs to a weekly series summarising the Covid situation across the UK's home nations and other countries.
Thanks for reading Seeing The Forest for the Trees! Subscribe for free to receive new posts and support my work.
This week's report covers the latest weekly indicators of respiratory illness activity for England, along with the most recent data for Scotland, Wales, and Northern Ireland. The report also presents the data on Covid levels in selected countries in Europe and North America.
Online version updated on January 23, 2026 with latest USA data.
Summary.
2026 continues with good news as the main Covid indicators in England, Scotland, Wales, and Northern Ireland remain low, signalling a low level of risk.
Flu activity has continued to fall across all home nations, indicating that this years winter Flu season is almost over.
In England, the Covid test positivity rate and key hospital indicators stayed steady this week, well within the baseline activity level. Flu activity has again fallen from its recent peak and is now circulating at low activity levels. Hospital admissions remain highest among those over 85 years old with Flu and children under 5 years with RSV.
In Scotland, all indicators of Covid activity remained at low levels of activity this week. Positivity rates and hospital admissions for Flu have fallen significantly from the recent peak and are approaching low levels of activity.
In the past week, Covid hospital admissions in Wales stayed at low levels. Flu hospital admissions continued to fall this week but remain at medium activity levels.
In Northern Ireland, Covid activity was stable across all surveillance indicators in the past week and remains at low levels. Flu activity has fallen across all indicators.
Covid levels in wastewater fell in most European countries that still report this data.
Covid activity in the USA fell slightly this week and has returned to a medium level of activity nationwide, though there are significant variations from state to state. Flu activity is starting to fall, but is still high in many states.
Free vaccinations in the Autumn 2025 booster campaign will be available for adults aged 75 and older; residents in care homes for older adults; and immunosuppressed individuals aged 6 months and above until January 31, 2026.
People registered with a GP surgery in England can check their eligibility and book a vaccination appointment through this link.
Details of booking a free NHS Covid vaccination in Scotland can be found here, for Wales here, and in Northern Ireland here.
As always, it's important to remember that the risk of hospitalisation from Covid increases significantly with age and for the clinically vulnerable. Therefore, it is important to take appropriate measures such as self-isolating when experiencing Covid symptoms and enhancing ventilation or wearing masks whenever possible.
Status of main respiratory diseases in England.
This section begins with the latest data on test positivity rates for Covid in England. It's important to note that positivity is different from prevalence, which reflects the overall percentage of Covid cases in the general population. Appendix 1 offers a more detailed explanation of the distinction.
The following chart shows the test positivity rate for all Covid tests taken mapped against the UKHSA activity thresholds. The thresholds are based on the historical trend for Covid test positivity and, consequently, represent a relative risk. More details on this approach can be found in the Guide to Covid Surveillance Metrics.
The chart shows that the test positivity rate remained stable this week and continues to be well below the baseline level, indicating a low risk. Positivity rates remained low in all regions, with only slight differences between them.
The next chart highlights four key indicators of Covid in hospitals: weekly Emergency Department visits for Covid-like symptoms, test positivity rates among patients with respiratory issues, hospital admission rates, and admission rates for intensive care.
All key hospital indicators for Covid activity remained stable this week and overall activity is at historically low levels.
The following chart shows hospital admission rates per 100,000 for the three main respiratory viruses. Covid admissions are historically low, while Flu and RSV admissions have peaked and are close to low activity levels. However, both remain higher than Covid, indicating that Flu and RSV currently pose a greater risk. If you're experiencing Covid-like symptoms, there's a good chance it is Flu or RSV.
While hospital admissions are falling, they still differ by age. Below are the hospital admission rates per 100,000 people by age group for Covid, Flu, and RSV for the week ending January 18, 2026.
The chart shows that the risk of hospitalisation remains highest among the very youngest age group and the elderly for both Flu and RSV. While current hospital admissions for Covid are much lower, the elderly remain more likely to be hospitalised.
Although the activity levels for most respiratory viruses are falling, Human metapneumovirus (hMPV) levels are increasing although it remains at a moderately low level.
Finally, while Flu activity is falling, it's still a good idea to check your eligibility and book a free vaccination through the following link if you have not already done so.
Scotland weekly hospital admissions and test positivity
Public Health Scotland (PHS) continue to publish weekly data on Covid hospital admissions and test positivity as well as wastewater monitoring data. The latest Viral respiratory diseases in Scotland surveillance report can be accessed here.
The following panel chart presents the most recent data for Covid levels in wastewater in blue, weekly Covid test positivity shown in red, Covid hospital admissions depicted in orange, and beds occupied by Covid patients in brown.
Once again, all Covid indicators in Scotland stayed stable and low this week, indicating the risk from the virus remains low.
The final chart in this section compares the test positivity rates for hospital patients with respiratory symptoms for Covid, Flu, and RSV. While Flu positivity rates have continued to fall they remain higher than for Covid.
Despite influenza levels peaking earlier than expected this season, high activity has not been sustained, with continued decreases seen across all measures. Confirmed cases fell by 33%, from 505 last week to 335 this week, remaining at low activity overall. There were 179 hospital admissions due to Flu this week, down from 239 in the previous week; more than 39% were among those aged 75 years and older. Influenza A(H3N2) continues to dominate.
RSV case rates have fallen this week, although test positivity increased slightly from 8.9% to 9.1%. RSV test positivity increased in children 1-5 years and those aged over 75 years but decreased or remained stable in all other ages groups. Hospital admissions due to RSV decreased to 134; the highest proportion occurred in infants under 1 year, followed by children aged 1-4 years and adults aged 75 and over.
Although the Flu season is coming to an end in Scotland, it's still possible to check if you're eligible for a free Flu vaccination here. If you haven't been contacted yet, you can still book your vaccination using the following link.
Wales Covid hospital admissions.
During the winter season, Public Health Wales publishes a weekly respiratory infection report, which is available here. The following chart provides the latest trend for weekly hospital admissions for the main respiratory viruses in Wales up to week ending Jan 18, 2026.
Covid hospital admissions have stayed fairly steady over the past few months and remain very low at baseline levels. Flu cases needing hospitalisation are falling, while RSV admissions remain stable at moderate levels.
This weeks Weekly Acute Respiratory Infection Report shows that Flu whilst activity is at a medium level it is returning to low intensity levels. Confirmed case numbers have decreased in the current week, as has test positivity. In the week ending January 11, 2026, GP consultations for influenza-like illness are now at baseline levels.
Respiratory Syncytial Virus (RSV) activity is also on the decline, though at a slower pace, and remains at medium intensity levels.
Free Flu vaccinations are still available for individuals aged 65 and older, certain young children, pregnant women, and those with specific medical conditions. You can check your eligibility and book a vaccination through the provided link.
Status of main respiratory diseases in Northern Ireland.
Public Health Northern Ireland publish a weekly surveillance report on influenza, respiratory syncytial virus (RSV), and Covid providing an overview of these infections within Northern Ireland.
Covid activity activity has remained stable and at low levels across all surveillance indicators. Meanwhile, Flu activity has fallen across all surveillance indicators and is approaching low levels, while RSV activity has decreased across most surveillance indicators and is circulating at moderate levels.
The following chart shows the test positivity rates in Northern Ireland for the main respiratory illnesses — Flu, RSV, and Covid and RSV. Shading represents 95% confidence intervals.
The chart shows that the Covid test positivity rate for patients with respiratory illnesses, marked in blue, has again remained stable this week, indicating a low level of Covid activity. Flu test positivity, shown in green, has continued to fall confirming that this wave has peaked.
Information about who qualifies for free flu vaccinations and how to schedule an appointment can be found at the provided link.
Flu vaccinations in Northern Ireland
Covid Levels in Europe and North America.
This section looks at the latest data on Covid activity in Europe and North America. Covid levels have fallen in most countries across these regions and remain lower than those observed during earlier waves.
The following chart shows latest levels of Covid up to week ending January 15, 2026 as measured by monitoring wastewater in a number of European countries that still publish this information.
This week, Covid levels in wastewater dropped in most European countries that still share this data, with only Denmark and Austria reporting increases while staying at moderate levels.
As of week ending January 17, 2026, Covid activity in the USA continued to fall, though the situation varies across different parts of the country.
The following chart shows the weekly trend for the national key Covid indicators covering wastewater activity levels, percent of emergency department visits due to Covid, test positivity, and the hospital admission rate in the USA.
The panel chart shows Covid levels in wastewater fell slightly and are now moderate for the week ending January 17, 2026. Emergency department visits and hospital admissions also fell, while Covid test positivity remained broadly unchanged.
Wastewater analysis shows that Covid levels are highest Mid West and Northeast states, while staying relatively low in the South and West regions, as illustrated in the following map. Each state is coloured based on activity levels, ranging from very high (dark red) to very low (light green), with grey indicating no data available. States with increasing activity levels are marked with cross-hatching.
The interactive map lets you hover over any state using your cursor to see more details about wastewater viral activity levels. It shows data from states nationwide for the week ending January 17, 2026.
The next chart compares the percentage of Emergency Department visits caused by Covid and Flu. It indicates that while activity for Covid is moderate, Flu activity has has continued to fall and is now at a moderate level.
Flu activity varies across states, with cases falling in 42 states, with only 6 still seeing high or very high levels, as shown on the interactive map.
Finally, the latest data from Canada, up to January 10, 2026, shows that Covid wastewater levels remain steady at moderate levels, while flu activity has peaked.
In conclusion
Although the amount of data currently being published is reduced, the information available for all home nations show that Covid activity is relatively low. Flu activity had fallen from its recent peak although and is approaching low levels.
Covid levels in wastewater are falling in most European countries. In the USA, Covid activity also fell slightly but remains at high levels in a some states. Flu activity in both the USA and Canada has started to fall.
As always, if you have any comments on this Covid Situation Report or suggestions for topics to cover, please post a message below.
Thanks for reading Seeing The Forest for the Trees! Subscribe for free to receive new posts and support my work.
Appendix 1. Test positivity rates and prevalence
Positivity rates are derived from the results of hospital laboratory tests conducted on patients exhibiting symptoms of respiratory diseases. Test positivity is the percentage of patients who test positive for Covid of the total number of patients tested. Since the individuals tested for this measure are not a representative sample of the general population it differs from prevalence, which is derived from a representative sample of the population.
This report belongs to a weekly series summarising the Covid situation across the UK's home nations and other countries.
Thanks for reading Seeing The Forest for the Trees! Subscribe for free to receive new posts and support my work.
This week's report covers the latest weekly indicators of respiratory illness activity for England, along with the most recent data for Scotland, Wales, and Northern Ireland. The report also presents the data on Covid levels in selected countries in Europe and North America.
Summary.
2026 continues the good news with the main Covid indicators in England, Scotland, Wales, and Northern Ireland remaining low, indicating a low level of risk.
Flu and RSV activity has fallen to medium levels for all home nations, indicating that this years winter Flu season has peaked.
In England, the Covid test positivity rate and key hospital indicators stayed steady this week, well within the baseline activity level. Although Flu activity has fallen from its recent peak and is now circulating at medium levels. Hospital admissions remain highest among those over 85 years old with Flu and children under 5 years with RSV.
In Scotland, all indicators of Covid activity remained at low levels of activity this week. Positivity rates and hospital admissions for Flu have fallen significantly from the recent peak but remain at medium levels of activity.
In the past week, Covid hospital admissions in Wales remained at low levels of activity. Flu hospital admissions fell this week but are still at medium activity levels.
In Northern Ireland, Covid activity was stable across all surveillance indicators in the past week and remains at low levels. Flu activity has fallen across all indicators.
Covid levels in wastewater fell in most European countries that still report this data.
Covid activity in the USA continued to increase and is now at a high level nationwide, though there are significant variations from state to state. Flu activity has risen sharply and is at high levels in many states.
Free vaccinations in the Autumn 2025 booster campaign will be available for adults aged 75 and older; residents in care homes for older adults; and immunosuppressed individuals aged 6 months and above until January 31, 2026.
People registered with a GP surgery in England can check their eligibility and book a vaccination appointment through this link.
Details of booking a free NHS Covid vaccination in Scotland can be found here, for Wales here, and in Northern Ireland here.
As always, it's important to remember that the risk of hospitalisation from Covid increases significantly with age and for the clinically vulnerable. Therefore, it is important to take appropriate measures such as self-isolating when experiencing Covid symptoms and enhancing ventilation or wearing masks whenever possible.
Status of main respiratory diseases in England.
This section begins with the latest data on test positivity rates for Covid in England. It's important to note that positivity is different from prevalence, which reflects the overall percentage of Covid cases in the general population. Appendix 1 offers a more detailed explanation of the distinction.
The following chart shows the test positivity rate for all Covid tests taken mapped against the UKHSA activity thresholds. The thresholds are based on the historical trend for Covid test positivity and, consequently, represent a relative risk. More details on this approach can be found in the Guide to Covid Surveillance Metrics.
The chart shows that the test positivity rate remained stable this week and continues to be well below the baseline level, indicating a low risk. Positivity rates remained low in all regions, with only slight differences between them.
The next chart highlights four key indicators of Covid in hospitals: weekly Emergency Department visits for Covid-like symptoms, test positivity rates among patients with respiratory issues, hospital admission rates, and admission rates for intensive care.
All key hospital indicators for Covid activity remained stable this week and overall activity is at historically low levels.
The following chart shows hospital admission rates per 100,000 for the three main respiratory viruses. Covid admissions are historically low, while Flu and RSV admissions have peaked and are at medium activity levels. However, both remain higher than Covid, indicating that Flu and RSV currently pose a greater risk. If you're experiencing Covid-like symptoms, there's a good chance it is Flu or RSV.
The last chart in this section shows hospital admission rates per 100,000 people by age group for Covid, Flu, and RSV for the week ending January 11, 2026.
The chart clearly shows that the risk of hospitalisation remains highest among the very youngest age group and the elderly for both Flu and RSV. While current hospital admissions for Covid are much lower, the elderly remain more likely to be hospitalised.
Although Flu activity is falling, it's still a good idea to check your eligibility and book a free vaccination through the following link if you have not already done so.
Scotland weekly hospital admissions and test positivity
Public Health Scotland (PHS) continue to publish weekly data on Covid hospital admissions and test positivity as well as wastewater monitoring data. The latest Viral respiratory diseases in Scotland surveillance report can be accessed here.
The following panel chart presents the most recent data for Covid levels in wastewater in blue, weekly Covid test positivity shown in red, Covid hospital admissions depicted in orange, and beds occupied by Covid patients in brown.
Once again, all Covid indicators in Scotland stayed stable and low this week, indicating the risk from the virus remains low.
The final chart in this section compares the test positivity rates for hospital patients with respiratory symptoms for Covid, Flu, and RSV. While Flu positivity rates have continued to fall they remain higher than for Covid.
Although Flu levels peaked earlier than expected this season, the high activity hasn't lasted, with steady drops across all measures. Confirmed cases fell by 18.3%, from 602 last week to 492 this week, keeping overall activity low. Hospital admissions also declined, with 226 this week compared to 303 the week before; over 38% were among people aged 75 and older. Influenza A(H3N2) remains the dominant strain.
RSV case rates have dropped compared to the previous week, with test positivity falling from 11.4% to 8.7%. Test positivity is going down among children under 14 and in the 15-44 and 65-74 age groups, but it's still rising in adults aged 45-64 and those over 75. Hospital admissions due to RSV are down to 169, with infants under 1 year making up 28.4% of admissions and adults 75 and older accounting for 25.4%.
Although the Flu season is coming to an end in Scotland, it's still possible to check if you're eligible for a free Flu vaccination here. If you haven't been contacted yet, you can still book your vaccination using the following link.
Wales Covid hospital admissions.
During the winter season, Public Health Wales publishes a weekly respiratory infection report, which is available here. The following chart provides the latest trend for weekly hospital admissions for the main respiratory viruses in Wales up to week ending Jan 11, 2026.
Covid hospital admissions have stayed fairly steady over the past few weeks and remain very low. Flu cases needing hospitalisation are falling, while RSV admissions remain stable at moderate levels.
This weeks Weekly Acute Respiratory Infection Report shows that Flu activity remains at a medium level. Confirmed case numbers have decreased in the current week, as has test positivity. In the week ending January 4, 2026, GP consultations for influenza-like illness dropped to low levels.
Respiratory Syncytial Virus (RSV) activity is also decreasing and is now at medium intensity levels.
Free Flu vaccinations are still available for individuals aged 65 and older, certain young children, pregnant women, and those with specific medical conditions. You can check your eligibility and book a vaccination through the provided link.
Status of main respiratory diseases in Northern Ireland.
Public Health Northern Ireland publish a weekly surveillance report on influenza, respiratory syncytial virus (RSV), and Covid providing an overview of these infections within Northern Ireland.
Covid activity activity has remained stable and at low levels across all surveillance indicators. Meanwhile, Flu activity has fallen across all surveillance indicators while RSV activity has decreased across most surveillance indicators and is circulating at moderately low levels.
The following chart shows the test positivity rates in Northern Ireland for the main respiratory illnesses — Flu, RSV, and Covid and RSV. Shading represents 95% confidence intervals.
The chart shows that the Covid test positivity rate for patients with respiratory illnesses, marked in blue, has again remained stable this week, indicating a low level of Covid activity. Flu test positivity, shown in green, has continued to fall confirming that this wave has peaked.
Information about who qualifies for free flu vaccinations and how to schedule an appointment can be found at the provided link.
Flu vaccinations in Northern Ireland
Covid Levels in Europe and North America.
This section looks at the latest data on Covid activity in Europe and North America. While Covid levels have increased in several countries across these regions, they generally remain lower than those observed during earlier waves.
The following chart shows the latest levels of Covid up to week ending January 8, 2026 as measured by monitoring wastewater in a number of European countries that still publish this information.
This week, Covid levels in wastewater dropped in most European countries that still share this data, with only France seeing a slight increase but staying at low levels.
As of week ending January 3, 2026, Covid activity in the USA continues to increase, though the situation varies across different parts of the country.
The following chart shows the weekly trend for the national key Covid indicators covering wastewater activity levels, percent of emergency department visits due to Covid, test positivity, and the hospital admission rate in the USA.
The panel chart shows Covid levels in wastewater have climbed and are now high for the week ending January 3, 2026. Emergency department visits and Covid test positivity have also increased to moderate levels, while hospital admissions remain relatively low.
Wastewater analysis shows that Covid levels are highest in the Northeast and Mid West states, while staying relatively low in the South and West regions, as illustrated in the map below. Each state is coloured based on activity levels, ranging from very high (dark red) to very low (light green), with grey indicating no data available. States with increasing activity levels are marked with cross-hatching.
The interactive map lets you hover over any state using your cursor to see more details about wastewater viral activity levels. It shows data from states nationwide for the week ending January 3, 2026.
The next chart compares the percentage of Emergency Department visits caused by Covid and Flu. It indicates that while activity for Covid is moderate, Flu activity has continued to increase significantly and is at a high level.
Flu activity levels also differ across states, as shown on the following interactive map, with cases on the rise in 28 states, including 21 experiencing high or very high levels.
Finally, the latest data from Canada, up to December 27, 2025, shows that Covid wastewater levels remain steady at moderate levels, while flu activity may have peaked.
In conclusion
Although the amount of data currently being published is reduced, the information available for all home nations show that Covid activity is relatively low. Flu activity had fallen from its recent peak although is still at moderate levels.
Covid levels in wastewater are falling in most European countries. In the USA, Covid activity is increasing and at high levels with a few states showing very high levels. Flu activity in both the USA and Canada has increased significantly over the past few weeks.
As always, if you have any comments on this Covid Situation Report or suggestions for topics to cover, please post a message below.
Thanks for reading Seeing The Forest for the Trees! Subscribe for free to receive new posts and support my work.
Appendix 1. Test positivity rates and prevalence
Positivity rates are derived from the results of hospital laboratory tests conducted on patients exhibiting symptoms of respiratory diseases. Test positivity is the percentage of patients who test positive for Covid of the total number of patients tested. Since the individuals tested for this measure are not a representative sample of the general population it differs from prevalence, which is derived from a representative sample of the population.
This report belongs to a weekly series summarising the Covid situation across the UK's home nations and other countries.
As this is the first report of 2026, I'd like to welcome readers back after the break and wish everyone a happy and healthy New Year!
Thanks for reading Seeing The Forest for the Trees! Subscribe for free to receive new posts and support my work.
This week's report covers the latest weekly indicators of respiratory illness activity for England, along with the most recent data for Scotland, Wales, and Northern Ireland. The report also presents the data on Covid levels in selected countries in Europe and North America. Finally, there's an update on the latest status of the Autumn 2025 Covid booster campaign including data on inequalities in coverage across England.
Summary.
2026 starts with the main Covid indicators in England, Scotland, Wales, and Northern Ireland remaining low, indicating a low level of risk.
Flu and RSV activity remains at medium levels for all home nations, although there are signs that this years winter Flu season has peaked.
In England, the Covid test positivity rate and key hospital indicators stayed steady this week, well within the baseline activity level. Although Flu activity has fallen from its recent peak and is now circulating at medium levels, this weeks activity showed mixed trends. Hospital admissions remain highest among people over 85 years old with Flu and children under 5 years with RSV.
In Scotland, all indicators of Covid activity remained at low levels of activity this week. Positivity rates and hospital admissions for Flu have fallen significantly from the recent peak but remain at medium levels of activity.
In the past week, Covid hospital admissions in Wales remained at low levels of activity. Flu-related hospital admissions have dropped from their recent peak but held steady this week, staying at medium activity levels.
In Northern Ireland, Covid activity was stable across all surveillance indicators in the past week and remains at low levels. Flu activity has fallen across most indicators.
This week sees a mixed picture for European countries reporting Covid levels in wastewater. Levels increased in some countries, though activity levels varied considerable between countries.
This week, Covid activity in the USA has risen to a moderate level nationwide, though there are significant variations from state to state. Flu activity has risen sharply and is at high levels in many states.
The NHS Autumn Covid booster campaign started on October 1, 2025 with the aim of completing most vaccinations by the end of November 2025. While there's been reasonably good progress for those aged 75 and older, immunosuppressed individuals still have much lower coverage.
In England, coverage among the immunosuppressed for all age groups remains much lower at just 38%. There are also significant differences in coverage between regions, ethnic groups, and more deprived areas.
Free vaccinations in the Autumn 2025 booster campaign will be available for adults aged 75 and older; residents in care homes for older adults; and immunosuppressed individuals aged 6 months and above until January 31, 2026.
People registered with a GP surgery in England can check their eligibility and book a vaccination appointment through this link.
Details of booking a free NHS Covid vaccination in Scotland can be found here, for Wales here, and in Northern Ireland here.
As always, it's important to remember that the risk of hospitalisation from Covid increases significantly with age and for the clinically vulnerable. Therefore, it is important to take appropriate measures such as self-isolating when experiencing Covid symptoms and enhancing ventilation or wearing masks whenever possible.
Status of main respiratory diseases in England.
This section begins with the latest data on test positivity rates for Covid in England. It's important to note that positivity is different from prevalence, which reflects the overall percentage of Covid cases in the general population. Appendix 1 offers a more detailed explanation of the distinction.
The following chart shows the test positivity rate for all Covid tests taken mapped against the UKHSA activity thresholds. The thresholds are based on the historical trend for Covid test positivity and, consequently, represent a relative risk. More details on this approach can be found in the Guide to Covid Surveillance Metrics.
The chart shows that the test positivity rate remained stable this week and continues to stay well below the baseline level, indicating a low risk. Positivity rates remained low in all regions, with only slight differences between them.
The next chart highlights four key indicators of Covid in hospitals: weekly Emergency Department visits for Covid-like symptoms, test positivity rates among patients with respiratory issues, hospital admission rates, and admission rates for intensive care.
All key hospital indicators for Covid activity remained stable this week and overall activity is at historically low levels.
The following chart shows hospital admission rates per 100,000 for the three main respiratory viruses. Covid admissions are historically low, while Flu and RSV admissions appear to have peaked at medium activity levels. However, both are now much higher than Covid, indicating that Flu and RSV currently pose a greater risk. If you're experiencing Covid-like symptoms, there's a good chance it is Flu or RSV.
The last chart in this section shows hospital admission rates per 100,000 people by age group for Covid, Flu, and RSV for the week ending January 4, 2026.
The chart clearly shows that the risk of hospitalisation remains highest among the very youngest age group and the elderly for both Flu and RSV. While current hospital admissions for Covid are lower, the elderly remain more likely to be hospitalised.
Finally, the UKHSA released a study this week on how effective this year's Flu vaccine is at preventing visits to Emergency Departments and hospitalisations. The study concluded that despite the emergence of a drifted influenza A(H3N2) strain driving an unusually early 2025/26 Flu season, early estimates provide reassurance that current vaccines provide protection in children, adolescents and adults in the early period post-vaccination. However, they were less protective in those aged 65 years and older.
With the Flu season underway, it's a good idea to check your eligibility and book a free vaccination through the following link.
Scotland weekly hospital admissions and test positivity
Public Health Scotland (PHS) continue to publish weekly data on Covid hospital admissions and test positivity as well as wastewater monitoring data. The latest Viral respiratory diseases in Scotland surveillance report can be accessed here.
The following panel chart presents the most recent data for weekly Covid test positivity shown in red, Covid levels in wastewater in blue, Covid hospital admissions depicted in orange, and beds occupied by Covid patients in brown.
Covid indicators in Scotland stayed stable and low this week, indicating the risk from the virus remains low.
The final chart in this section compares the test positivity rates for hospital patients with respiratory symptoms for Covid, Flu, and RSV. While Flu positivity rates have started to fall rapidly they remain higher than for Covid.
Despite Flu levels peaking earlier than expected this season, high activity has not been sustained, with decreases seen across all measures. Influenza A(H3N2) continues to dominate.
RSV laboratory confirmed case rates have fallen overall in the past two weeks, though test positivity continued to increase to 10.8%. Through both measures, RSV activity has since decreased in children aged under 5 but continues to rise in adults aged 45 plus. Hospital admissions due to RSV decreased to 242, driven by decreases in those aged under 5. This is typical of RSV seasonality, with peaks observed first in infants before older adults.
With the Flu season well underway in Scotland, now is the time to check if you're eligible for a free Flu vaccination here. If you haven't been contacted yet, you can still book your vaccination using the following link.
Wales Covid hospital admissions.
During the winter season, Public Health Wales publishes a weekly respiratory infection report, which is available here. The following chart provides the latest trend for weekly hospital admissions for the main respiratory viruses in Wales up to week ending Jan 4, 2026.
Covid hospital admissions have remained broadly stable for the past few weeks and are at low levels. Flu and RSV admissions show signs of increasing, but remain at moderate levels.
This weeks Weekly Acute Respiratory Infection Report shows that Flu activity remains at a medium level. Although hospital admissions for Flu increased slightly, confirmed case numbers have decreased in the current week, as has test positivity. Respiratory Syncytial Virus (RSV) is decreasing but remains at very high intensity levels. Covid case numbers have remained broadly stable and low in recent weeks.
Free Flu vaccinations are still available for individuals aged 65 and older, certain young children, pregnant women, and those with specific medical conditions. You can check your eligibility and book a vaccination through the provided link.
Status of main respiratory diseases in Northern Ireland.
Public Health Northern Ireland publish a weekly surveillance report on influenza, respiratory syncytial virus (RSV), and Covid providing an overview of these infections within Northern Ireland.
Covid activity activity has remained stable and at low levels across all surveillance indicators. Meanwhile, Flu activity has decreased across the majority of surveillance indicators although rates are highest in young children. RSV activity has decreased across some surveillance indicators and is circulating at moderately low levels.
The following chart shows the test positivity rates in Northern Ireland for the main respiratory illnesses — Flu, RSV, and Covid and RSV. Shading represents 95% confidence intervals.
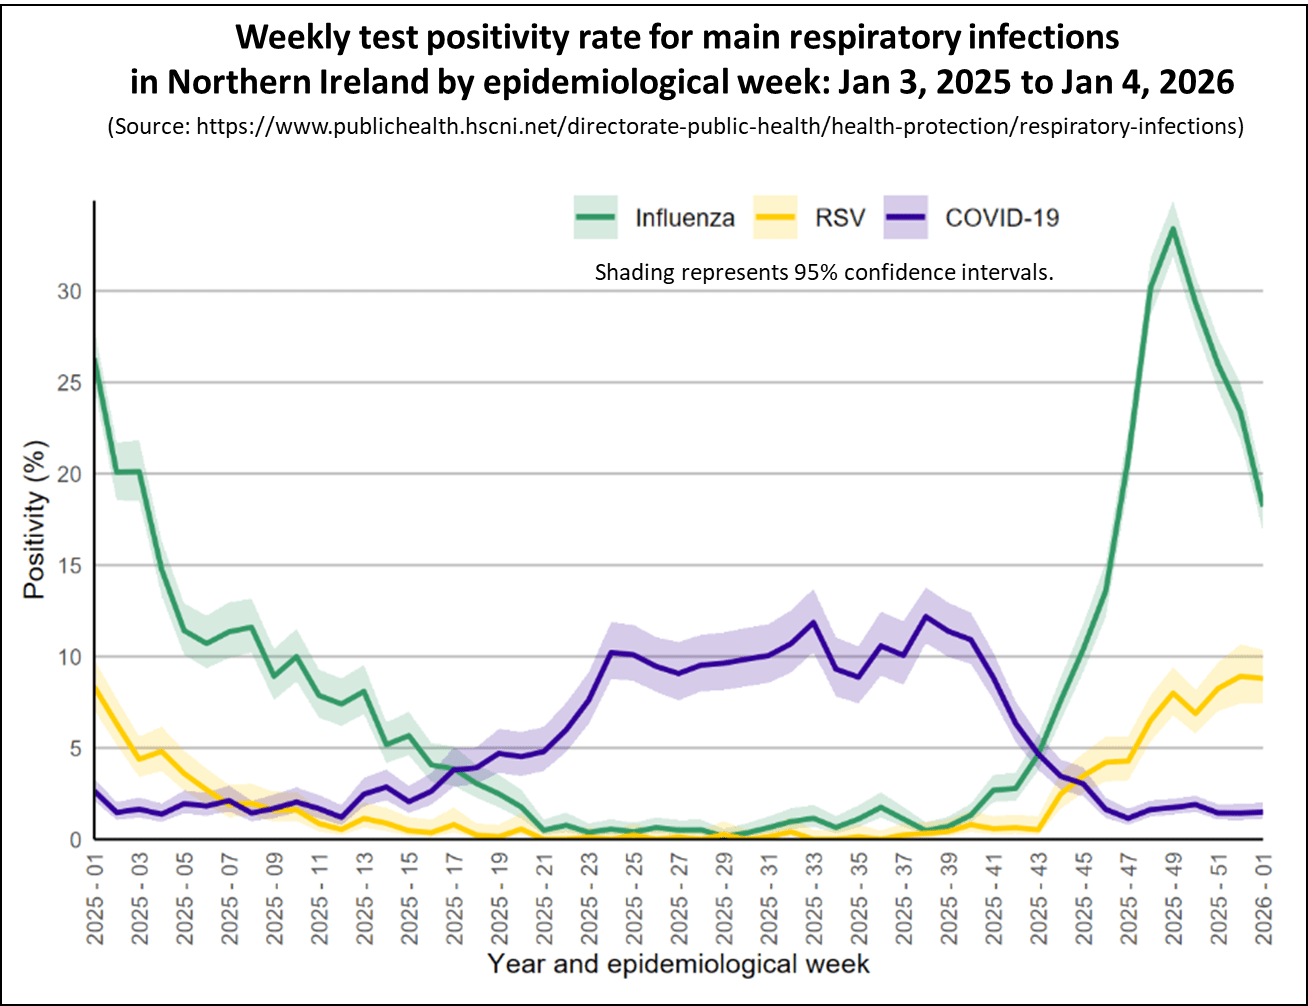
The chart shows that the Covid test positivity rate for patients with respiratory illnesses, marked in blue, has stayed about the same this week, indicating a low level of Covid activity. Flu test positivity, shown in green, has continued to fall indicating that this wave has peaked.
Information about who qualifies for free flu vaccinations and how to schedule an appointment can be found at the provided link.
Flu vaccinations in Northern Ireland
Covid Levels in Europe and North America.
This section looks at the latest data on Covid activity in Europe and North America. While Covid levels have increased in several countries across these regions, they generally remain lower than those observed during earlier waves.
The following chart shows the latest levels of Covid as measured by monitoring wastewater in a number of European countries that still publish this information. Unfortunately, due to the end of year holidays. data for the last week of 2025 has not been published for Germany, Denmark, and France.
Once again, it's a mixed picture for European countries reporting Covid levels in wastewater. While Covid levels in wastewater rose in Germany and Sweden, activity varied quite considerably, with Austria and France experiencing relatively low levels.
As of week ending December 27, 2025, Covid activity in the USA is on the rise, though the situation varies across different parts of the country.
The following chart shows the weekly trend for the national key Covid indicators covering test positivity, wastewater activity levels, percent of emergency department visits due to Covid, and the hospital admission rate in the USA.
The panel chart shows that Covid levels in wastewater and emergency department visits have risen to moderate levels, whereas test positivity and hospital admissions remain relatively low.
Wastewater analysis shows that Covid levels are highest in the Northeast and Mid West states, while staying relatively low in the South and West regions, as illustrated in the map below. Each state is coloured based on activity levels, ranging from very high (dark red) to very low (light green), with grey indicating no data available. States with increasing activity levels are marked with cross-hatching.
The interactive map lets you hover over any state to see more details about wastewater viral activity levels. It displays data for states across the country for the week ending Dec 27, 2025.
The next chart shows the percentage of Emergency Department visits caused by Covid and Flu. It indicates that while activity for Covid is moderate, Flu activity has increased significantly and is at a high level.
Flu activity levels differ across states, as shown on the following interactive map, with cases on the rise in 39 states, including 23 experiencing high or very high levels.
Finally, the latest data from Canada, up to December 20, 2025, shows that Covid wastewater levels remain steady at moderate levels, while flu activity is rising fast.
Autumn 2025 Covid Booster campaign.
The NHS Autumn Covid booster campaign started on October 1, 2025. This year's Autumn vaccination campaign is set to end earlier in England than in previous years, with the majority of vaccinations scheduled to be completed by the end of November. However, outreach efforts to administer vaccines in underserved communities will continue after this date.
The next chart in this section compares the latest Covid vaccination coverage by Home Nation for the two main eligible groups. It shows that coverage is much lower for immunosuppressed individuals compared to those aged 75 and older.
This week, NHS England shared more details about the Autumn 2025 Covid booster campaign, pointing out the uneven coverage across the country as the campaign nears its end. The following chart illustrates the regional difference in coverage for the two main eligible groups.
The chart shows a clear regional difference with London having the lowest coverage for both eligible groups. This is consistent with the pattern seen in previous campaigns.
The final chart in this section shows the inequality in coverage by deprivation level and ethnicity.
Just like in previous campaigns, people in the most deprived areas are far less likely to be vaccinated compared to those in the least deprived areas. Likewise, vaccination rates continue to be much lower among individuals from ethnic minority groups.
In conclusion
Although the amount of data currently being published is reduced, the information available for all home nations show that Covid activity is relatively low. Flu activity had fallen from its recent peak although is still at moderate levels.
Covid activity in Europe is showing a mixed picture with some countries increasing, particularly in Germany. In the USA, Covid activity levels is now moderate with a few states showing high levels. Flu activity in both the USA and Canada has increased significantly over the past few weeks.
As always, if you have any comments on this Covid Situation Report or suggestions for topics to cover, please post a message below.
Thanks for reading Seeing The Forest for the Trees! Subscribe for free to receive new posts and support my work.
Appendix 1. Test positivity rates and prevalence
Positivity rates are derived from the results of hospital laboratory tests conducted on patients exhibiting symptoms of respiratory diseases. Test positivity is the percentage of patients who test positive for Covid of the total number of patients tested. Since the individuals tested for this measure are not a representative sample of the general population it differs from prevalence, which is derived from a representative sample of the population.
This report belongs to a weekly series summarising the Covid situation across the UK's home nations and other countries.
Wishing all readers a Merry Christmas and a Happy New Year.
This is the last report of the year as we head into the holiday break. The next Situation Report will be out on January 8, 2026 when regular service resumes.
Thanks for reading Seeing The Forest for the Trees! Subscribe for free to receive new posts and support my work.
This week's report covers the latest weekly indicators of respiratory illness activity for England, along with the most recent data for Scotland, and Wales. The report also presents the data on Covid and Flu levels in the USA.
Summary.
Once again, the main Covid indicators in England, Scotland, and Wales stayed low, indicating a low level of risk.
Flu activity fell across all home nations, indicating this years winter Flu season has peaked. However, Flu is still circulating at medium levels so take care over the holiday period.
In England, the Covid test positivity rate stayed steady this week, well within the baseline activity level. The main hospital indicators also remained unchanged, indicating a low level of risk. Flu activity fell this week, with declines in both hospital admissions and test positivity rates, though levels remain at a medium activity level.
In Scotland, all indicators of Covid activity remained at low levels of activity this week. Positivity rates and hospital admissions for Flu have continued to fall but remain at medium levels of activity.
In the past week, Covid hospital admissions in Wales fell slightly and remain at low levels of activity. Hospital admissions for Flu also fell but remain at medium activity levels.
All indicators show that Covid activity in the USA is low although some states are seeing increased activity. Flu indicators continue to increase and are at moderate levels.
As always, it's important to remember that the risk of hospitalisation from Covid increases significantly with age and for the clinically vulnerable. Therefore, it is important to take appropriate measures such as self-isolating when experiencing Covid symptoms and enhancing ventilation or wearing masks whenever possible. Taking these precautions also reduces the risk of passing on Flu or RSV.
Status of main respiratory diseases in England.
This section begins with the latest data on test positivity rates for Covid in England. It's important to note that positivity is different from prevalence, which reflects the overall percentage of Covid cases in the general population. Appendix 1 offers a more detailed explanation of the distinction.
The following chart shows the test positivity rate for all Covid tests taken mapped against the UKHSA activity thresholds. The thresholds are based on the historical trend for Covid test positivity and, consequently, represent a relative risk. More details on this approach can be found in the Guide to Covid Surveillance Metrics.
The chart shows that the test positivity rate has dropped to its lowest point in three years and is now well below the baseline level of activity, indicating a low risk level. Positivity rates fell across all regions, showing only small differences between them.
The next chart highlights four key indicators of Covid in hospitals: weekly Emergency Department visits for Covid-like symptoms, test positivity rates among patients with respiratory issues, hospital admission rates, and admission rates for intensive care.
All key hospital indicators for Covid activity remained stable this week and overall activity is at historically low levels.
The final chart shows hospital admission rates per 100,000 for the three main respiratory viruses. Covid admissions are historically low, while Flu admissions are falling but remains at medium activity levels. RSV admissions have started to rise again but remain at moderate levels. However, both are now much higher than Covid, indicating that Flu and RSV currently pose a greater risk. If you're experiencing Covid-like symptoms, there's a good chance it is Flu or RSV.
With the Flu season continuing, it's a good idea to check your eligibility and book a free vaccination through the following link.
Scotland weekly hospital admissions and test positivity
Public Health Scotland (PHS) continue to publish weekly data on Covid hospital admissions and test positivity as well as wastewater monitoring data. The latest Viral respiratory diseases in Scotland surveillance report can be accessed here.
The following panel chart presents the most recent data for weekly Covid test positivity shown in red, Covid levels in wastewater in blue, Covid hospital admissions depicted in orange, and beds occupied by Covid patients in brown.
Covid indicators in Scotland stayed stable and low this week, indicating the risk from the virus remains low.
The final chart in this section compares the test positivity rates for hospital patients with respiratory symptoms for Covid, Flu, and RSV. While Flu positivity rates have started to fall they remain moderately high and much higher than for Covid.
Flu activity in Scotland has dropped again across most measures, holding at a medium level overall based on lab-confirmed cases. Reported cases fell by 35% to 1,297 from 1,994, though activity stayed high in the 1-4 and 5-14 age groups. This week saw 678 Flu-related hospital admissions, down from 950 last week. There's no sign of more severe illness based on deaths or excess mortality, though reporting delays remain.
With the Flu season still underway in Scotland, now is the time to check if you're eligible for a free Flu vaccination here. If you haven't been contacted yet, you can book your vaccination using the following link.
Wales Covid hospital admissions.
During the winter season, Public Health Wales publishes a weekly respiratory infection report, which is available here. The following chart provides the latest trend for weekly hospital admissions for the main respiratory viruses in Wales up to week ending Dec 21, 2025.
Covid hospital admissions have remained broadly stable for the past few weeks and are at low levels. Flu and RSV admissions fell slightly, but remain at moderate levels.
This weeks Weekly Acute Respiratory Infection Report shows that while flu admissions have fallen slightly, it is still circulating at medium intensity. Respiratory Syncytial Virus (RSV) is currently circulating in the community, with confirmed cases in children under 5 years old at high levels, although the incidence decreased in the most recent week.
Free Flu vaccinations are available for individuals aged 65 and older, certain young children, pregnant women, and those with specific medical conditions. With the Flu season continuing, it's a good idea to check your eligibility and book a vaccination through the provided link.
Covid Levels in USA.
This section reviews the latest data on Covid levels in the USA, showing that levels mostly remain low across the country. However, some states are starting to see signs of increasing activity.
The following chart shows the weekly trend up to December 13 for key national Covid indicators, including test positivity, wastewater activity levels, the percentage of emergency department visits related to Covid, and the hospital admission rate.
Whilst there has been a slight increase across all indicators, Covid activity remains relatively low nationally.
The next chart shows the regional wastewater activity trends for Covid, highlighting that levels are climbing the fastest in the Northeast and Mid West regions.
Wastewater analysis reveals that although Covid levels remain low or very low in most US states, many are starting to see increases, as shown in the map below. Each state is coloured based on activity levels, ranging from very high (dark red) to very low (light green), with grey indicating no data available. States with increasing activity levels are marked with cross-hatching.
The interactive map lets you hover over any state to see more details about wastewater viral activity levels. It displays data for states across the country for the week ending Dec 13, 2025.
The interactive map shows wastewater activity levels increased in 24 states last week, down from 40 the week before, while 34 states remained at low or very low activity levels, down from 38 the previous week.
The final chart for the USA shows the percentage of Emergency Department visits caused by the main respiratory illnesses—Covid and Flu. It indicates that activity levels for these viruses are currently low, though Flu cases are continuing to increase.
In conclusion
Although the amount of data currently being published is reduced, the information available for all home nations show that Covid activity is relatively low. The recent rise in Flu activity has peaked but is still at medium levels of activity.
In the USA, Covid activity levels remain low although some states are seeing increased activity. Flu activity have increased indicating that the Winter Flu season has started
As always, if you have any comments on this Covid Situation Report or suggestions for topics to cover, please post a message below.
Thanks for reading Seeing The Forest for the Trees! Subscribe for free to receive new posts and support my work.
Appendix 1. Test positivity rates and prevalence
Positivity rates are derived from the results of hospital laboratory tests conducted on patients exhibiting symptoms of respiratory diseases. Test positivity is the percentage of patients who test positive for Covid of the total number of patients tested. Since the individuals tested for this measure are not a representative sample of the general population it differs from prevalence, which is derived from a representative sample of the population.
This report belongs to a weekly series summarising the Covid situation across the UK's home nations and other countries.
This is the last full report of the year, as there will be limited data over the Christmas period; however, I plan to publish a shortened report on Wednesday, December 24, covering the available information.
Thanks for reading Seeing The Forest for the Trees! Subscribe for free to receive new posts and support my work.
This week's report covers the latest weekly indicators of respiratory illness activity for England, along with the most recent data for Scotland, Wales, and Northern Ireland. The report also presents the data on Covid levels in selected countries in Europe and North America. Finally, there is an update latest status on the Autumn 2025 Covid Booster campaign.
Summary.
Once again, the main Covid indicators in England, Scotland, Wales, and Northern Ireland stayed low, indicating a low level of risk.
Flu and RSV activity remained broadly stable but at medium levels for all home nations, indicating this years winter Flu season may have peaked.
Public Heath Scotland report that early seasonal Flu vaccine effectiveness data shows the vaccine is providing good protection against the currently circulating variant. The data shows a 78% reduced risk of hospitalisation in ages 2-17 and 37% in those 65 and over. Similar results were observed in pooled estimates from Scotland, Northern Ireland and Wales, and with early estimates from England.
In England, the Covid test positivity rate stayed steady this week, well within the baseline activity level. The main hospital indicators also remained unchanged, indicating a low level of risk. Flu activity has stopped increasing, with both hospital admissions stable and test positivity rates starting to fall. Hospital admissions remain highest among people over 85 years old with Flu and children under 5 years with RSV.
In Scotland, all indicators of Covid activity remained at low levels of activity this week. Positivity rates and hospital admissions for Flu have started to fall and are now at medium levels of activity.
In the past week, Covid hospital admissions in Wales fell slightly and remain at low levels of activity. Hospital admissions for Flu also fell but remain at medium activity levels.
In Northern Ireland, Covid activity remained stable across all surveillance indicators in the past week and are at low levels. Flu and RSV activity levels have stabilised and are likely to have peaked.
This week is again a mixed picture for European countries reporting Covid levels in wastewater. Levels increased across all countries, though activity levels varied considerable between countries.
CDC data have resumed publishing data this week and all indicators show that Covid activity in the USA is low although some states are seeing increased activity. Flu indicators are increasing albeit from low levels.
The NHS Autumn Covid booster campaign started on October 1, 2025 with the aim of completing most vaccinations by the end of November 2025. While there's been reasonably good progress for those aged 75 and older, immunosuppressed individuals still have much lower coverage.
Free vaccinations in the Autumn 2025 booster campaign will be available for adults aged 75 and older by January 31, 2026; residents in care homes for older adults; and immunosuppressed individuals aged 6 months and above.
People registered with a GP surgery in England can check their eligibility and book a vaccination appointment through this link.
Details of booking a free NHS Covid vaccination in Scotland can be found here, for Wales here, and in Northern Ireland here.
As always, it's important to remember that the risk of hospitalisation from Covid increases significantly with age and for the clinically vulnerable. Therefore, it is important to take appropriate measures such as self-isolating when experiencing Covid symptoms and enhancing ventilation or wearing masks whenever possible.
Status of main respiratory diseases in England.
This section begins with the latest data on test positivity rates for Covid in England. It's important to note that positivity is different from prevalence, which reflects the overall percentage of Covid cases in the general population. Appendix 1 offers a more detailed explanation of the distinction.
The following chart shows the test positivity rate for all Covid tests taken mapped against the UKHSA activity thresholds. The thresholds are based on the historical trend for Covid test positivity and, consequently, represent a relative risk. More details on this approach can be found in the Guide to Covid Surveillance Metrics.
The chart indicates that the test positivity rate was again stable this week and is well below the baseline level of activity, indicating a low level of risk. Positivity rates decreased across all regions, showing only small differences between them.
The next chart highlights four key indicators of Covid in hospitals: weekly Emergency Department visits for Covid-like symptoms, test positivity rates among patients with respiratory issues, hospital admission rates, and admission rates for intensive care.
All key hospital indicators for Covid activity remained stable this week and overall activity is at historically low levels.
The final chart shows hospital admission rates per 100,000 for the three main respiratory viruses. Covid admissions are historically low, while Flu and RSV admissions appear to have peaked at medium activity levels. However, both are now much higher than Covid, indicating that Flu and RSV currently pose a greater risk. If you're experiencing Covid-like symptoms, there's a good chance it is Flu or RSV.
The last chart in this section shows hospital admission rates per 100,000 people by age group for Covid, Flu, and RSV for the week ending December 14, 2025.
The chart clearly shows that the risk of hospitalisation remains highest among the very youngest age group and the elderly for both Flu and RSV. While current hospital admissions for Covid are lower, the elderly remain more likely to be hospitalised.
With the Flu season underway, it's a good idea to check your eligibility and book a free vaccination through the following link.
Scotland weekly hospital admissions and test positivity
Public Health Scotland (PHS) continue to publish weekly data on Covid hospital admissions and test positivity as well as wastewater monitoring data. The latest Viral respiratory diseases in Scotland surveillance report can be accessed here.
The following panel chart presents the most recent data for weekly Covid test positivity shown in red, Covid levels in wastewater in blue, Covid hospital admissions depicted in orange, and beds occupied by Covid patients in brown.
Covid indicators in Scotland stayed stable and low this week, indicating the risk from the virus remains low.
The final chart in this section compares the test positivity rates for hospital patients with respiratory symptoms for Covid, Flu, and RSV. While Flu positivity rates have started to fall they remain much higher than for Covid.
Flu activity in Scotland has steadied or decreased across most measure, returning to medium activity overall based on reporting of laboratory-confirmed cases. Cases decreased by 20% to 1918 from 2410, and activity level dropped to high (from very high) in the 1-4 and 5-14 age groups. There were 912 hospital admissions due to Flu this week, down from 1039 in the previous week. There are no indications of more severe disease as measured by deaths or excess mortality, although there are reporting lags. Influenza A(H3N2) continues to dominate.
With the Flu season well underway in Scotland, now is the time to check if you're eligible for a free Flu vaccination here. If you haven't been contacted yet, you can book your vaccination using the following link.
Wales Covid hospital admissions.
During the winter season, Public Health Wales publishes a weekly respiratory infection report, which is available here. The following chart provides the latest trend for weekly hospital admissions for the main respiratory viruses in Wales up to week ending Dec 14, 2025.
Covid hospital admissions have remained broadly stable for the past few weeks and are at low levels. Flu and RSV admissions fell slightly, but remain at moderate levels.
This weeks Weekly Acute Respiratory Infection Report shows that while flu admissions have fallen slightly, it is still circulating at medium intensity, with increases in test positivity and confirmed cases. Presentations of acute respiratory infections to GPs increased in most age groups. Respiratory Syncytial Virus (RSV) is currently circulating, with confirmed cases in children under 5 years old at very high levels, although the incidence decreased in the most recent week.
Free Flu vaccinations are available for individuals aged 65 and older, certain young children, pregnant women, and those with specific medical conditions. With the Flu season in full swing, it's a good idea to check your eligibility and book a vaccination through the provided link.
Status of main respiratory diseases in Northern Ireland.
Public Health Northern Ireland publish a weekly surveillance report on influenza, respiratory syncytial virus (RSV), and Covid providing an overview of these infections within Northern Ireland.
Covid activity activity has remained stable and at low levels across all surveillance indicators. Meanwhile, Flu activity has decreased across the majority of surveillance indicators although rates are highest in young children. RSV activity has decreased across some surveillance indicators and is circulating at moderately low levels.
The following chart shows the test positivity rates in Northern Ireland for the main respiratory illnesses — Flu, RSV, and Covid and RSV. Shading represents 95% confidence intervals.
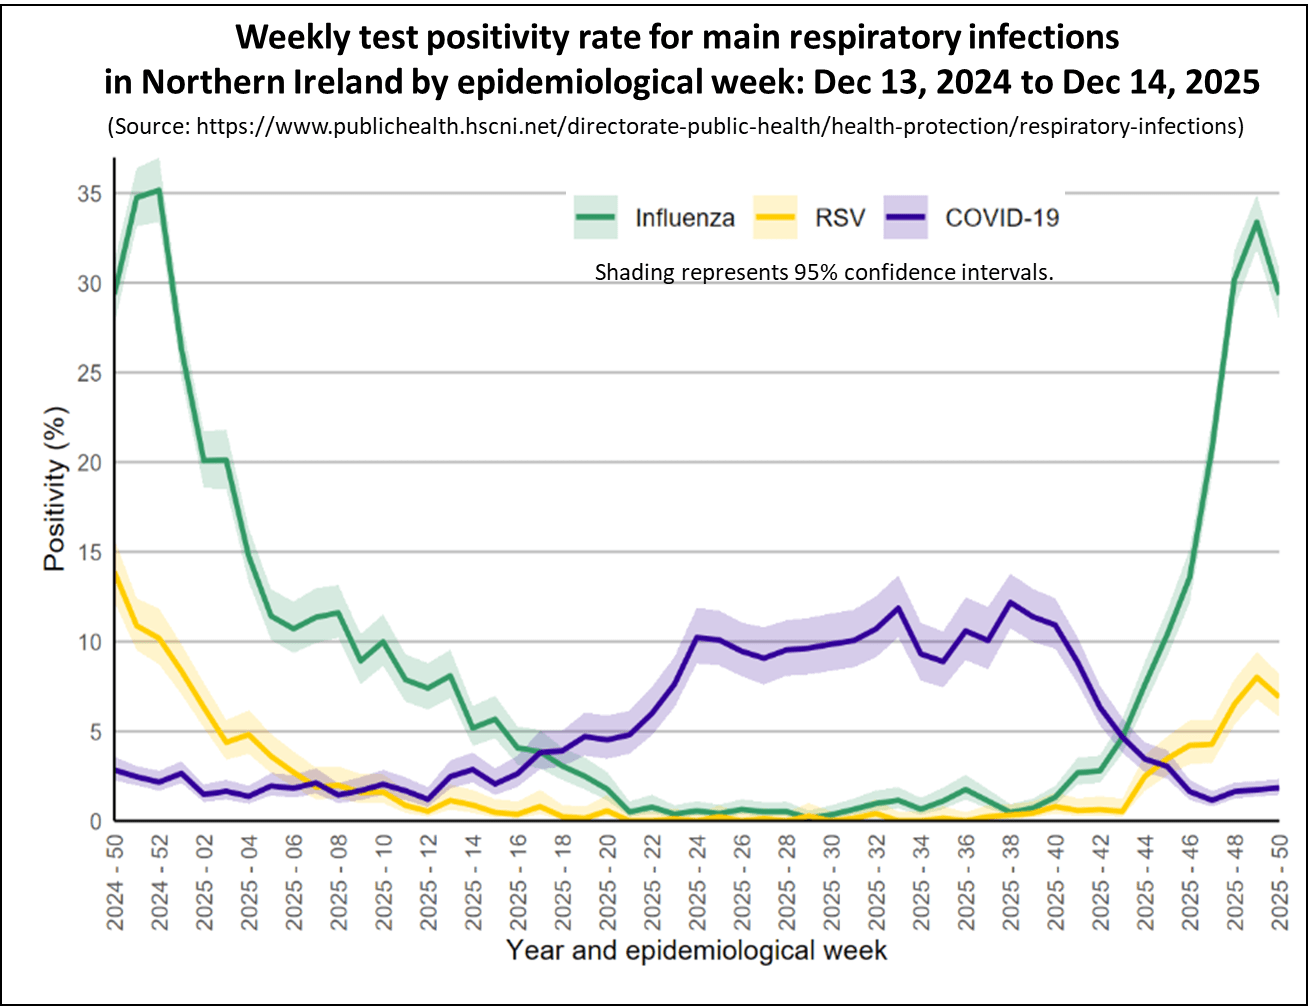
The chart shows that the Covid test positivity rate for patients with respiratory illnesses, marked in blue, has stayed about the same this week at 1.8%, compared to 1.7% last week, indicating a low level of Covid activity.
Flu test positivity, shown in green, has stopped suggesting that this wave has peaked. This week, Flu positivity reached 29.3%, down from 33.4% in the prior week. The highest rate remains in the 5-14 age group, with 48.4% testing positive.
Information about who qualifies for free flu vaccinations and how to schedule an appointment can be found at the provided link.
Flu vaccinations in Northern Ireland
Covid Levels in Europe and North America.
This section looks at the latest data on Covid activity in Europe and North America. While Covid levels have increased in several countries across these regions, they generally remain lower than those observed during earlier waves.
The following chart shows the latest levels of Covid as measured by monitoring wastewater in a number of European countries that still publish this information.
Once again, it's a mixed picture for European countries reporting Covid levels in wastewater. While Covid levels in wastewater rose across all countries, activity varied quite considerably, with Denmark seeing moderately high levels and France experiencing relatively low levels. The situation in Austria is presently uncertain due to recent changes in their reporting methods is making the data difficult to interpret.
The CDC has resumed publishing U.S. health metrics after the government shutdown, and the latest data shows Covid activity remains low nationwide. However, some areas are showing signs of increasing activity.
The following chart presents the weekly trend for the national key Covid indicators covering test positivity, wastewater activity levels, percent of emergency department visits due to Covid, and the hospital admission rate. Whilst there has been a slight increase across all indicators, Covid activity remains relatively low nationally.
This chart shows the regional wastewater activity trends for Covid, highlighting that levels are climbing the fastest in the Northeast.
Wastewater analysis reveals that although Covid levels remain low or very low in most US states, many are starting to see increases, as shown in the map below. Each state is coloured based on activity levels, ranging from very high (dark red) to very low (light green), with grey indicating no data available. States with increasing activity levels are marked with cross-hatching.
The interactive map lets you hover over any state to see more details about wastewater viral activity levels. It displays data for states across the country for the week ending Dec c, 2025.
The interactive map shows wastewater activity levels increased in 40 states last week, up from 21 the week before, while 33 states remained at low or very low activity levels, down from 44 the previous week.
The final chart for the USA shows the percentage of Emergency Department visits caused by the main respiratory illnesses—Covid and Flu. It indicates that activity levels for these viruses are currently low, though Flu cases are continuing to increase.
Finally, the latest data from Canada shows that Covid wastewater levels are steady at moderate levels, while flu levels are rising fast.
Autumn 2025 Covid Booster campaign.
The NHS Autumn Covid booster campaign started on October 1, 2025. This year's Autumn vaccination campaign is set to end earlier in England than in previous years, with the majority of vaccinations scheduled to be completed by the end of November. However, outreach efforts to administer vaccines in underserved communities will continue after this date.
The following chart shows the number of Covid vaccinations given by week for each of the booster campaigns in England.
In the week ending December 14, there were 48,117 booster doses administered, down from 62,492 the previous week, bringing the total to 4.61 million doses as the campaign comes to a close.
The next chart in this section compares the latest Covid vaccination coverage by Home Nation for the two main eligible groups. It shows that coverage is much lower for immunosuppressed individuals compared to those aged 75 and older.
In conclusion
Although the amount of data currently being published is reduced, the information available for all home nations show that Covid activity is relatively low. The recent rise in Flu activity appears to have peaked at moderate levels.
Covid activity in Europe is showing some early signs of increasing, particularly in Germany. In the USA, activity levels remain low although some states are seeing increased activity.
As always, if you have any comments on this Covid Situation Report or suggestions for topics to cover, please post a message below.
Thanks for reading Seeing The Forest for the Trees! Subscribe for free to receive new posts and support my work.
Appendix 1. Test positivity rates and prevalence
Positivity rates are derived from the results of hospital laboratory tests conducted on patients exhibiting symptoms of respiratory diseases. Test positivity is the percentage of patients who test positive for Covid of the total number of patients tested. Since the individuals tested for this measure are not a representative sample of the general population it differs from prevalence, which is derived from a representative sample of the population.
This report belongs to a weekly series summarising the Covid situation across the UK's home nations and other countries.
Thanks for reading Seeing The Forest for the Trees! Subscribe for free to receive new posts and support my work.
This week's report covers the latest weekly indicators of respiratory illness activity for England, along with the most recent data for Scotland, Wales, and Northern Ireland. The report also presents the data on Covid levels in selected countries in Europe and North America. Finally, there is an update latest status on the Autumn 2025 Covid Booster campaign including data on inequalities in coverage in England.
Summary.
Once again, the main Covid indicators in England, Scotland, Wales, and Northern Ireland stayed low this week, indicating a low level of risk, though there are some early signs of increased activity in Wales and Northern Ireland.
Flu and RSV activity continues to increase significantly across all home nations, indicating this years winter Flu season is well underway. If you haven't had your Flu vaccination yet, there's still time to do so.
Public Heath Scotland report that early seasonal Flu vaccine effectiveness data shows the vaccine is providing good protection against the currently circulating variant. The data shows a 78% reduced risk of hospitalisation in ages 2-17 and 37% in those 65 and over. Similar results were observed in pooled estimates from Scotland, Northern Ireland and Wales, and with early estimates from England.
In England, the Covid test positivity rate stayed steady this week, well within the baseline activity level. The main hospital indicators also remained mostly unchanged, suggesting a low level of risk. However, flu activity is on the rise, with both hospital admissions and test positivity rates climbing quickly. Hospital admissions are highest among people over 85 years old with Flu and children under 5 years with RSV.
In Scotland, all indicators of Covid activity remained at low levels of activity this week. Positivity rates and hospital admissions for Flu continued to rise and are now at high levels of activity.
In the past week, Covid hospital admissions in Wales increased slightly while remaining at low levels of activity. Hospital admissions for Flu increased and are approaching medium activity levels.
In Northern Ireland, Covid activity increased slightly across some surveillance indicators in the past week but are still at low levels. However, Flu and RSV activity levels are rising fast.
This week is again a mixed picture for European countries reporting Covid levels in wastewater. Activity is clearly on the rise in Germany, with some indications of increases in other countries as well, though starting from relatively low levels.
CDC data have resumed publishing data this week and all indicators show that Covid activity in the USA is low. Flu indicators are also low although there are signs of increasing activity.
The NHS Autumn Covid booster campaign started on October 1, 2025 with the aim of completing most vaccinations by the end of November 2025. Scotland is doing well so far, with 66% of people aged 75 and over already vaccinated, though coverage among the immunosuppressed remains much lower at 40%.
Free vaccinations in the Autumn 2025 booster campaign will be available for adults aged 75 and older by January 31, 2026; residents in care homes for older adults; and immunosuppressed individuals aged 6 months and above.
People registered with a GP surgery in England can check their eligibility and book a vaccination appointment through this link.
Details of booking a free NHS Covid vaccination in Scotland can be found here, for Wales here, and in Northern Ireland here.
As always, it's important to remember that the risk of hospitalisation from Covid increases significantly with age and for the clinically vulnerable. Therefore, it is important to take appropriate measures such as self-isolating when experiencing Covid symptoms and enhancing ventilation or wearing masks whenever possible.
Status of main respiratory diseases in England.
This section begins with the latest data on test positivity rates for Covid in England. It's important to note that positivity is different from prevalence, which reflects the overall percentage of Covid cases in the general population. Appendix 1 offers a more detailed explanation of the distinction.
The following chart shows the test positivity rate for all Covid tests taken mapped against the UKHSA activity thresholds. The thresholds are based on the historical trend for Covid test positivity and, consequently, represent a relative risk. More details on this approach can be found in the Guide to Covid Surveillance Metrics.
The chart indicates that the test positivity rate was again stable this week and is well below the baseline level of activity, indicating a low level of risk. Positivity rates decreased across all regions, showing only small differences between them.
The next chart highlights four key indicators of Covid in hospitals: weekly Emergency Department visits for Covid-like symptoms, test positivity rates among patients with respiratory issues, hospital admission rates, and admission rates for intensive care.
All key hospital indicators for Covid activity remained stable this week and overall activity is at historically low levels.
The final chart shows hospital admission rates per 100,000 for the three main respiratory viruses. Covid admissions are historically low, while Flu and RSV admissions have risen significantly. Both are now much higher than Covid, indicating that Flu and RSV currently pose a greater risk. If you're experiencing Covid-like symptoms, there's a good chance it is Flu or RSV.
The last chart in this section shows hospital admission rates per 100,000 people by age group for Covid, Flu, and RSV for the week ending December 7, 2025.
The chart clearly shows that the risk of hospitalisation is highest among the very youngest age group and the elderly for both Flu and RSV. While current hospital admissions for Covid are lower, the elderly remain more likely to be hospitalised.
With the Flu season underway, it's a good idea to check your eligibility and book a free vaccination through the following link.
Scotland weekly hospital admissions and test positivity
Public Health Scotland (PHS) continue to publish weekly data on Covid hospital admissions and test positivity as well as wastewater monitoring data. The latest Viral respiratory diseases in Scotland surveillance report can be accessed here.
The following panel chart presents the most recent data for weekly Covid test positivity shown in red, Covid levels in wastewater in blue, Covid hospital admissions depicted in orange, and beds occupied by Covid patients in brown.
Covid indicators in Scotland stayed stable and low this week, indicating the risk from the virus remains low.
The final chart in this section compares the test positivity rates for hospital patients with respiratory symptoms for Covid, Flu, and RSV.
While the Covid test positivity is low, Flu positivity rates continue to increase significantly and are much higher than for Covid. The current Flu positivity rate is also much higher than it was at the same time last year, showing that the winter Flu season has arrived earlier than usual and is in full swing.
Flu activity in Scotland rose at a more moderate pace this week, but has already hit the high activity threshold earlier than in past seasons. Cases went up 24% to 2,331 from 1,875, and hospital admissions climbed 15% to 986 from 860. However, both figures are increasing more slowly than last week. Fortunately, there's no indication so far that this year's flu is a more severe illness, based on intensive care admissions.
With the Flu season well underway in Scotland, now is the time to check if you're eligible for a free Flu vaccination here. If you haven't been contacted yet, you can book your vaccination using the following link.
Wales Covid hospital admissions.
During the winter season, Public Health Wales publishes a weekly respiratory infection report, which is available here. The following chart provides the latest trend for weekly hospital admissions for the main respiratory viruses in Wales up to week ending Dec 7, 2025.
Covid hospital admissions remained stable this week and are at low levels. However Flu and RSV activity levels are rising fast.
This weeks Weekly Acute Respiratory Infection Report confirms that Flu is approaching medium intensity levels, with increases in test positivity and confirmed cases. Cases of acute respiratory infections seen by GPs have also gone up across most age groups. Respiratory Syncytial Virus (RSV) is currently spreading, with confirmed cases in children under 5 years old at very high levels.
Free Flu vaccinations are available for individuals aged 65 and older, certain young children, pregnant women, and those with specific medical conditions. With the Flu season in full swing, it's a good idea to check your eligibility and book a vaccination through the provided link.
Status of main respiratory diseases in Northern Ireland.
Public Health Northern Ireland publish a weekly surveillance report on influenza, respiratory syncytial virus (RSV), and Covid providing an overview of these infections within Northern Ireland.
Covid activity continues to remain low across most surveillance indicators but there are some signs of increasing activity. Meanwhile, Flu activity continues to rise across surveillance indicators, especially among children, and this increase is happening earlier than in previous influenza seasons. RSV activity increased across all surveillance indicators, particularly among younger children, but is still circulating at moderately low levels.
The following chart shows the test positivity rates in Northern Ireland for the main respiratory illnesses — Flu, RSV, and Covid and RSV. Shading represents 95% confidence intervals.
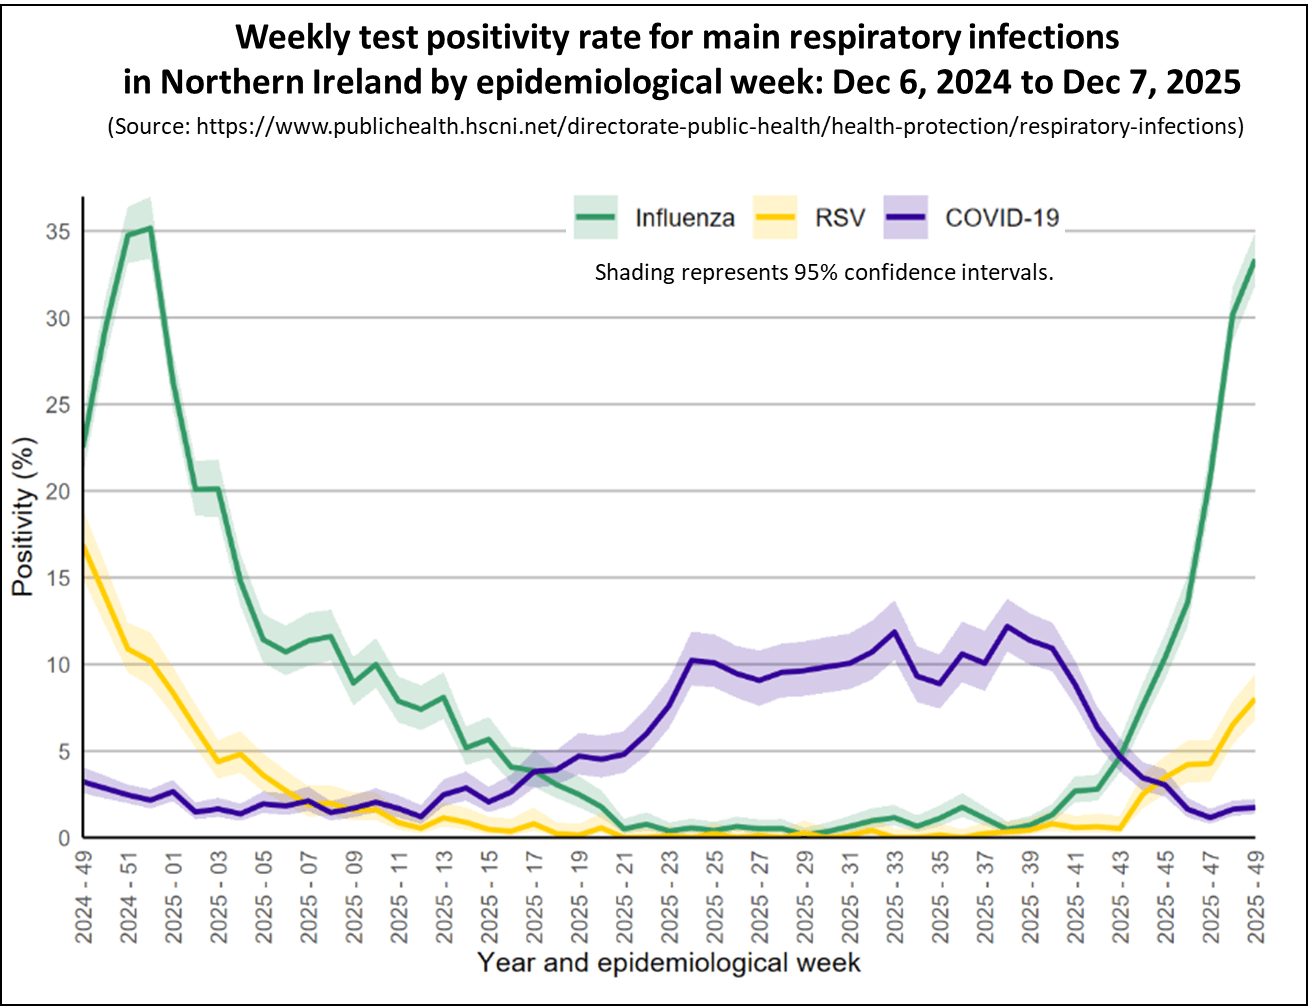
The chart shows that the Covid test positivity rate for patients with respiratory illnesses, marked in blue, has stayed about the same this week at 1.7%, compared to 1.6% last week, suggesting a low level of Covid activity.
Flu test positivity, shown in green, keeps climbing which signals the Flu season is well underway. This week, Flu positivity reached 33.4%, up from 30.2% in the prior week. The highest rate was in the 5-14 age group, with 57% testing positive.
Information about who qualifies for free flu vaccinations and how to schedule an appointment can be found at the provided link.
Flu vaccinations in Northern Ireland
Covid Levels in Europe and North America.
This section looks at the latest data on Covid activity in Europe and North America. While Covid levels have increased in several countries across these regions, they generally remain lower than those observed during earlier waves.
The following chart shows the latest levels of Covid as measured by monitoring wastewater in a number of European countries that still publish this information.
Once again, it's a mixed picture for European countries reporting Covid levels in wastewater. Activity is clearly on the rise in Germany, with some early indications of increases in the Netherlands, Denmark, and France. The situation in Austria is presently uncertain due to recent changes in their reporting methods and there was no update for Sweden this week.
The CDC has now updated U.S. health metrics after the government shutdown confirming that Covid activity has fallen and is at a low level.
The following chart presents the weekly trend for the national key Covid indicators covering test positivity, wastewater activity levels, percent of emergency department visits due to Covid, and the hospital admission rate, up to November 29, 2025. It shows low levels of Covid activity continue at the national level.
Wastewater analysis also shows that Covid levels are low or very low across most US States, as illustrated in the following map. Each state is coloured based on activity levels, ranging from very high (dark red) to very low (light green), with grey indicating no data available. States with increasing activity levels are marked with cross-hatching.
The interactive map lets you hover over any state to see more details about wastewater viral activity levels. It displays data for states across the country for the week ending November 29, 2025.
The interactive map shows wastewater activity levels increased in 19 states last week, down from 23 the week before, while 44 states remained at low or very low activity levels, unchanged from the previous week. Note that some states have limited coverage this week, such as Arizona, so it's a good idea to check a state's coverage by hovering your cursor over a state on the map.
The final chart for the USA shows the percentage of Emergency Department visits caused by the main respiratory illnesses—Covid and Flu. It indicates that activity levels for these viruses are currently low, though Flu cases are starting to increase.
Finally, the latest data from Canada shows that Covid wastewater levels are steady at moderate levels, while flu levels are starting to rise albeit from low levels.
Autumn 2025 Covid Booster campaign.
The NHS Autumn Covid booster campaign started on October 1, 2025. This year's Autumn vaccination campaign is set to end earlier in England than in previous years, with the majority of vaccinations scheduled to be completed by the end of November. However, outreach efforts to administer vaccines in underserved communities will continue after this date.
The following chart shows the number of Covid vaccinations given by week for each of the booster campaigns in England.
In the week ending December 7, there were 61,178 booster doses were administered, down from 88,129 the previous week, bringing the total to 4.56 million doses as the campaign comes to a close.
The next chart in this section provides the latest Covid vaccination coverage by Home Nation for the two main eligible groups. The chart indicates that while England and Scotland are making solid progress, Wales and Northern Ireland are progressing more slowly.
In conclusion
Although the amount of data currently being published is reduced, the information available for all home nations show that Covid activity is relatively low. However Flu activity continues to rise in all home nations indicating an early start to the Winter Flu season.
Covid activity in Europe is showing some early signs of increasing, particularly in Germany. In the USA, activity levels remain low.
As always, if you have any comments on this Covid Situation Report or suggestions for topics to cover, please post a message below.
Thanks for reading Seeing The Forest for the Trees! Subscribe for free to receive new posts and support my work.
Appendix 1. Test positivity rates and prevalence
Positivity rates are derived from the results of hospital laboratory tests conducted on patients exhibiting symptoms of respiratory diseases. Test positivity is the percentage of patients who test positive for Covid of the total number of patients tested. Since the individuals tested for this measure are not a representative sample of the general population it differs from prevalence, which is derived from a representative sample of the population.
This report belongs to a weekly series summarising the Covid situation across the UK's home nations and other countries.
Thanks for reading Seeing The Forest for the Trees! Subscribe for free to receive new posts and support my work.
This week's report covers the latest weekly indicators of respiratory illness activity for England, along with the most recent data for Scotland, Wales, and Northern Ireland. The report also presents the data on Covid levels in selected countries in Europe and North America. Finally, there is an update latest status on the Autumn 2025 Covid Booster campaign including data on inequalities in coverage in England.
Summary.
Once again, the main Covid indicators in England, Scotland, Wales, and Northern Ireland remained low this week indicating a low level of risk.
Flu and RSV activity continues to increase significantly across all home nations, signalling an early start to this years winter Flu season. If you haven't had your Flu vaccination yet, now is a great time to get it.
In England, the Covid test positivity rate remained stable this week and well within the baseline activity level. All of the main hospital indicators also were broadly unchanged this week indicating a low level of risk. Flu indicators showed increasing levels of activity, with hospital admission and test positivity rates increasing fast.
In Scotland, all indicators of Covid activity fell this week and remain at low levels of activity. Positivity rates and hospital admissions for Flu continued to rise significantly.
In the past week, Covid hospital admissions in Wales remained stable at low levels of activity. Hospital admissions for Flu increased and are at medium activity levels.
In Northern Ireland, Covid activity increased slightly across all surveillance indicators in the past week but are still at low levels. However, Flu and RSV activity levels are rising fast.
Covid levels in wastewater samples across European countries sharing this data show a mixed picture. While most countries have dropped to low levels or remain steady at moderate activity, levels in Germany have continued to increase.
CDC data have resumed publishing data this week and all indicators show that Covid activity in the USA is low. Flu indicators are also low although there are early signs of increasing activity.
The NHS Autumn Covid booster campaign started on October 1, 2025 with the aim of completing most vaccinations by the end of November 2025. England is doing well so far, with 61% of people aged 75 and over already vaccinated, though coverage among the immunosuppressed remains much lower at just 28%. There are also significant differences in coverage between regions, ethnic groups, and more deprived areas.
Free vaccinations in the Autumn 2025 booster campaign will be available for adults aged 75 and older by January 31, 2026; residents in care homes for older adults; and immunosuppressed individuals aged 6 months and above.
People registered with a GP surgery in England can check their eligibility and book a vaccination appointment through this link.
Details of booking a free NHS Covid vaccination in Scotland can be found here, for Wales here, and in Northern Ireland here.
As always, it's important to remember that the risk of hospitalisation from Covid increases significantly with age and for the clinically vulnerable. Therefore, it is important to take appropriate measures such as self-isolating when experiencing Covid symptoms and enhancing ventilation or wearing masks whenever possible.
Status of main respiratory diseases in England.
This section begins with the latest data on test positivity rates for Covid in England. It's important to note that positivity is different from prevalence, which reflects the overall percentage of Covid cases in the general population. Appendix 1 offers a more detailed explanation of the distinction.
The following chart shows the test positivity rate for all Covid tests taken mapped against the UKHSA activity thresholds. The thresholds are based on the historical trend for Covid test positivity and, consequently, represent a relative risk. More details on this approach can be found in the Guide to Covid Surveillance Metrics.
The chart indicates that the test positivity rate remained stable this week and is well below the baseline level of activity, indicating a low level of risk. Positivity rates decreased across all regions, showing only small differences between them.
The next chart highlights four key indicators of Covid in hospitals: weekly Emergency Department visits for Covid-like symptoms, test positivity rates among patients with respiratory issues, hospital admission rates, and admission rates for intensive care.
All key hospital indicators for Covid activity remained stable this week and overall activity is at historically low levels.
The final chart shows hospital admission rates per 100,000 for the three main respiratory viruses. Covid admissions are historically low, while Flu and RSV admissions have risen significantly. Both are now much higher than Covid, indicating that Flu and RSV currently pose a greater risk. If you're experiencing Covid-like symptoms, there's a good chance it is Flu or RSV.
With the Flu season underway, it's a good idea to check your eligibility and book a free vaccination through the following link.
Scotland weekly hospital admissions and test positivity
Public Health Scotland (PHS) continue to publish weekly data on Covid hospital admissions and test positivity as well as wastewater monitoring data. The latest Viral respiratory diseases in Scotland surveillance report can be accessed here.
The following panel chart presents the most recent data for weekly Covid test positivity shown in red, Covid levels in wastewater in blue, Covid hospital admissions depicted in orange, and beds occupied by Covid patients in brown.
The main indicators of Covid in Scotland continued to fall this week indicating a decrease in Covid activity which are now at low levels.
The final chart in this section compares the test positivity rates for hospital patients with respiratory symptoms for Covid, Flu, and RSV.
While the Covid test positivity is low, Flu positivity rates are climbing very fast and are now much higher than for Covid. The current Flu positivity rate is also much higher than it was at the same time last year, showing that the winter Flu season has arrived earlier than usual and is already in full swing.
This is supported by laboratory-confirmed cases for Flu more than doubling, rising from 845 to 1,759, and hospital admissions increasing by 70%, from 426 to 724. Although the highest case rates were observed in younger age groups, approximately 40% of hospital admissions were people aged 65 years and over, broadly consistent with previous seasons.
With the Flu season well underway in Scotland, now is the time to check if you're eligible for a free Flu vaccination here. If you haven't been contacted yet, you can book your vaccination using the following link.
Wales Covid hospital admissions.
During the winter season, Public Health Wales publishes a weekly respiratory infection report, which is available here. The following chart provides the latest trend for weekly hospital admissions for the main respiratory viruses in Wales up to week ending Nov 30, 2025.
Covid hospital admissions remained stable this week and are at low levels. However Flu and RSV activity levels are rising fast.
This weeks Weekly Acute Respiratory Infection Report confirms that Flu is circulating widely and activity increased last week, with substantial increases in test positivity, confirmed cases (in the community and in hospitals) and in admissions to hospital. Presentations of acute respiratory infections in children and adolescents to GPs also increased sharply last week. Respiratory Syncytial Virus (RSV) is circulating, with incidence of confirmed cases in under 5 year olds currently at very high levels.
Free Flu vaccinations are available for individuals aged 65 and older, certain young children, pregnant women, and those with specific medical conditions. With the Flu season in full swing, it's a good idea to check your eligibility and book a vaccination through the provided link.
Status of main respiratory diseases in Northern Ireland.
Public Health Northern Ireland publish a weekly surveillance report on influenza, respiratory syncytial virus (RSV), and Covid providing an overview of these infections within Northern Ireland.
Covid activity continues to remain low across most surveillance indicators but there are some signs of increasing activity. Meanwhile, Flu activity continues to rise across surveillance indicators, especially among children, and this increase is happening earlier than in previous influenza seasons. RSV activity increased across all surveillance indicators, particularly among younger children, but is still circulating at moderately low levels.
The following chart shows the test positivity rates in Northern Ireland for the main respiratory illnesses — Flu, RSV, and Covid and RSV. Shading represents 95% confidence intervals.
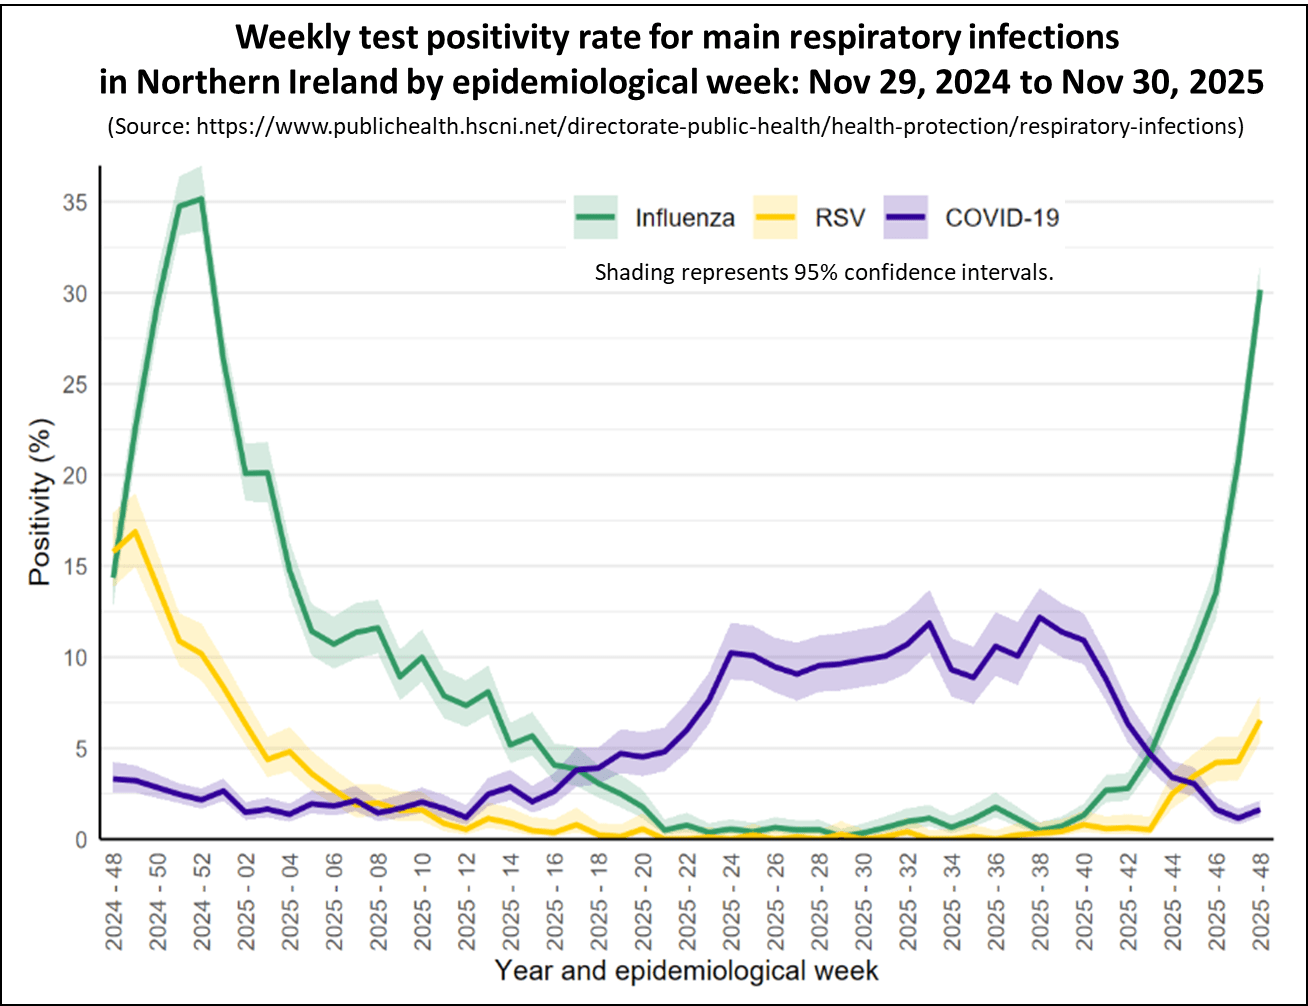
The chart shows that the Covid test positivity rate for those patients with respiratory illnesses, marked in blue, has increased slightly this week to 1.6% from 1.2% last week, indicating a low level of Covid activity.
Flu test positivity, shown in green, keeps climbing which signals an early start to the Flu season. This week, Flu positivity reached 30.2%, up from 20.8% in the prior week. The highest rate was in the 5-14 age group, with 54.2% testing positive.
Information about who qualifies for free flu vaccinations and how to schedule an appointment can be found at the provided link.
Flu vaccinations in Northern Ireland
Covid Levels in Europe and North America.
This section looks at the latest data on Covid activity in Europe and North America. While Covid levels have increased in several countries across these regions, they generally remain lower than those observed during earlier waves.
The following chart shows the latest levels of Covid as measured by monitoring wastewater in a number of European countries that still publish this information.
This week continues to present a mixed picture for European countries that still publish Covid levels found in wastewater. In Germany, levels have stopped declining and are now rising, suggesting the recent wave of Covid activity isn't over yet. In the Netherlands, France, Denmark and Sweden they've remained steady, whilst the situation in Austria is uncertain due to recent changes in their reporting methods.
The CDC has now updated U.S. health metrics after the government shutdown confirming that Covid activity has fallen and is at a low level.
The following chart presents the weekly trend for the national key Covid indicators covering test positivity, wastewater activity levels, percent of emergency department visits due to Covid, and the hospital admission rate, up to November 22, 2025. It shows low levels of Covid activity at the national level.
Wastewater analysis also shows that Covid levels are low or very low across most US States, as illustrated in the following map. Each state is coloured based on activity levels, ranging from very high (dark red) to very low (light green), with grey indicating no data available. States with increasing activity levels are marked with cross-hatching.
The interactive map lets you hover over any state to see more details about wastewater viral activity levels. It displays data for states across the country for the week ending November 22, 2025.
The interactive map shows that wastewater activity levels rose in 23 states last week, with 45 states at low or very low activity levels.
The following chart for the USA shows the percentage of Emergency Department visits caused by the main respiratory illnesses—Covid, Flu, and RSV. It indicates that activity levels for all three viruses are currently low, though Flu cases are starting to increase.
Finally, the latest data from Canada shows that Covid wastewater levels are steady at moderate levels, while flu levels are starting to rise albeit from low levels.
Autumn 2025 Covid Booster campaign.
The NHS Autumn Covid booster campaign started on October 1, 2025. This year's Autumn vaccination campaign is set to end earlier in England than in previous years, with the majority of vaccinations scheduled to be completed by the end of November. However, outreach efforts to administer vaccines in underserved communities will continue after this date.
The following chart shows the number of Covid vaccinations given by week for each of the booster campaigns in England.
In the week ending November 30, there were 86,460 booster doses were administered, down from 112,041 the previous week, bringing the total to 4.49 million doses in the campaign's first eight weeks.
The next chart in this section provides the latest Covid vaccination coverage by Home Nation for the two main eligible groups. The chart indicates that while England and Scotland are making solid progress, Wales and Northern Ireland are progressing more slowly.
This week, NHS England released more details of the Autumn 2025 Covid booster campaign, highlighting the uneven coverage seen across the country. The following chart illustrates the regional difference in coverage for the two main eligible groups.
The chart shows a clear regional difference with London having the lowest coverage for both eligible groups. This is consistent with the pattern seen in previous campaigns.
The final chart in this section shows the inequality in coverage by deprivation level and ethnicity.
Just like in previous campaigns, people in the most deprived areas are far less likely to be vaccinated compared to those in the least deprived areas. Likewise, vaccination rates continue to be much lower among individuals from ethnic minority groups.
In conclusionAlthough the amount of data currently being published is reduced, the information available for all home nations show that Covid activity is relatively low. However Flu activity is rising in all home nations indicating an early start to the Winter Flu season.
Covid activity in Europe is mostly declining or holding steady, although it's on the rise in Germany. In the USA, activity levels remain low.
As always, if you have any comments on this Covid Situation Report or suggestions for topics to cover, please post a message below.
Thanks for reading Seeing The Forest for the Trees! Subscribe for free to receive new posts and support my work.
Appendix 1. Test positivity rates and prevalence
Positivity rates are derived from the results of hospital laboratory tests conducted on patients exhibiting symptoms of respiratory diseases. Test positivity is the percentage of patients who test positive for Covid of the total number of patients tested. Since the individuals tested for this measure are not a representative sample of the general population it differs from prevalence, which is derived from a representative sample of the population.
This report belongs to a weekly series summarising the Covid situation across the UK's home nations and other countries.
Thanks for reading Seeing The Forest for the Trees! Subscribe for free to receive new posts and support my work.
This week's report covers the latest weekly indicators of respiratory illness activity for England, along with the most recent data for Scotland, Wales, and Northern Ireland. The report also presents the data on Covid levels in selected countries in Europe and North America. Finally, there is an update latest status on the Autumn 2025 Covid Booster campaign.
Summary.
Once again, the main Covid indicators in England, Scotland, Wales, and Northern Ireland have fallen this week and are at relatively low levels.
Flu and RSV activity is increasing across all home nations, signalling an early start to this years winter Flu season. If you haven't had your Flu vaccination yet, now is a great time to get it.
In England, the Covid test positivity rate again fell this week and well within the baseline activity level. All of the main hospital indicators also fell this week indicating a reducing level of risk. Flu indicators showed increasing levels of activity, with hospital admission and test positivity rates increasing.
In Scotland, all indicators of Covid activity fell this week and remain at low levels of activity. Positivity rates and hospital admissions for Flu continued to rise significantly.
In the past week, Covid hospital admissions in Wales remained stable at low levels of activity. Hospital admissions for Flu increased and are at low-medium levels.
In Northern Ireland, Covid activity has decreased across all surveillance indicators in the past week indicating a low level of risk. However, Flu and RSV activity levels are rising.
Covid levels in wastewater samples across European countries sharing this data show a mixed picture. While most countries have dropped to low levels or remain steady at moderate activity, levels in Germany and Austria have risen slightly.
CDC data have resumed publishing data this week and all indicators show that Covid activity in the USA is low. Flu indicators are also low although there are early signs of increasing activity.
The NHS Autumn Covid booster campaign started on October 1, 2025 with the aim of completing most vaccinations by the end of November 2025. England is doing well so far, with 60% of people aged 75 and over already vaccinated, though coverage among the immunosuppressed is much lower at just 27%.
Free vaccinations in the Autumn 2025 booster campaign will be available for adults aged 75 and older by January 31, 2026; residents in care homes for older adults; and immunosuppressed individuals aged 6 months and above.
People registered with a GP surgery in England can check their eligibility and book a vaccination appointment through this link.
Details of booking a free NHS Covid vaccination in Scotland can be found here, for Wales here, and in Northern Ireland here.
As always, it's important to remember that the risk of hospitalisation from Covid increases significantly with age and for the clinically vulnerable. Therefore, it is important to take appropriate measures such as self-isolating when experiencing Covid symptoms and enhancing ventilation or wearing masks whenever possible.
Status of main respiratory diseases in England.
This section begins with the latest data on positivity rates for Covid in England. It's important to note that positivity is different from prevalence, which reflects the overall percentage of Covid cases in the general population. Appendix 1 offers a detailed explanation of the distinction and highlights why positivity rates are a valuable indicator of trends in Covid infection levels.
The following chart shows the test positivity rate for all Covid tests taken mapped against the UKHSA activity thresholds. The thresholds are based on the historical trend for Covid test positivity and, consequently, represent a relative risk. More details on this approach can be found in the Guide to Covid Surveillance Metrics.
The chart indicates that the test positivity rate again fell this week and is now well below the baseline level of activity, indicating a low level of risk. Positivity rates decreased across all regions, showing only small differences between them.
The next chart highlights four key indicators of Covid in hospitals: weekly Emergency Department visits for Covid-like symptoms, test positivity rates among patients with respiratory issues, hospital admission rates, and admission rates for intensive care.
All key hospital indicators for Covid activity that were published this week have continued to decline and overall activity is at historically low levels. Unfortunately, data on test positivity for patients with respiratory symptoms was once again not released this week.
The final chart shows hospital admission rates per 100,000 for the three main respiratory viruses. Covid admissions have kept dropping, while Flu and RSV admissions have gone up. Both are now higher than Covid, indicating that Flu and RSV currently pose a greater risk. If you're experiencing Covid-like symptoms, there's a good chance it is Flu or RSV.
With the Flu season underway, it's a good idea to check your eligibility and book a free vaccination through the following link.
Scotland weekly hospital admissions and test positivity
Public Health Scotland (PHS) continue to publish weekly data on Covid hospital admissions and test positivity as well as wastewater monitoring data. The dashboard for Scotland's data can be accessed here.
The following panel chart presents the most recent data for weekly Covid test positivity shown in red, Covid levels in wastewater in blue, Covid hospital admissions depicted in orange, and beds occupied by Covid patients in brown.
The main indicators of Covid in Scotland continued to fall this week indicating a decrease in Covid activity which are now at low levels.
The final chart in this section compares the test positivity rates for hospital patients with respiratory symptoms for Covid, Flu, and RSV.
While Covid cases keep dropping, Flu positivity rates are climbing quickly and have now surpassed those of Covid. The current Flu positivity rate is also much higher than it was at the same time last year, showing that the winter Flu season has arrived earlier than usual and is already in full swing. This is supported by the steady rise in weekly hospital admissions for flu, which increased to 391 this week from 279 the week before.
With the Flu season starting in Scotland, now is the time to check if you're eligible for a free Flu vaccination here. If you haven't been contacted yet, you can book your vaccination using the following link.
Wales Covid hospital admissions.
During the winter season, Public Health Wales publishes a weekly respiratory infection report, which is available here. The following chart provides the latest trend for weekly hospital admissions for the main respiratory viruses in Wales up to week ending Nov 23, 2025.
Covid hospital admissions remained stable this week and are at low levels. However Flu and RSV activity levels are rising.
This weeks Weekly Acute Respiratory Infection Report confirms that Flu is still spreading in communities across Wales, with confirmed cases in patients showing symptoms at GP practices in every region. Over recent weeks, rates of consultations for flu-like illness have gone up, along with confirmed case numbers and the percentage of patients testing positive. The RSV season has also begun, and confirmed cases in children under five are now above the very high activity threshold.
Free Flu vaccinations are available for individuals aged 65 and older, certain young children, pregnant women, and those with specific medical conditions. With the Flu season starting, it's a good idea to check your eligibility and book a vaccination through the provided link.
Status of main respiratory diseases in Northern Ireland.
Public Health Northern Ireland publish a weekly surveillance report on influenza, respiratory syncytial virus (RSV), and Covid providing an overview of these infections within Northern Ireland.
Covid activity continues to fall across most surveillance indicators and is at relatively low levels. Meanwhile, Flu activity is on the rise across surveillance indicators, especially among children, and this increase is happening earlier than in previous influenza seasons. RSV activity increased across some surveillance indicators, particularly among younger children, but is circulating at low levels.
The first chart in this section shows the test positivity rates in Northern Ireland for the main respiratory illnesses — Flu, RSV, and Covid and RSV. Shading represents 95% confidence intervals.
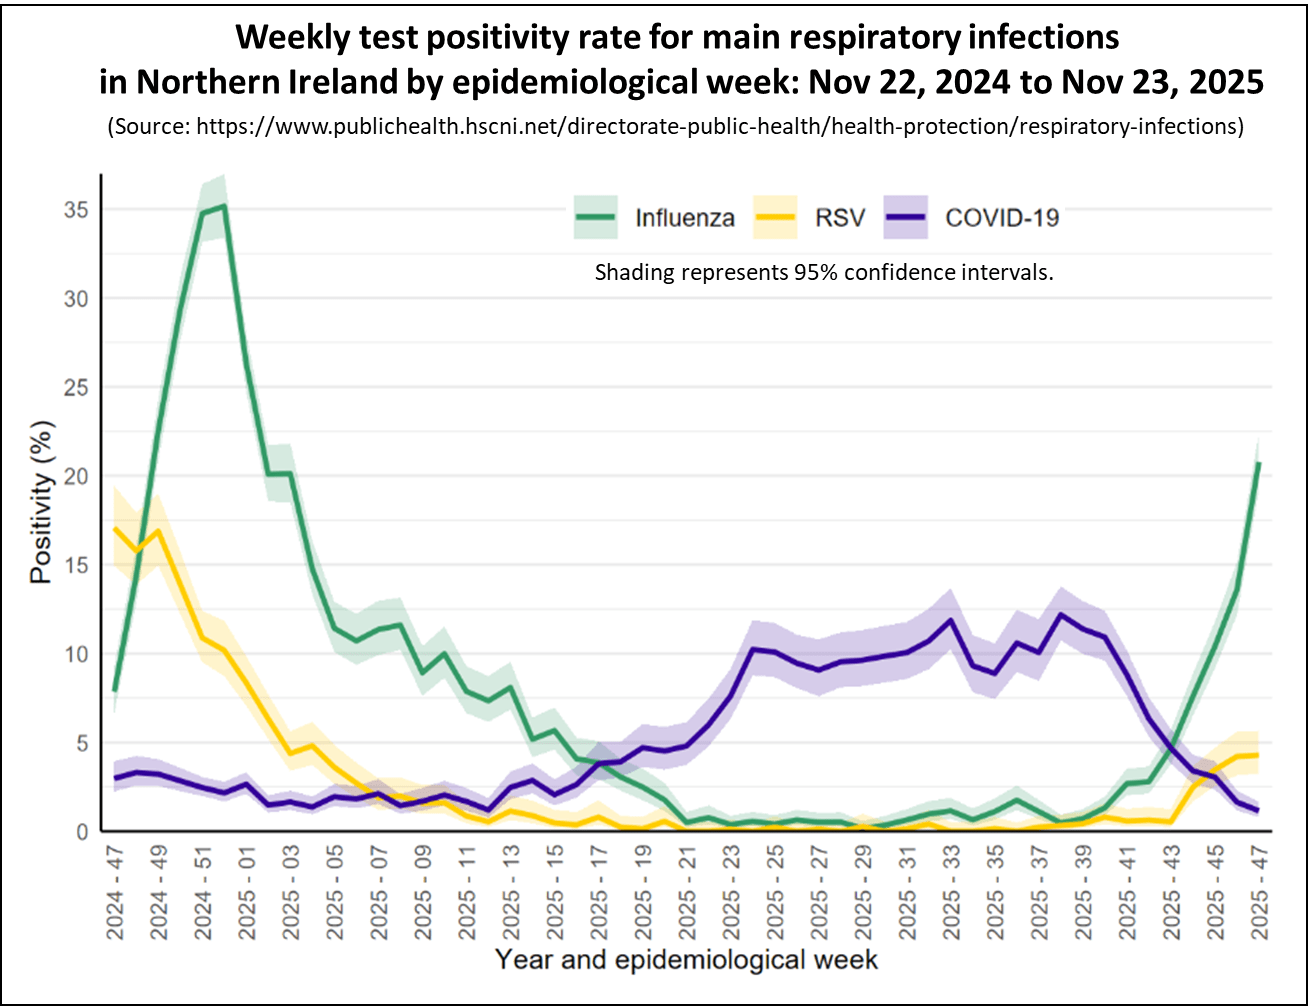
The chart shows that the Covid test positivity rate for those patients with respiratory illnesses, marked in blue, has dropped again this week to 1.2% from 2.2% last week, indicating a low level of Covid activity.
Flu test positivity, shown in green, keeps climbing which signals an early start to the Flu season. This week, Flu positivity reached 20.8%, up from 13.6% in the prior week. The highest rate was in the 5-14 age group, with 52.3% testing positive.
Information about who qualifies for free flu vaccinations and how to schedule an appointment can be found at the provided link.
Flu vaccinations in Northern Ireland
Covid Levels in Europe and North America.
This section looks at the latest data on Covid activity in Europe and North America. While Covid levels have increased in several countries across these regions, they generally remain lower than those observed during earlier waves.
The following chart shows the latest levels of Covid as measured by monitoring wastewater in a number of European countries that still publish this information.
This week presents a mixed picture for European countries that still publish Covid levels found in wastewater. In Germany and Austria levels have stopped falling and are now increasing indicating that the recent wave in Covid activity is not yet over. Levels in the Netherlands and France continue to fall while those in Denmark and Sweden remained stable.
The CDC has now updated U.S. health metrics after the government shutdown confirming that Covid activity has fallen and is at a low level.
The following chart presents the weekly trend of wastewater activity levels of Covid by region, along with the national level, up to November 15, 2025.
The chart shows that Covid activity has fallen to low levels for all states and the next chart confirms this by indicating that all key national Covid measures are also low.
The following chart for the USA shows the percentage of visits made to Emergency Departments due the main respiratory illnesses. The chart indicates that activity levels for all these viruses is currently low although Flu activity is beginning to rise.
Finally, the latest data from Canada shows that Covid wastewater levels are steady at moderate levels, while flu levels fell remain low.
Autumn 2025 Covid Booster campaign.
The NHS Autumn Covid booster campaign started on October 1, 2025. This year's Autumn vaccination campaign is set to end earlier in England than in previous years, with the majority of vaccinations scheduled to be completed by the end of November. However, outreach efforts to administer vaccines in underserved communities will continue after this date.
The following chart shows the number of Covid vaccinations given by week for each of the booster campaigns in England.
In the week ending November 23, there were 109,523 booster doses were administered, down from 165,978 the previous week, bringing the total to 4.4 million doses in the campaign's first seven weeks.
The last chart in this section provides the latest Covid vaccination coverage by Home Nation for the two main eligible groups. The chart indicates that while England, Scotland and Northern Ireland are making solid progress, Wales is progressing more slowly.
In conclusion
Although the amount of data currently being published is reduced, the information available for all home nations show that Covid levels continued to fall and Covid activity is relatively low. However Flu activity is rising in all home nations indicating an early start to the Winter Flu season.
Covid activity in Europe is mostly declining or holding steady, although it's on the rise in Germany and Austria. In the USA, activity levels remain low.
As always, if you have any comments on this Covid Situation Report or suggestions for topics to cover, please post a message below.
Thanks for reading Seeing The Forest for the Trees! Subscribe for free to receive new posts and support my work.
Appendix 1. Test positivity rates and prevalence
Positivity rates are derived from the results of hospital laboratory tests conducted on patients exhibiting symptoms of respiratory diseases. Test positivity is the percentage of patients who test positive for Covid of the total number of patients tested. Since the individuals tested for this measure are not a representative sample of the general population it differs from prevalence, which is derived from a representative sample of the population.
Test positivity rates, while not directly estimating the number of Covid infections in the general population, can be a valuable indicator of the infection trend. The panel chart below compares the weekly test positivity rate among hospital patients with respiratory symptoms to the prevalence of Covid in the general population, as reported in the Winter Infection Survey.
The chart shows that the weekly test positivity rates for patients with symptoms of respiratory infections follows the same pattern as the prevalence for Covid reported by the Winter Infection Survey. Since the Winter Infection Survey is based on a representative sample of the general population this supports using test positivity as a useful proxy for infection trends. However it is not possible to use test positivity to estimate prevalence.
This report belongs to a weekly series summarising the Covid situation across the UK's home nations and other countries.
Thanks for reading Seeing The Forest for the Trees! Subscribe for free to receive new posts and support my work.
This week's report covers the latest weekly indicators of respiratory illness activity for England, along with the most recent data for Scotland, Wales, and Northern Ireland. The report also presents the data on Covid levels in selected countries in Europe and North America. Finally, there is an update on deaths due to Covid in England and Wales, followed by the latest status on the Autumn 2025 Covid Booster campaign.
Summary.
The main Covid indicators in England, Scotland, Wales, and Northern Ireland have continued to decline and are at relatively low levels.
Flu activity is increasing across all home nations, signalling an early start to this years winter Flu season. If you haven't had your Flu vaccination yet, now is a great time to get it.
In England, the Covid test positivity rate again fell this week and well within the baseline activity level. All of the main hospital indicators also fell this week indicating a reducing level of risk. Flu indicators showed a mixed picture, with positivity rates climbing while hospital admission rates fell for the second week. However, both remain higher than those for Covid.
In Scotland, all indicators of Covid activity fell this week and remain at low levels of activity. Positivity rates and hospital admissions for Flu continued to rise.
In the past week, Covid hospital admissions in Wales fell but and are at low levels of activity. Hospital admissions for Flu increased slightly and remain at low levels.
In Northern Ireland, Covid activity has decreased across most surveillance indicators in the past week indicating a lowering of risk. However, Flu and RSV activity levels are rising.
Covid levels in wastewater samples across most European countries that still share this data have continued to drop, except in Austria where levels have risen slightly.
At the time of publishing limited CDC data was published but hospital admissions for Covid continued to fall this week and are at low levels.
Deaths due to Covid in England and Wales have increased on the past month, but remain lower than the same period last year.
The NHS Autumn Covid booster campaign started on October 1, 2025 with the aim of completing most vaccinations by the end of November 2025. England is making good progress with 59% of those aged 75 years and older vaccinated to date.
Free vaccinations in the Autumn 2025 booster campaign will be available for adults aged 75 and older by January 31, 2026; residents in care homes for older adults; and immunosuppressed individuals aged 6 months and above.
People registered with a GP surgery in England can check their eligibility and book a vaccination appointment through this link.
Details of booking a free NHS Covid vaccination in Scotland can be found here, for Wales here, and in Northern Ireland here.
As always, it's important to remember that the risk of hospitalisation from Covid increases significantly with age and for the clinically vulnerable. Therefore, it is important to take appropriate measures such as self-isolating when experiencing Covid symptoms and enhancing ventilation or wearing masks whenever possible.
Status of main respiratory diseases in England.
This section begins with the latest data on positivity rates for Covid in England. It's important to note that positivity is different from prevalence, which reflects the overall percentage of Covid cases in the general population. Appendix 1 offers a detailed explanation of the distinction and highlights why positivity rates are a valuable indicator of trends in Covid infection levels.
The following chart shows the test positivity rate for all Covid tests taken mapped against the UKHSA activity thresholds. The thresholds are based on the historical trend for Covid test positivity and, consequently, represent a relative risk. More details on this approach can be found in the Guide to Covid Surveillance Metrics.
The chart indicates that the test positivity rate again fell this week and is well below the baseline level of activity, indicating a low level of risk. Positivity rates decreased across all regions, showing only small differences between them. Test positivity rates fell across all age groups but remain highest among individuals aged 85 and older.
The next chart highlights four key indicators of Covid in hospitals: weekly Emergency Department visits for Covid-like symptoms, test positivity rates among patients with respiratory issues, hospital admission rates, and admission rates for intensive care.
Although the test positivity rate for hospital patients was not published this week, all of the other key hospital indicators for Covid activity continued to fall, confirming that the recent wave is over and overall Covid activity is low.
The final chart presents the hospital admissions rate per 100,000 for the three main respiratory viruses. Covid admission rates have continued to decline, and although Flu admissions have also decreased, they remain higher than those for Covid, indicating that Flu now poses a greater risk.
With the Flu season underway, it's a good idea to check your eligibility and book a free vaccination through the following link.
Scotland weekly hospital admissions and test positivity
Public Health Scotland (PHS) continue to publish weekly data on Covid hospital admissions and test positivity as well as wastewater monitoring data. The dashboard for Scotland's data can be accessed here.
The following panel chart presents the most recent data for weekly Covid test positivity shown in red, Covid levels in wastewater in blue, Covid hospital admissions depicted in orange, and beds occupied by Covid patients in brown.
The main indicators of Covid in Scotland all fell this week indicating a decrease in Covid activity which are now at relatively low levels.
The final chart in this section compares the test positivity rates for hospital patients with respiratory symptoms for Covid, Flu, and RSV.
While Covid levels are continuing to fall, Flu positivity rates are climbing fast and are now much higher than those of Covid, indicating that the winter Flu season is well underway. This is backed up by the continuing increase in weekly hospital admissions for Flu, which reached 240 this week.
With the Flu season starting in Scotland, now is the time to check if you're eligible for a free Flu vaccination here. If you haven't been contacted yet, you can book your vaccination using the following link.
Wales Covid hospital admissions.
During the winter season, Public Health Wales publishes a weekly respiratory infection report, which is available here. The following chart provides the latest trend for weekly hospital admissions for the main respiratory viruses in Wales up to week ending Nov 16, 2025.
Covid hospital admissions have continued to fall this week after a recent increase and are now at low levels.
This weeks Weekly Acute Respiratory Infection Report confirms that Flu is still spreading in communities across Wales, with confirmed cases in patients showing symptoms at GP practices in every region. Over recent weeks, rates of consultations for flu-like illness have gone up, along with confirmed case numbers and the percentage of patients testing positive. The RSV season has also begun, and confirmed cases in children under five are now above the very high activity threshold.
Free Flu vaccinations are available for individuals aged 65 and older, certain young children, pregnant women, and those with specific medical conditions. With the Flu season getting started, it's a good idea to check your eligibility and book a vaccination through the provided link.
Status of main respiratory diseases in Northern Ireland.
Public Health Northern Ireland publish a weekly surveillance report on influenza, respiratory syncytial virus (RSV), and Covid providing an overview of these infections within Northern Ireland.
Covid activity continues to fall across most surveillance indicators and is at relatively low levels. Meanwhile, Flu activity is on the rise across surveillance indicators, especially among children, and this increase is happening earlier than in previous influenza seasons. RSV activity increased across some surveillance indicators, particularly among younger children, but is circulating at low levels.
The first chart in this section shows the test positivity rates in Northern Ireland for the main respiratory illnesses — Flu, RSV, and Covid and RSV. Shading represents 95% confidence intervals.
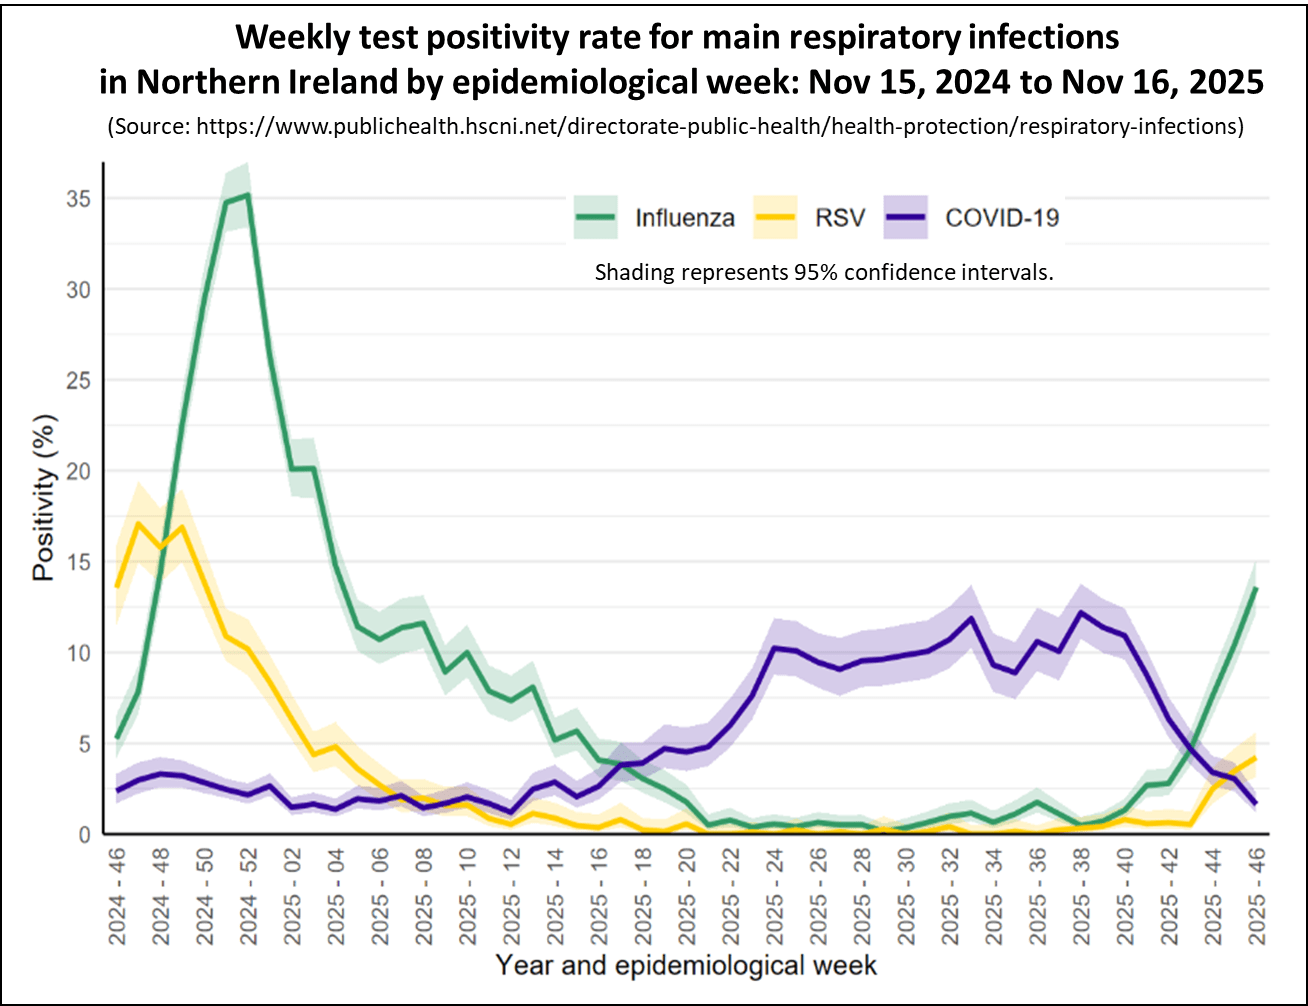
The chart shows that the Covid test positivity rate, marked in blue, has dropped again this week to 1.6% from 3.1% last week, indicating a slowdown in Covid activity.
Flu test positivity, shown in green, keeps climbing, signalling an early start to the flu season. This week, flu positivity reached 13.6%, up from 10.4% in the prior week. The highest rate was in the 5-14 age group, with 38.4% testing positive.
Information about who qualifies for free flu vaccinations and how to schedule an appointment can be found at the provided link.
Flu vaccinations in Northern Ireland
Covid Levels in Europe and North America.
This section looks at the latest data on Covid activity in Europe and North America. While Covid levels have increased in several countries across these regions, they generally remain lower than those observed during earlier waves.
The following chart shows the latest levels of Covid as measured by monitoring wastewater in a number of European countries that still publish this information.
Over the past week, Covid activity fell in most European countries that still publish Covid levels found in wastewater, indicating that the recent wave in Covid activity is over. The exception was Austria which had a slight increase.
The CDC is working on updating U.S. health metrics after the government shutdown, but some Covid data is still not fully up-to-date or available. For example, Covid levels in wastewater won't be released until November 21. In the meantime, the following chart shows hospital admissions for Covid per 100,000 people up to November 8, 2025.
The chart shows that Covid hospital admissions have fallen significantly and are at low levels indicating low levels of activity. However, it's worth noting that this data source does not cover all states.
Alternative sources have stepped in to bridge the gap by compiling the available data as best they can. In particular, readers should follow the Force of Infection and Dr Ruth's Newsletter substacks for more information. Notably, both substacks emphasise the rising levels of Flu and RSV activity, albeit they are at low levels.
The latest data from Canada shows that Covid wastewater levels are steady at moderate levels, while flu levels fell back and remain low.
Covid deaths in England and Wales
The Office of National Statistics (ONS) releases weekly reports on deaths listed on certificates due to or involving Covid. The data covers both England and Wales. The following chart compares the weekly deaths due to Covid in England and Wales for 2024-25 with the same period for 2023-24. The figures in the chart are based on the date a death was registered, which is usually later than the date it occurred.
In recent months, Covid-related deaths have increased from the relatively low numbers seen over the summer. This mirrors the trend from last year, when deaths also rose during the same period.
However, deaths due to Covid were lower in almost every week of 2024-25 compared to the same weeks in 2023-24. During the period shown, the number of deaths in 2024-25 (3,311) was just under a half of those recorded in 2023-24 (7,001).
Autumn 2025 Covid Booster campaign.
The NHS Autumn Covid booster campaign started on October 1, 2025. This year's Autumn vaccination campaign is set to end earlier in England than in previous years, with the majority of vaccinations scheduled to be completed by the end of November. However, outreach efforts to administer vaccines in underserved communities will continue after this date.
The following chart shows the number of Covid vaccinations given by week for each of the booster campaigns in England.
In the week ending November 16, there were 162,679 booster doses were administered, down from 243,561 the previous week, bringing the total to 4.29 million doses in the campaign's first seven weeks. This progress is faster than previous campaigns, despite targeting a smaller eligible population. For instance, by the seventh week of the Spring 2025 campaign, only 3.48 million doses had been administered.
The last chart in this section provides the latest Covid vaccination coverage by Home Nation for the two main eligible groups. The chart indicates that while England, Scotland and Northern Ireland are making solid progress, Wales is progressing more slowly.
In conclusion
Although the amount of data currently being published is reduced, the information available for all home nations show that Covid levels continued to fall and Covid activity is relatively low. However Flu activity is rising in all home nations indicating an early start to the Winter Flu season.
Covid activity in Europe is falling in most countries and remains stable in others. In the USA, activity levels remain at low levels.
As always, if you have any comments on this Covid Situation Report or suggestions for topics to cover, please post a message below.
Thanks for reading Seeing The Forest for the Trees! Subscribe for free to receive new posts and support my work.
Appendix 1. Test positivity rates and prevalence
Positivity rates are derived from the results of hospital laboratory tests conducted on patients exhibiting symptoms of respiratory diseases. Test positivity is the percentage of patients who test positive for Covid of the total number of patients tested. Since the individuals tested for this measure are not a representative sample of the general population it differs from prevalence, which is derived from a representative sample of the population.
Test positivity rates, while not directly estimating the number of Covid infections in the general population, can be a valuable indicator of the infection trend. The panel chart below compares the weekly test positivity rate among hospital patients with respiratory symptoms to the prevalence of Covid in the general population, as reported in the Winter Infection Survey.
The chart shows that the weekly test positivity rates for patients with symptoms of respiratory infections follows the same pattern as the prevalence for Covid reported by the Winter Infection Survey. Since the Winter Infection Survey is based on a representative sample of the general population this supports using test positivity as a useful proxy for infection trends. However it is not possible to use test positivity to estimate prevalence.
This report belongs to a weekly series summarising the Covid situation across the UK's home nations and other countries.
Thanks for reading Seeing The Forest for the Trees! Subscribe for free to receive new posts and support my work.
This week's report covers the latest weekly indicators of respiratory illness activity for England, along with the most recent data for Scotland, Wales, and Northern Ireland. The report also presents the data on Covid levels in selected countries in Europe and North America. Finally, there is an update on the progress of the Autumn 2025 Covid Booster campaign.
The Covid Situation report depends on the availability of reliable data, which has become harder to access over time. If you are a UK citizen, you might consider supporting a petition urging the UKHSA to monitor COVID infections in specific settings. You can find the petition at the following link.
Summary.
The main Covid indicators in England, Scotland, Wales, and Northern Ireland have continued to decline and are at relatively low levels.
Flu activity is increasing across all home nations, signalling an early start to this years winter Flu season. If you haven't had your Flu vaccination yet, now is a great time to get it.
In England, the Covid test positivity rate again fell this week and well within the baseline activity level. All of the main hospital indicators also fell this week indicating a reducing level of risk. Flu indicators showed a mixed picture, with positivity rates climbing quickly while hospital admission rates dipped slightly. However, both remain higher than those for Covid.
In Scotland, all indicators of Covid activity fell this week and remain at low levels of activity. Positivity rates and hospital admissions for Flu continued to rise fast.
In the past week, Covid hospital admissions in Wales fell but and are still at moderate levels of activity. The increase in hospital admissions for Flu seen last week did not continue as admissions fell slightly this week and remain at low levels.
In Northern Ireland, Covid activity has decreased across most surveillance indicators in the past week indicating a lowering of risk. However, Flu activity levels are rising.
Covid levels detected in wastewater samples for most European countries that still publish this data continued to fall.
At the time of publishing no CDC data was published this week due to the government shutdown, alternative sources show that Covid levels in the USA continued to fall and remain at low levels of activity.
The NHS Autumn Covid booster campaign started on October 1, 2025 with the aim of completing most vaccinations by the end of November 2025. England is making good progress with 56% of those aged 75 years and older vaccinated to date.
Free vaccinations in the Autumn 2025 booster campaign will be available for adults aged 75 and older by January 31, 2026; residents in care homes for older adults; and immunosuppressed individuals aged 6 months and above.
People registered with a GP surgery in England can check their eligibility and book a vaccination appointment through this link.
Details of booking a free NHS Covid vaccination in Scotland can be found here, for Wales here, and in Northern Ireland here.
As always, it's important to remember that the risk of hospitalisation from Covid increases significantly with age and for the clinically vulnerable. Therefore, it is important to take appropriate measures such as self-isolating when experiencing Covid symptoms and enhancing ventilation or wearing masks whenever possible.
Status of main respiratory diseases in England.
This section begins with the latest data on positivity rates for Covid in England. It's important to note that positivity is different from prevalence, which reflects the overall percentage of Covid cases in the general population. Appendix 1 offers a detailed explanation of the distinction and highlights why positivity rates are a valuable indicator of trends in Covid infection levels.
The following chart shows the test positivity rate for all Covid tests taken mapped against the UKHSA activity thresholds. The thresholds are based on the historical trend for Covid test positivity and, consequently, represent a relative risk. More details on this approach can be found in the Guide to Covid Surveillance Metrics.
The chart indicates that the test positivity rate again fell this week and is below the baseline level of activity, indicating a falling risk. Positivity rates decreased across all regions, showing only small differences between them. Test positivity rates fell across all age groups but remained highest among individuals aged 85 and older.
The next chart highlights four key indicators of Covid in hospitals: weekly Emergency Department visits for Covid-like symptoms, test positivity rates among patients with respiratory issues, hospital admission rates, and admission rates for intensive care.
All key hospital indicators for Covid activity declined again this week, indicating that the recent wave is over.
The next chart in this section shows the test positivity rate for hospital patients for the main respiratory illnesses. It is notable that Flu positivity continued to increase significantly and is now much higher than Covid. This indicates an unusually early start of the Flu season with higher levels seen in children and young adults.
The final chart presents the hospital admissions rate per 100,000 for the three main respiratory viruses and confirms that Flu now presents a greater risk than Covid.
With the Flu season underway, it's a good idea to check your eligibility and book a free vaccination through the following link.
Scotland weekly hospital admissions and test positivity
Public Health Scotland (PHS) continue to publish weekly data on Covid hospital admissions and test positivity as well as wastewater monitoring data. The dashboard for Scotland's data can be accessed here.
The following panel chart presents the most recent data for weekly Covid test positivity shown in red, Covid levels in wastewater in blue, Covid hospital admissions depicted in orange, and beds occupied by Covid patients in brown.
The main indicators of Covid in Scotland all fell this week indicating a decrease in Covid activity levels. The trend in recent months showing indicators rising slowly has now stopped and the peak is over.
The final chart in this section shows the test positivity rates for patients with respiratory symptoms for Covid, Flu, and RSV.
While Covid levels have falling, Flu positivity rates are climbing fast and are now much higher than those of Covid, indicating that the winter Flu season is well underway. This is backed up by the increase in weekly hospital admissions for Flu, which reached 220 this week, almost doubling the number of admission of the previous week.
With the Flu season starting in Scotland, now is the time to check if you're eligible for a free Flu vaccination here. If you haven't been contacted yet, you can book your vaccination using the following link.
Wales Covid hospital admissions.
During the winter season, Public Health Wales publishes a weekly respiratory infection report, which is available here. The following chart provides the latest trend for weekly hospital admissions for the main respiratory viruses in Wales up to week ending Nov 9, 2025.
Covid hospital admissions have continued to fall this week after a recent increase, though they remain at moderate levels. Surveillance evidence shows that Flu and RSV are beginning to spread in the community, with activity still low but steadily increasing.
Free Flu vaccinations are available for individuals aged 65 and older, certain young children, pregnant women, and those with specific medical conditions. With the Flu season approaching, it's a good idea to check your eligibility and book a vaccination through the provided link.
Status of main respiratory diseases in Northern Ireland.
Public Health Northern Ireland publish a weekly surveillance report on influenza, respiratory syncytial virus (RSV), and Covid providing an overview of these infections within Northern Ireland.
Covid activity continues to fall across most surveillance indicators and is at relatively low levels. Meanwhile, Flu activity is on the rise across various surveillance indicators, especially among children, and this increase is happening earlier than in previous influenza seasons.
The first chart in this section shows the test positivity rates in Northern Ireland for the main respiratory illnesses — Flu, RSV, and Covid and Rhinovirus. Shading represents 95% confidence intervals.
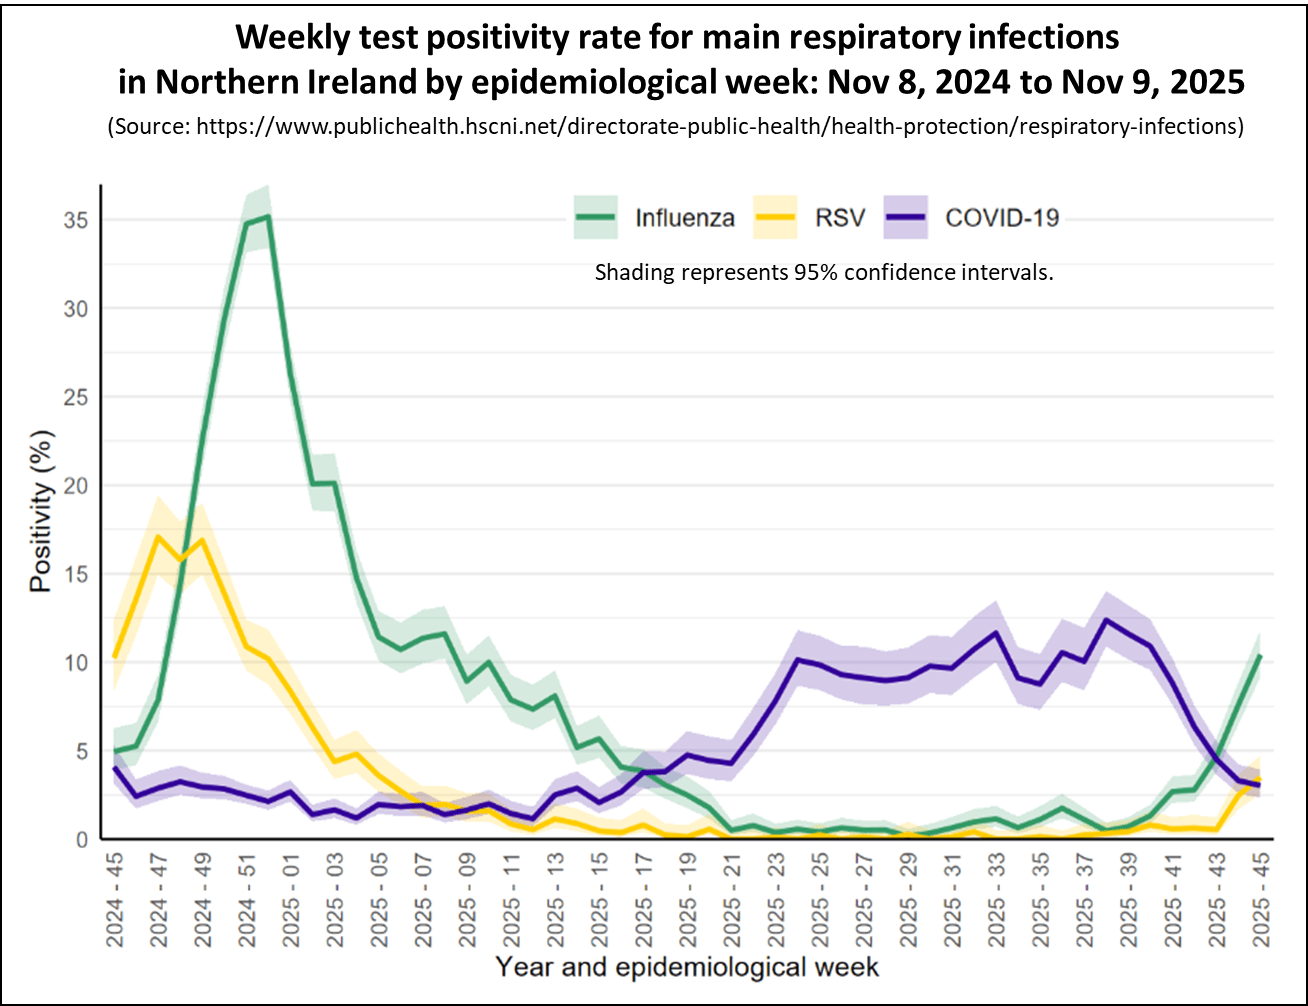
The chart shows that the Covid test positivity rate, represented in blue, has again decreased this week, suggesting a decline in Covid activity. However, flu test positivity, shown in green, continues to rise, indicating an early start to the flu season.
Information about who qualifies for free flu vaccinations and how to schedule an appointment can be found at the provided link.
Flu vaccinations in Northern Ireland
Covid Levels in Europe and North America.
This section looks at the latest data on Covid activity in Europe and North America. While Covid levels have increased in several countries across these regions, they generally remain lower than those observed during earlier waves.
The following chart shows the latest levels of Covid as measured by monitoring wastewater in a number of European countries that still publish this information.
Over the past week, Covid activity fell in all European countries that still publish Covid levels found in wastewater, indicating that the recent wave in Covid activity is over.
At the time of publishing, the CDC has not updated the U.S. Covid dashboard data despite the government shutdown recently ending. However, data on Covid levels in wastewater is available from sources beyond the CDC, and the following chart comes from the WastewaterSCAN Dashboard.
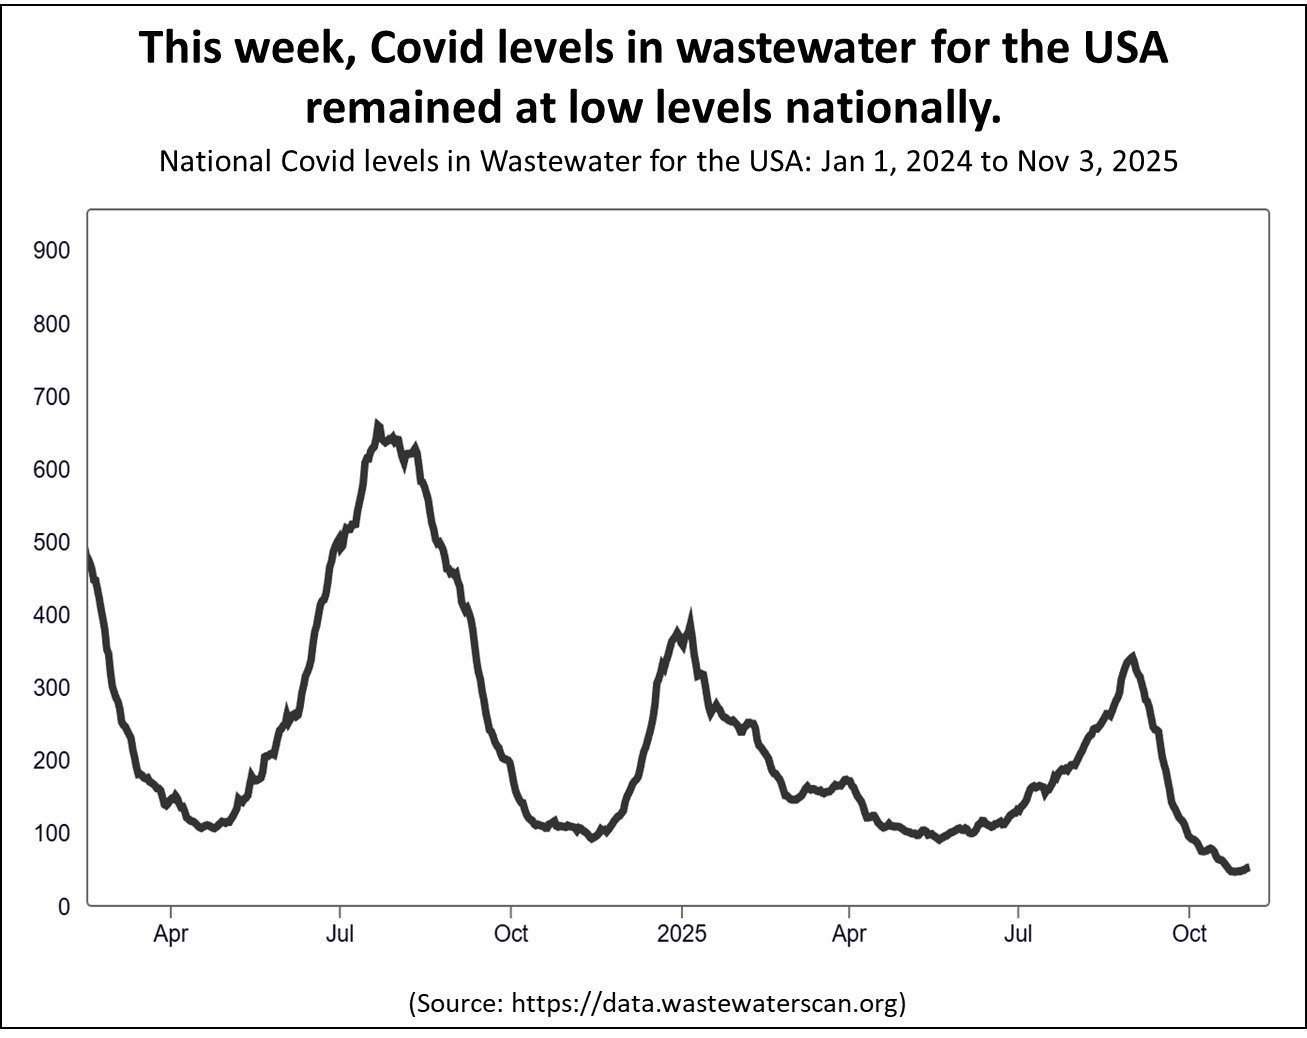
The following chart shows that there are regional differences with South and West regions having lower levels of Covid activity compared to the Northeast and Midwest regions. However, it's worth noting that this data source does not cover all states.
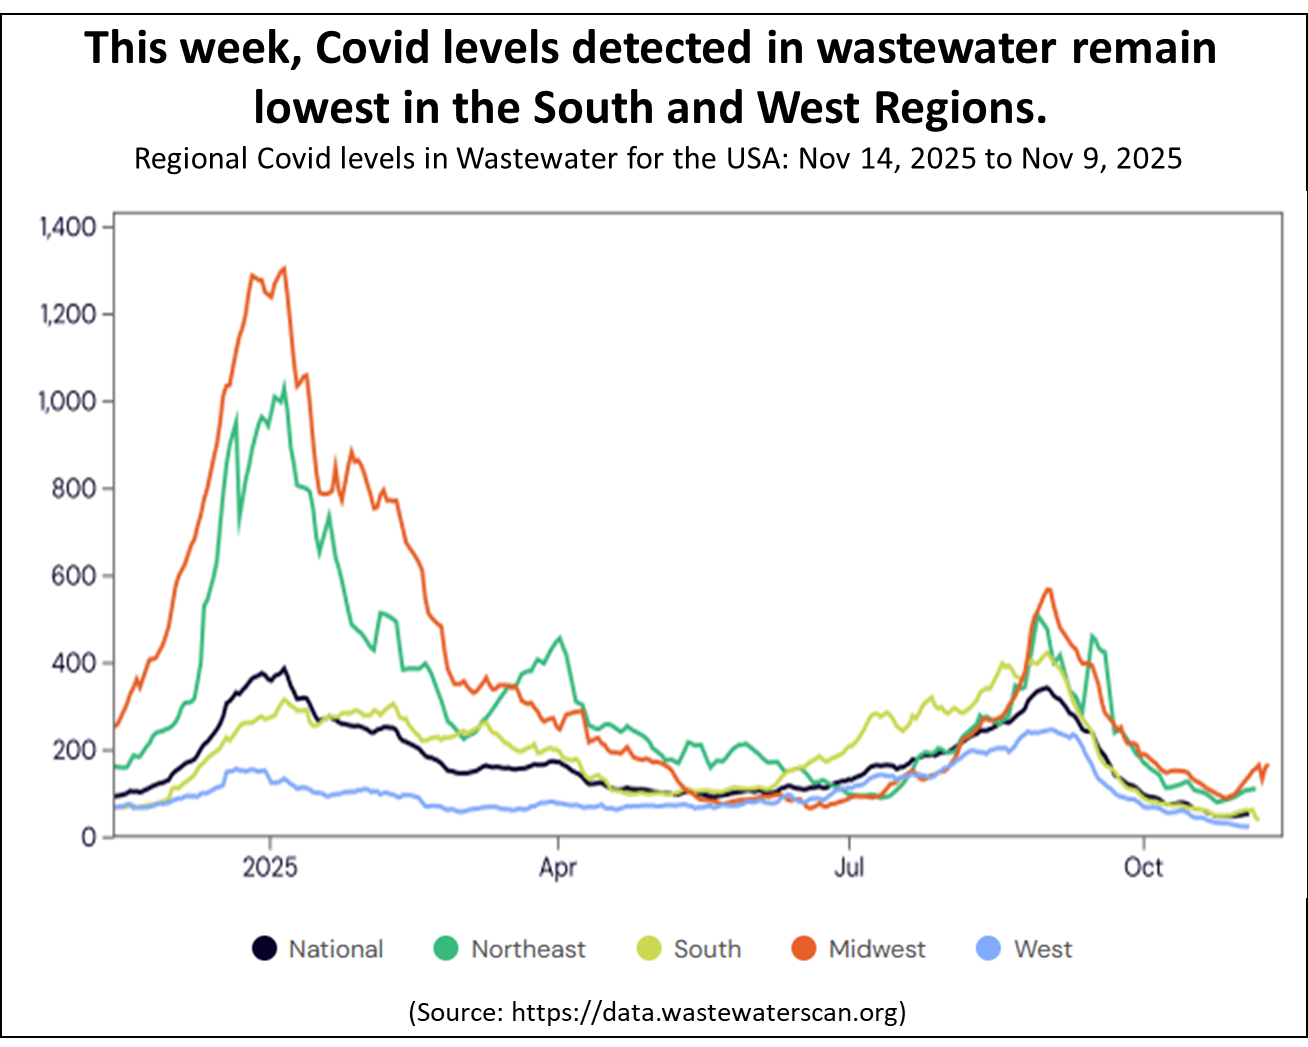
Alternative sources are also stepping in to bridge the gap by compiling the available data as best they can. In particular, interested readers should follow the Force of Infection and Dr Ruth's Newsletter substacks for more information. Notably, both substacks emphasise the rising levels of Flu and RSV activity.
The latest data from Canada shows that Covid wastewater levels are steady at moderate levels, while flu levels fell back and remain low.
Autumn 2025 Covid Booster campaign.
The NHS Autumn Covid booster campaign started on October 1, 2025. This year's Autumn vaccination campaign is set to end earlier in England than in previous years, with the majority of vaccinations scheduled to be completed by the end of November. However, outreach efforts to administer vaccines in underserved communities will continue after this date.
The following chart shows the number of Covid vaccinations given by week for each of the booster campaigns in England.
In the week ending November 9, there were 237,807 booster doses were administered, down from 325,392 the previous week, bringing the total to 4.11 million doses in the campaign's first six weeks. This progress is much faster than previous campaigns, despite targeting a smaller eligible population. For instance, by the sixth week of the Spring 2025 campaign, only 3.29 million doses had been administered.
The last chart in this section provides the latest Covid vaccination coverage by Home Nation for the two main eligible groups. The chart indicates that while England is making solid progress, Scotland and Wales are progressing more slowly.
In conclusion
Although the amount of data currently being published is reduced, the information available for all home nations show that Covid levels continued to fall and Covid activity is relatively low. However Flu activity is rising in all home nations indicating an early start to the Winter Flu season.
Covid activity in Europe is falling in most countries and remains stable in others. In the USA, activity levels remain at low levels.
As always, if you have any comments on this Covid Situation Report or suggestions for topics to cover, please post a message below.
Thanks for reading Seeing The Forest for the Trees! Subscribe for free to receive new posts and support my work.
Appendix 1. Test positivity rates and prevalence
Positivity rates are derived from the results of hospital laboratory tests conducted on patients exhibiting symptoms of respiratory diseases. Test positivity is the percentage of patients who test positive for Covid of the total number of patients tested. Since the individuals tested for this measure are not a representative sample of the general population it differs from prevalence, which is derived from a representative sample of the population.
Test positivity rates, while not directly estimating the number of Covid infections in the general population, can be a valuable indicator of the infection trend. The panel chart below compares the weekly test positivity rate among hospital patients with respiratory symptoms to the prevalence of Covid in the general population, as reported in the Winter Infection Survey.
The chart shows that the weekly test positivity rates for patients with symptoms of respiratory infections follows the same pattern as the prevalence for Covid reported by the Winter Infection Survey. Since the Winter Infection Survey is based on a representative sample of the general population this supports using test positivity as a useful proxy for infection trends. However it is not possible to use test positivity to estimate prevalence.
This report belongs to a weekly series summarising the Covid situation across the UK's home nations and other countries.
Thanks for reading Seeing The Forest for the Trees! Subscribe for free to receive new posts and support my work.
This week's report covers the latest weekly test positivity rates for England, along with the most recent data for Scotland, Wales, and Northern Ireland. The report also presents the data on Covid levels in selected countries in Europe and North America. Finally, there is an update on the progress of the Autumn 2025 Covid Booster campaign.
The Covid Situation report depends on the availability of reliable data, which has become harder to access over time. If you are a UK citizen, you might consider supporting a petition urging the UKHSA to monitor COVID infections in specific settings. You can find the petition at the following link.
Summary.
The main Covid indicators in England, Scotland, Wales, and Northern Ireland have continued to decline or remain stable and are now at relatively low levels.
Flu activity is increasing across all home nations, signalling an early start to this years winter Flu season. If you haven't had your Flu vaccination yet, now is a great time to get it.
In England, the Covid test positivity rate again fell this week and is has moved to just within the baseline activity level. All of the main hospital indicators also fell this week indicating a reducing level of risk. Flu positivity rates and hospital admissions are rising fast and are now higher than for Covid.
In Scotland, the hospital indicators of Covid activity all fell this week and remain at low levels of activity. However, Covid test positivity rates and wastewater levels remained unchanged. Flu positivity rates continued to rise and equal those for Covid.
In the past week, Covid hospital admissions in Wales fell but and are still at moderate levels of activity. Flu admissions are rising albeit from low levels.
In Northern Ireland, Covid activity has decreased across most surveillance indicators in the past week indicating a lowering of risk. However, Flu activity levels are rising.
Covid levels detected in wastewater samples for most European countries that still publish this data are falling.
Although no CDC data was published this week due to the government shutdown, alternative sources show that Covid levels in the USA continued to fall and remain at low levels of activity.
The NHS Autumn Covid booster campaign started on October 1, 2025 with the aim of completing most vaccinations by the end of November 2025. England is making good progress with 53% of those aged 75 years and older vaccinated to date.
Free vaccinations in the Autumn 2025 booster campaign will be available for adults aged 75 and older by January 31, 2026; residents in care homes for older adults; and immunosuppressed individuals aged 6 months and above.
People registered with a GP surgery in England can check their eligibility and book a vaccination appointment through this link.
Details of booking a free NHS Covid vaccination in Scotland can be found here, for Wales here, and in Northern Ireland here.
As always, it's important to remember that the risk of hospitalisation from Covid increases significantly with age and for the clinically vulnerable. Therefore, it is important to take appropriate measures such as self-isolating when experiencing Covid symptoms and enhancing ventilation or wearing masks whenever possible.
Status of main respiratory diseases in England.
This section begins with the latest data on positivity rates for Covid in England. It's important to note that positivity is different from prevalence, which reflects the overall percentage of Covid cases in the general population. Appendix 1 offers a detailed explanation of the distinction and highlights why positivity rates are a valuable indicator of trends in Covid infection levels.
The following chart shows the test positivity rate for all Covid tests taken mapped against the UKHSA activity thresholds. The thresholds are based on the historical trend for Covid test positivity and, consequently, represent a relative risk. More details on this approach can be found in the Guide to Covid Surveillance Metrics.
The chart indicates that the test positivity rate again fell this week and is now just within the baseline level of activity, indicating a falling risk. Positivity rates decreased across all regions, showing only small differences between them. Test positivity rates remained highest among individuals aged 85 and older at 10.0%, marking a decrease from the previous week when the rate was 12.4% for this age group.
The next chart highlights four key indicators of Covid in hospitals: weekly Emergency Department visits for Covid-like symptoms, test positivity rates among patients with respiratory issues, hospital admission rates, and admission rates for intensive care.
Key hospital indicators for Covid activity declined again this week, indicating that the recent wave is over, although the hospital admission rate for Covid remains moderately high.
The next chart in this section shows the test positivity rate for hospital patients for the main respiratory illnesses. It is notable that Flu positivity continued to increase significantly and is now much higher than for Covid. This indicates an unusually early start of the Flu season with higher levels seen in children and young adults.
The final chart presents the hospital admissions rate per 100,000 for the three main respiratory viruses and confirms that Flu now presents a greater risk than Covid.
With the Flu season underway, it's a good idea to check your eligibility and book a free vaccination through the following link.
Scotland weekly hospital admissions and test positivity
Public Health Scotland (PHS) continue to publish weekly data on Covid hospital admissions and test positivity as well as wastewater monitoring data. The dashboard for Scotland's data can be accessed here.
The following panel chart presents the most recent data for weekly Covid test positivity shown in red, Covid levels in wastewater in blue, Covid hospital admissions depicted in orange, and beds occupied by Covid patients in brown.
The main indicators of Covid activity in Scotland presented a mixed picture this week. Covid test positivity and levels in wastewater stopped falling and remained broadly unchanged at relatively low levels. However, hospital admissions and occupied beds again fell this week indicating a decrease in Covid activity levels. The trend in recent months showing indicators rising slowly has now stopped and has peaked.
The final chart in this section shows the test positivity rates for patients with respiratory symptoms for Covid, Flu, and RSV.
While Covid levels have stayed steady, Flu positivity rates are climbing and now match those of Covid, marking the start of Flu season. This is backed up by the increase in weekly hospital admissions for Flu, which reached 110 this week, surpassing the 87 admissions for Covid.
With the Flu season starting in Scotland, now is the time to check if you're eligible for a free Flu vaccination here. If you haven't been contacted yet, you can book your vaccination using the following link.
Wales Covid hospital admissions.
During the winter season, Public Health Wales publishes a weekly respiratory infection report, which is available here. The following chart provides the latest trend for weekly hospital admissions for the main respiratory viruses in Wales up to week ending Nov 2, 2025.
Covid hospital admissions have continued to fall this week after a recent increase, though they remain at moderate levels. Surveillance evidence shows that Flu and RSV are beginning to spread in the community, with activity still low but steadily increasing.
Free Flu vaccinations are available for individuals aged 65 and older, certain young children, pregnant women, and those with specific medical conditions. With the Flu season approaching, it's a good idea to check your eligibility and book a vaccination through the provided link.
Status of main respiratory diseases in Northern Ireland.
Public Health Northern Ireland publish a weekly surveillance report on influenza, respiratory syncytial virus (RSV), and Covid providing an overview of these infections within Northern Ireland.
Covid activity continues to fall across most surveillance indicators and is at relatively low levels. Meanwhile, Flu activity is on the rise across various surveillance indicators, especially among children, and this increase is happening earlier than in previous influenza seasons.
The first chart in this section shows the test positivity rates in Northern Ireland for the main respiratory illnesses — Flu, RSV, and Covid and Rhinovirus. Shading represents 95% confidence intervals.
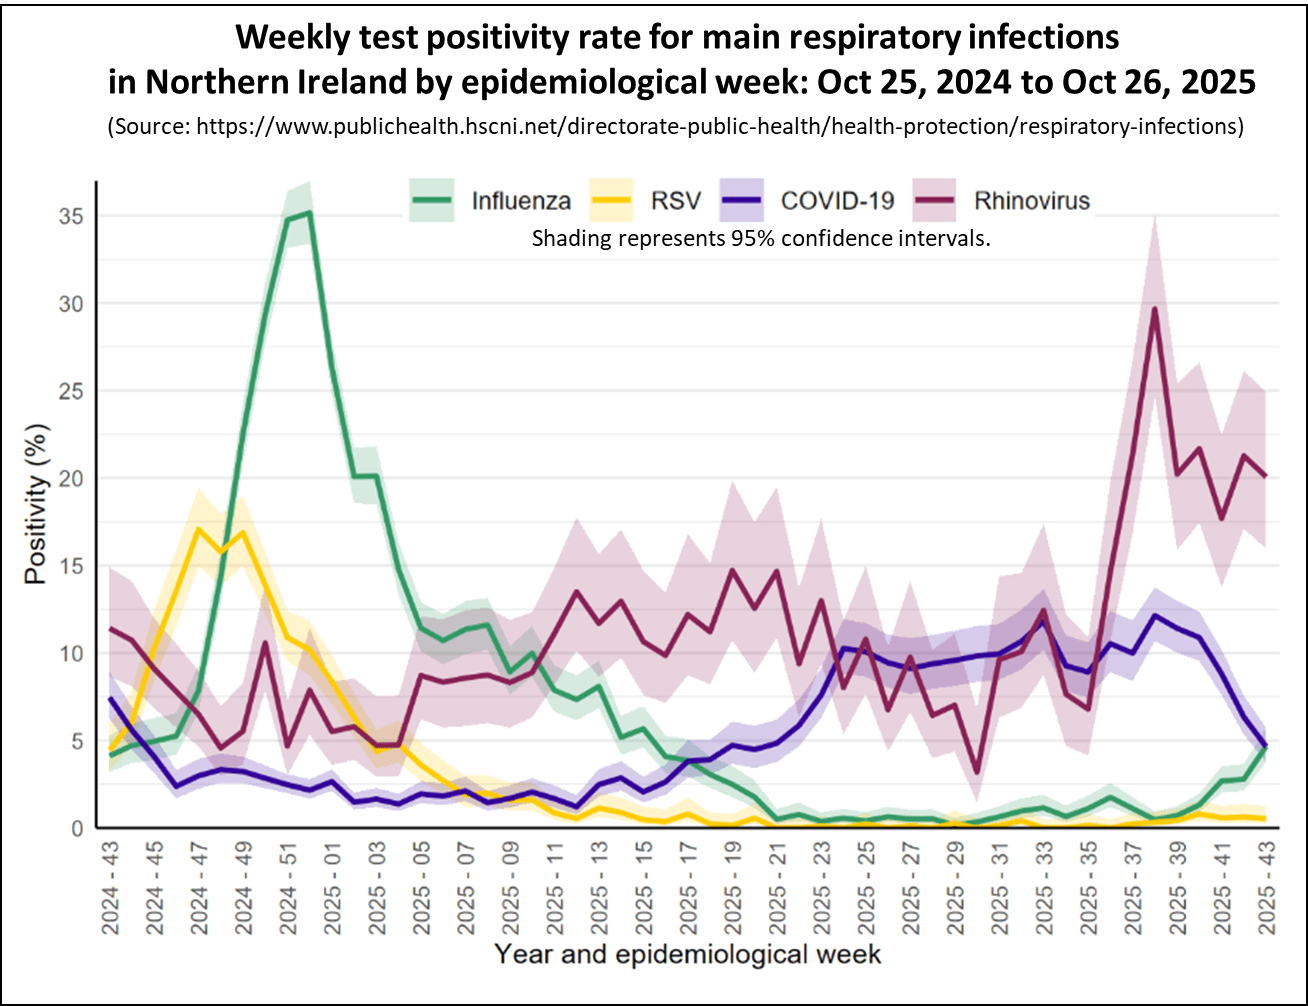
The chart shows that the Covid test positivity rate, represented in blue, has again decreased this week, suggesting a decline in Covid activity. However, flu test positivity, shown in green, has begun to rise, indicating an early start to the flu season.
Information about who qualifies for free flu vaccinations and how to schedule an appointment can be found at the provided link.
Flu vaccinations in Northern Ireland
Covid Levels in Europe and North America.
This section looks at the latest data on Covid activity in Europe and North America. While Covid levels have increased in several countries across these regions, they generally remain lower than those observed during earlier waves.
The following chart shows the latest levels of Covid as measured by monitoring wastewater in a number of European countries that still publish this information.
Over the past week, Covid activity fell in most European countries that still publish Covid levels found in wastewater. Covid levels in Germany and Austria have fallen confirming the trend seen last week. Meanwhile, wastewater levels in France and Sweden continued to fall, while levels in Denmark remained stable. Levels in the Netherlands fell slightly, maintaining the slow upward trend observed over the past month.
Once again, the CDC has been unable to update the U.S. Covid dashboard data due to the government shutdown. However, data on Covid levels in wastewater is available from sources beyond the CDC, and the following chart comes from the WastewaterSCAN Dashboard. Last week, WastewaterSCAN lowered the national risk level from moderate to low, and it remains low this week.
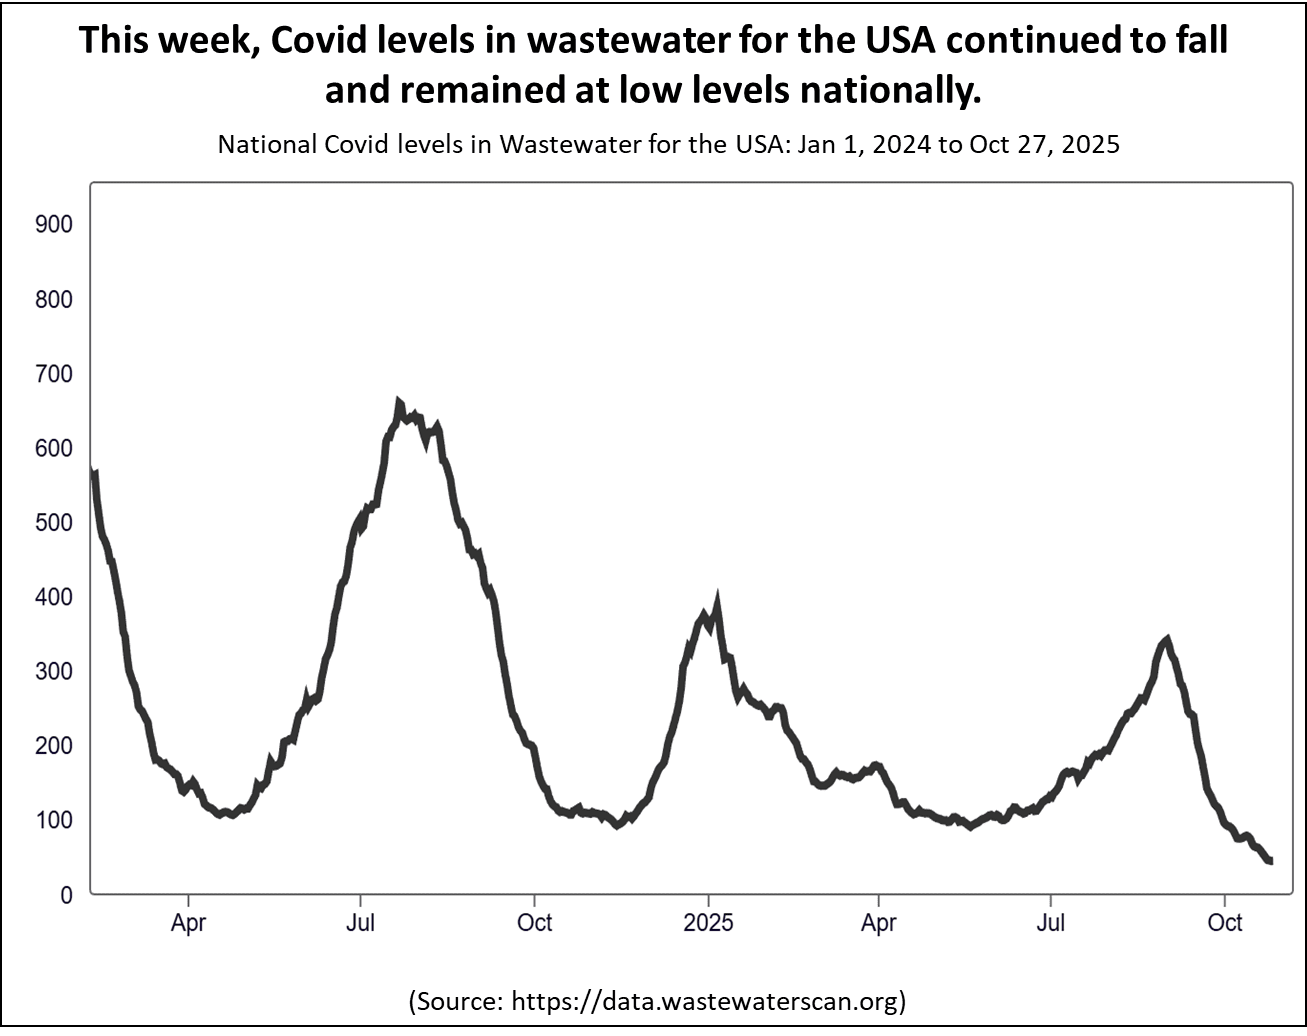
The following map shows that there are regional differences with southern and western regions having lower levels of Covid activity compared to the north-eastern regions. However, it's worth noting that this data source does not cover all States.
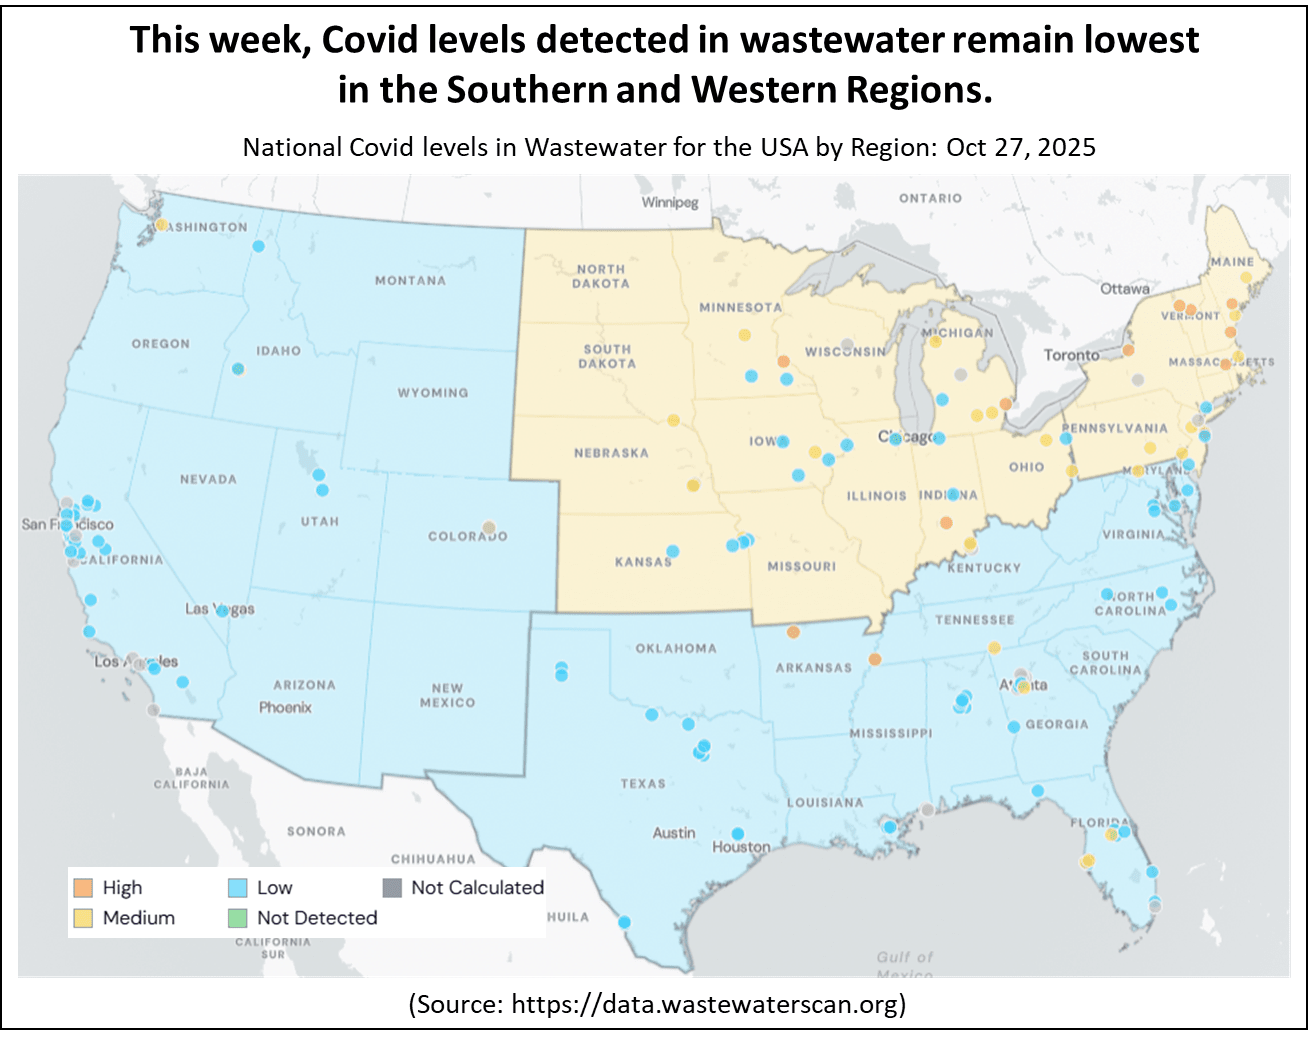
Alternative sources are also stepping in to bridge the gap by compiling the available data as best they can. In particular, interested readers should follow the Force of Infection and Dr Ruth's Newsletter substacks for more information. Notably, both substacks emphasize the increasing levels of Flu and RSV activity, although still at low levels.
The latest data from Canada reveals that Covid wastewater levels are holding steady at moderate levels. Meanwhile, flu levels are beginning to rise, though still low, suggesting a slightly earlier start to the winter flu season.
Autumn 2025 Covid Booster campaign.
The NHS Autumn Covid booster campaign started on October 1, 2025. This year's Autumn vaccination campaign is set to end earlier in England than in previous years, with the majority of vaccinations scheduled to be completed by the end of November. However, outreach efforts to administer vaccines in underserved communities will continue after this date.
The following chart shows the number of Covid vaccinations given by week for each of the booster campaigns in England.
In the week ending November 2, there were 318,855 booster doses were administered, down from 514,760 the previous week, bringing the total to 3.86 million doses in the campaign's first five weeks. This progress is much faster than previous campaigns, despite targeting a smaller eligible population. For instance, by the fifth week of the Spring 2025 campaign, only 3.07 million doses had been administered.
The last chart in this section provides the latest Covid vaccination coverage by Home Nation for the two main eligible groups. The chart indicates that while England is making solid progress, Scotland and Wales are progressing more slowly.
In conclusion
Although the amount of data currently being published is reduced, the information available for all home nations show that Covid levels continued to fall and Covid activity is relatively low. However Flu activity is rising in all home nations indicating an early start to the Winter Flu season.
Covid activity in Europe is falling in many countries and remains stable in others. In the USA, activity levels remain at low levels.
As always, if you have any comments on this Covid Situation Report or suggestions for topics to cover, please post a message below.
Thanks for reading Seeing The Forest for the Trees! Subscribe for free to receive new posts and support my work.
Appendix 1. Test positivity rates and prevalence
Positivity rates are derived from the results of hospital laboratory tests conducted on patients exhibiting symptoms of respiratory diseases. Test positivity is the percentage of patients who test positive for Covid of the total number of patients tested. Since the individuals tested for this measure are not a representative sample of the general population it differs from prevalence, which is derived from a representative sample of the population.
Test positivity rates, while not directly estimating the number of Covid infections in the general population, can be a valuable indicator of the infection trend. The panel chart below compares the weekly test positivity rate among hospital patients with respiratory symptoms to the prevalence of Covid in the general population, as reported in the Winter Infection Survey.
The chart shows that the weekly test positivity rates for patients with symptoms of respiratory infections follows the same pattern as the prevalence for Covid reported by the Winter Infection Survey. Since the Winter Infection Survey is based on a representative sample of the general population this supports using test positivity as a useful proxy for infection trends. However it is not possible to use test positivity to estimate prevalence.
This report belongs to a weekly series summarising the Covid situation across the UK's home nations and other countries.
Thanks for reading Seeing The Forest for the Trees! Subscribe for free to receive new posts and support my work.
This week's report covers the latest weekly test positivity rates for England, along with the most recent data for Scotland, Wales, and Northern Ireland. The report also presents the latest data on Covid levels in selected European countries and North America (USA and Canada). Finally, there's a brief update on the progress of the Autumn 2025 Covid Booster campaign.
The Covid Situation report depends on the availability of reliable data, which has become harder to access over time. If you are a UK citizen, you might consider supporting a petition urging the UKHSA to monitor COVID infections in specific settings. You can find the petition at the following link.
Summary.
This week, Covid indicators in England, Scotland, Wales, and Northern Ireland have continued to decline and are now at relatively low levels. However, this year's flu season has begun earlier than usual across all Home Nations.
In England, the Covid test positivity rate again fell this week and is at the low activity level. All of the main hospital indicators also fell this week indicating a reducing level of risk. Activity is highest in the East Midlands and Yorkshire & Humberside. Flu positivity rates are rising fast and are now higher than for Covid.
In Scotland, the key indicators of Covid activity all fell this week and remain at low levels of activity. Flu positivity rates are rising but remain low.
In the past week, Covid hospital admissions in Wales fell but and are still at moderate levels of activity. Flu admissions are rising albeit from low levels.
In Northern Ireland, Covid activity has decreased across most surveillance indicators in the past week indicating a lowering of risk.
This week, Covid levels in wastewater presented a mixed picture across Europe. German and Austrian levels look like they are plateauing. In France, Denmark, and Sweden levels continue to fall, while in the Netherlands they have risen slightly, maintaining the recent slow upward trend.
Although no CDC data was published this week due to the government shutdown, alternative sources show that Covid levels in the USA continue to fall and are now at low levels of activity.
The NHS Autumn Covid booster campaign started on October 1, 2025 with the aim of completing most vaccinations by the end of November 2025. England is making good progress with 48% of those aged 75 years and older vaccinated to date.
Those eligible for free vaccinations in the Autumn 2025 booster campaign for all home nations are:
adults aged 75 years and over as at January 31, 2026;
residents in care homes for older adults; and
individuals who are immunosuppressed aged 6 months and over.
People registered with a GP surgery in England can now book their vaccination appointment and select a date and time starting from 1 October through this link.
Details of booking a free NHS Covid vaccination in Scotland can be found here, for Wales here, and in Northern Ireland here.
As always, it's important to remember that the risk of hospitalisation from Covid increases significantly with age and for the clinically vulnerable. Therefore, it is important to take appropriate measures such as self-isolating when experiencing Covid symptoms and enhancing ventilation or wearing masks whenever possible.
Status of main respiratory diseases in England.
This section begins with the latest data on positivity rates for Covid in England. It's important to note that positivity is different from prevalence, which reflects the overall percentage of Covid cases in the general population. Appendix 1 offers a detailed explanation of the distinction and highlights why positivity rates are a valuable indicator of trends in Covid infection levels.
The following chart shows the test positivity rate for all Covid tests taken mapped against the UKHSA activity thresholds. The thresholds are based on the historical trend for Covid test positivity and, consequently, represent a relative risk. More details on this approach can be found in the Guide to Covid Surveillance Metrics.
The chart indicates that the test positivity rate again fell this week and is now well within the low level of activity, indicating a falling risk. Positivity rates were highest among individuals aged 85 and older at 13.4%, marking a decrease from the previous week when the rate was 15.5% for this age group.
The next chart presents the test positivity rate by region with the two highest activity thresholds shown.
Hospital test positivity rates for Covid fell in all regions so that all of them now fall within the low activity threshold. However, they were still highest in the South West, East Midlands, and Yorkshire and Humberside, suggesting that these areas face a greater level of risk.
The next chart highlights four key indicators of Covid in hospitals: weekly Emergency Department visits for Covid-like symptoms, test positivity rates among patients with respiratory issues, hospital admission rates, and admission rates for intensive care.
Key hospital indicators for Covid activity declined again this week, suggesting the recent wave has ended, although the hospital admission rate for Covid remains moderately high.
The final chart in this section shows the test positivity rate for hospital patients for the main respiratory illnesses. It is notable that Flu positivity is increasing significantly and is now higher than for Covid.
This indicates an unusually early start of the Flu season with higher levels seen in children and young adults.
Scotland weekly hospital admissions and test positivity
Public Health Scotland (PHS) continue to publish weekly data on Covid hospital admissions and test positivity as well as wastewater monitoring data. The dashboard for Scotland's data can be accessed here.
The following panel chart presents the most recent data for weekly Covid test positivity shown in red, Covid levels in wastewater in blue, Covid hospital admissions depicted in orange, and beds occupied by Covid patients in brown.
Covid test positivity, levels in wastewater, hospital admissions, and occupied beds again fell this week indicating a decrease in Covid activity levels. The trend in recent months showing indicators rising slowly has now stopped and has peaked.
The final chart in this section shows the test positivity rates for patients with respiratory symptoms for Covid, Flu, and RSV. While Covid levels are decreasing, Flu positivity rates are rising, signalling the beginning of the Flu season.
Wales Covid hospital admissions.
The following chart provides the latest trend for weekly hospital admissions for the main respiratory viruses in Wales up to week ending Oct 26, 2025.
Hospital admissions for Covid have decreased this week after a recent rise, but they remain at moderate activity levels. Flu indicators suggest it is now spreading within the community in Wales, with activity levels currently low but on the rise.
Status of main respiratory diseases in Northern Ireland.
Public Health Northern Ireland publish a weekly surveillance report on influenza, respiratory syncytial virus (RSV), and Covid providing an overview of these infections within Northern Ireland.
Flu activity showed a slight increase whereas RSV activity has remained low and stable over the previous two weeks, circulating at baseline levels. Covid activity has decreased across most surveillance indicators and is at relatively low levels.
The first chart in this section shows the test positivity rates in Northern Ireland for the main respiratory illnesses — Flu, RSV, and Covid and Rhinovirus. Shading represents 95% confidence intervals.
The chart shows that the Covid test positivity rate, represented in blue, has again decreased this week, suggesting a decline in Covid activity. However, flu test positivity, shown in green, has begun to rise, indicating an early start to the flu season.
Covid Levels in Europe and North America.
This section looks at the latest data on Covid activity in Europe and North America. While Covid levels have increased in several countries across these regions, they generally remain lower than those observed during earlier waves.
The following chart shows the latest levels of Covid as measured by monitoring wastewater in a number of European countries that still publish this information.
Over the past week, Covid activity for European countries that still publish Covid levels found in wastewater presented a mixed picture. The rate of increase in Covid levels in Germany and Austria is slowing, suggesting that activity may have peaked in these countries. Meanwhile, wastewater levels in France, Denmark, and Sweden continue to decline, while levels in the Netherlands have risen slightly, maintaining the slow upward trend observed over the past month.
Once again, the CDC has been unable to update the U.S. Covid dashboard data due to the government shutdown. However, some raw data is still being updated, and the following chart gives the national Covid test positivity rate up to Oct 25, 2025. The chart shows that the positivity rate has fallen rapidly and the recent wave is over.
Data on Covid levels in wastewater data is also available from sources beyond the CDC, and the following chart comes from the WastewaterSCAN Dashboard. This week, WastewaterSCAN lowered the national risk level from moderate to low, aligning with the results from the test positivity data.
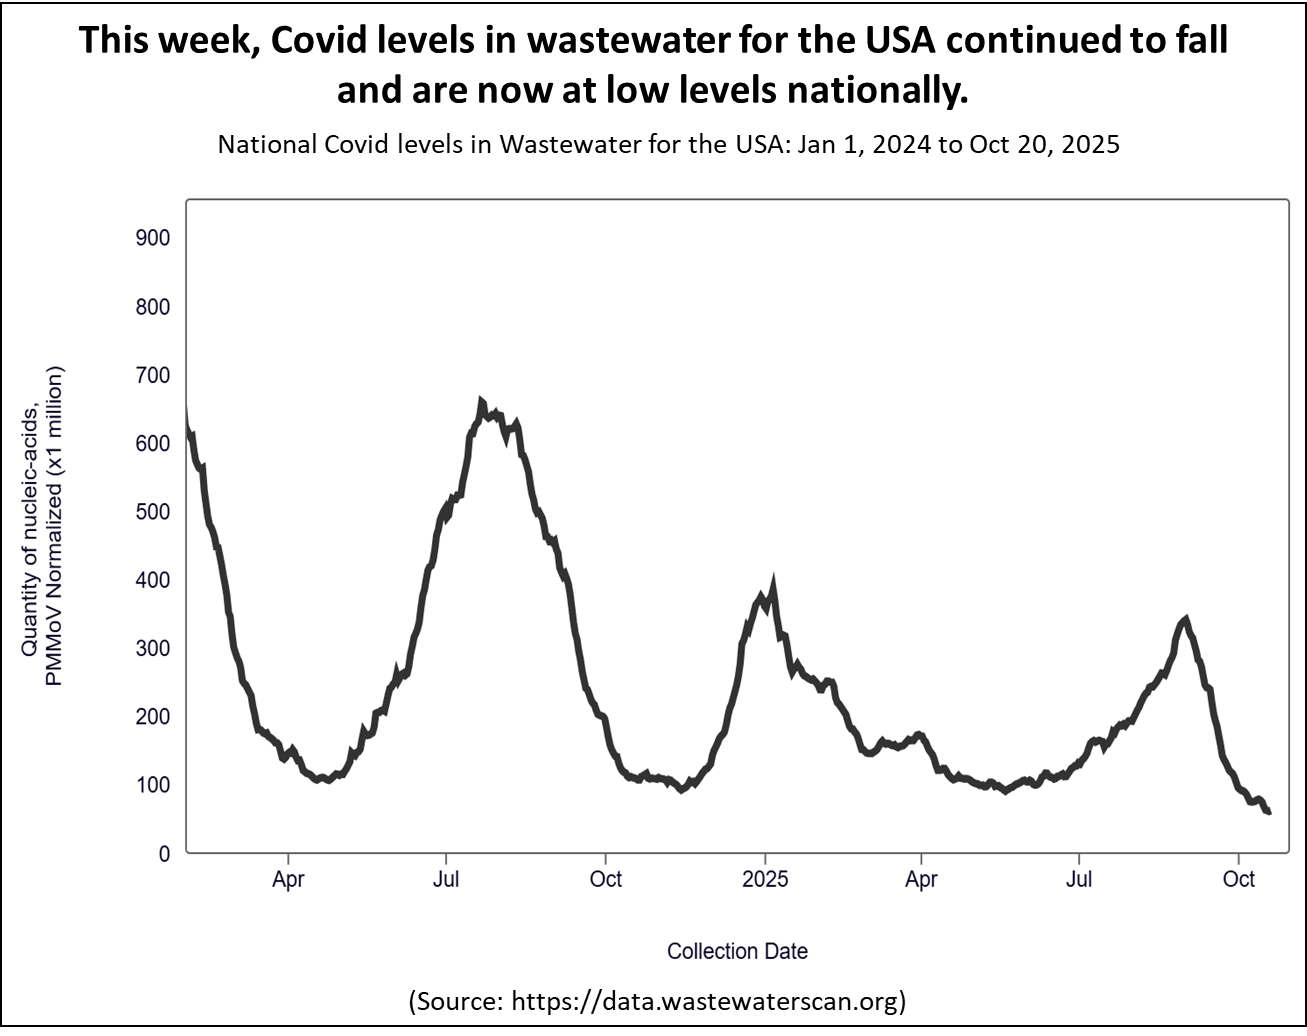
The following map shows that there are regional differences with southern and western regions having lower levels of Covid activity compared to the north-eastern regions. However, it's worth noting that this data source does not cover all States.
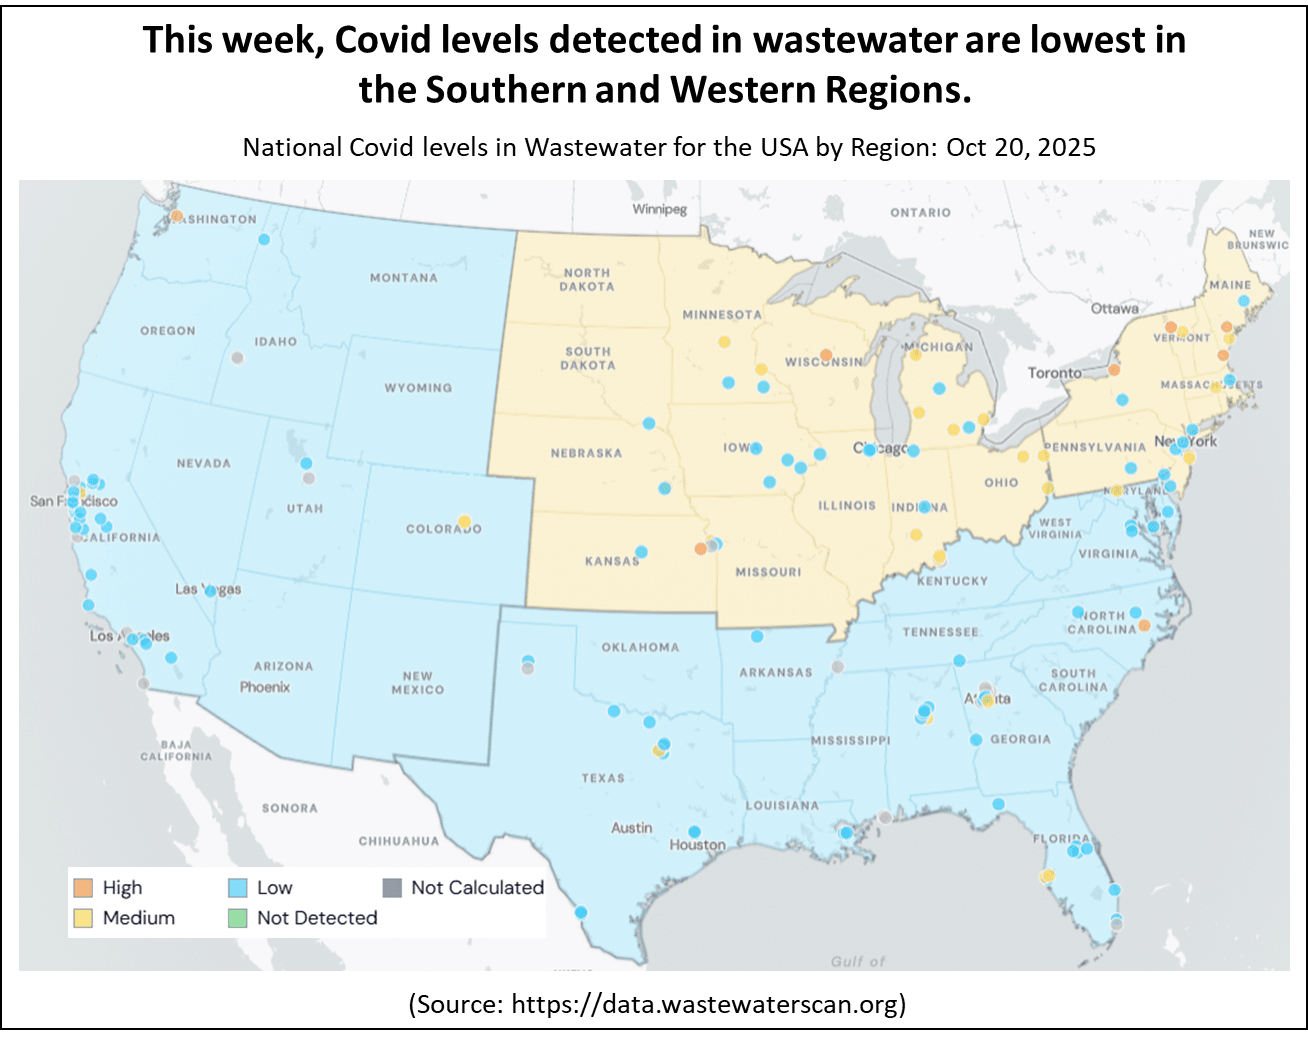
Alternative sources are also stepping in to bridge the gap by compiling the available data as best they can. In particular, interested readers should follow the Force of Infection and Dr Ruth's Newsletter substacks for more detailed information.
Finally, the latest available data from Canada showed that Covid wastewater levels are falling and are at a relatively low level.
Autumn 2025 Covid Booster campaign.
The NHS Autumn Covid booster campaign started on October 1, 2025. This year's Autumn vaccination campaign is set to end earlier in England than in previous years, with the majority of vaccinations scheduled to be completed by the end of November. However, outreach efforts to administer vaccines in underserved communities will continue after this date.
The following chart shows the number of Covid vaccinations given by week for each of the booster campaigns in England.
In the week ending October 26, 502,488 booster doses were administered, down from 783,367 the previous week, bringing the total to 3.52 million doses in the campaign's first four weeks. This progress is much faster than previous campaigns, despite targeting a smaller eligible population. For instance, by the fourth week of the Spring 2025 campaign, only 2.74 million doses had been administered.
The last chart in this section provide the latest Covid vaccination coverage by Home Nation for the two main eligible groups. The chart indicates that while England is making solid progress, Scotland and Wales are progressing more slowly.
In conclusion
Although the amount of data currently being published is reduced, the information available for all home nations show that Covid levels continued to fall and Covid activity is relatively low.
Covid activity in Europe is falling in several countries but is still increasing in Germany. In the USA, activity levels have fallen to low levels.
As always, if you have any comments on this Covid Situation Report or suggestions for topics to cover, please post a message below.
Thanks for reading Seeing The Forest for the Trees! Subscribe for free to receive new posts and support my work.
Appendix 1. Test positivity rates and prevalence
Positivity rates are derived from the results of hospital laboratory tests conducted on patients exhibiting symptoms of respiratory diseases. Test positivity is the percentage of patients who test positive for Covid of the total number of patients tested. Since the individuals tested for this measure are not a representative sample of the general population it differs from prevalence, which is derived from a representative sample of the population.
Test positivity rates, while not directly estimating the number of Covid infections in the general population, can be a valuable indicator of the infection trend. The panel chart below compares the weekly test positivity rate among hospital patients with respiratory symptoms to the prevalence of Covid in the general population, as reported in the Winter Infection Survey.
The chart shows that the weekly test positivity rates for patients with symptoms of respiratory infections follows the same pattern as the prevalence for Covid reported by the Winter Infection Survey. Since the Winter Infection Survey is based on a representative sample of the general population this supports using test positivity as a useful proxy for infection trends. However it is not possible to use test positivity to estimate prevalence.
This report belongs to a weekly series summarising the Covid situation across the UK's home nations and other countries.
Thanks for reading Seeing The Forest for the Trees! Subscribe for free to receive new posts and support my work.
This week's report covers the latest weekly test positivity rates for England, along with the most recent data for Scotland, Wales, and Northern Ireland. The report also presents the latest data on Covid levels in selected European countries and North America (USA and Canada). Finally, there's a brief update on the progress of the Autumn 2025 Covid Booster campaign.
The Covid Situation report depends on the availability of reliable data, which has become harder to access over time. If you are a UK citizen, you might consider supporting a petition urging the UKHSA to monitor COVID infections in specific settings. You can find the petition at the following link.
Summary.
This week, Covid indicators in England continued to decline and are now at relatively low levels. Key indicators in Scotland and Northern Ireland also dropped and remain low. However, while indicators in Wales also decreased, Covid activity levels there remain moderate.
In England, the test positivity rate again fell this week and is now at the low activity level. All of the main hospital indicators also fell this week indicating a reducing level of risk. Activity remains highest in the Midlands and Yorkshire & Humberside.
In Scotland, the key indicators of Covid activity all fell this week and remain at low levels of activity. This reverses the slow increase in the level of Covid indicators over the past months.
In the past week, Covid hospital admissions in Wales fell but and are still at moderate levels of activity.
In Northern Ireland, Covid activity has decreased across most surveillance indicators in the past week indicating a lowering of risk.
This week, Covid levels in wastewater for European countries that still report this data show a mixed trend. While levels in France have dropped from their recent peak, those in Germany continue to rise.
Although no CDC data was published this week due to the government shutdown, alternative sources show that Covid levels in the USA continued to fall and are now at low levels of activity.
The NHS Autumn Covid booster campaign started on October 1, 2025 with the aim of completing most vaccinations by the end of November 2025. England is making good progress with 41% of those aged 75 years and older vaccinated to date.
Those eligible for free vaccinations in the Autumn 2025 booster campaign for all home nations are:
adults aged 75 years and over as at January 31, 2026;
residents in care homes for older adults; and
individuals who are immunosuppressed aged 6 months and over.
People registered with a GP surgery in England can now book their vaccination appointment and select a date and time starting from 1 October through this link.
Details of booking a free NHS Covid vaccination in Scotland can be found here, for Wales here, and in Northern Ireland here.
As always, it's important to remember that the risk of hospitalisation from Covid increases significantly with age and for the clinically vulnerable. Therefore, it is important to take appropriate measures such as self-isolating when experiencing Covid symptoms and enhancing ventilation or wearing masks whenever possible.
Status of main respiratory diseases in England.
This section begins with the latest data on positivity rates for Covid in England. It's important to note that positivity is different from prevalence, which reflects the overall percentage of Covid cases in the general population. Appendix 1 offers a detailed explanation of the distinction and highlights why positivity rates are a valuable indicator of trends in Covid infection levels.
The following chart shows the test positivity rate for all Covid tests taken mapped against the UKHSA activity thresholds. The thresholds are based on the historical trend for Covid test positivity and, consequently, represent a relative risk. More details on this approach can be found in the Guide to Covid Surveillance Metrics.
The chart indicates that the test positivity rate again fell this week and is now well within the low level of activity, indicating a falling risk. Positivity rates were highest among individuals aged 85 and older at 15.1%, marking a decrease from the previous week when the rate was 18.8% for this age group.
The next chart presents the test positivity rate by region with the two highest activity thresholds shown.
While hospital test positivity rates fell in most regions, they were still highest in the West Midlands, East Midlands, and Yorkshire and Humberside, suggesting that these areas face a greater level of risk.
It is worth noting that regional differences in demographics will impact the hospital tests positivity rates which are based on testing all patients with symptoms of respiratory viruses. For example, London probably has lower hospital positivity rates for Covid because it has the youngest population of all the regions. Since Covid hospital admissions are much higher among the elderly, regions with a larger elderly population would naturally see higher hospital test positivity rates. On average, the South West and North East regions have the oldest populations.
The last chart in this section highlights four key indicators of Covid in hospitals: weekly Emergency Department visits for Covid-like symptoms, test positivity rates among patients with respiratory issues, hospital admission rates, and admission rates for intensive care.
All of the key hospital indicators for Covid activity continued to fall this week, though the hospital admission rate for Covid stayed moderately high.
Scotland weekly hospital admissions and test positivity
Public Health Scotland (PHS) continue to publish weekly data on Covid hospital admissions and test positivity as well as wastewater monitoring data. The dashboard for Scotland's data can be accessed here.
The following panel chart presents the most recent data for weekly Covid test positivity shown in red, Covid levels in wastewater in blue, Covid hospital admissions depicted in orange, and beds occupied by Covid patients in brown.
Covid test positivity, levels in wastewater, hospital admissions, and occupied beds all fell this week indicating a decrease in Covid activity levels this week. The trend in recent months showing indicators rising slowly has now stopped and appears to have peaked.
Wales Covid hospital admissions.
The following chart provides the latest trend for weekly hospital admissions in Wales up to week ending Oct 19, 2025.
After the recent increase, hospital admissions have continued to fall this week but still remain at moderate activity levels.
Status of main respiratory diseases in Northern Ireland.
Public Health Northern Ireland publish a weekly surveillance report on influenza, respiratory syncytial virus (RSV), and Covid providing an overview of these infections within Northern Ireland.
This week, flu and RSV activity saw a slight increase across surveillance indicators but continued to remain at very low levels. Meanwhile, Covid activity shows a mixed trend across indicators but also stayed relatively low overall.
Flu activity showed a slight increase whereas RSV activity has remained low and stable over the previous two weeks, circulating at baseline levels. Covid activity has decreased across most surveillance indicators and is at relatively low levels.
The first chart in this section shows the test positivity rates in Northern Ireland for the main respiratory illnesses — Flu, RSV, and Covid and Rhinovirus. Shading represents 95% confidence intervals.
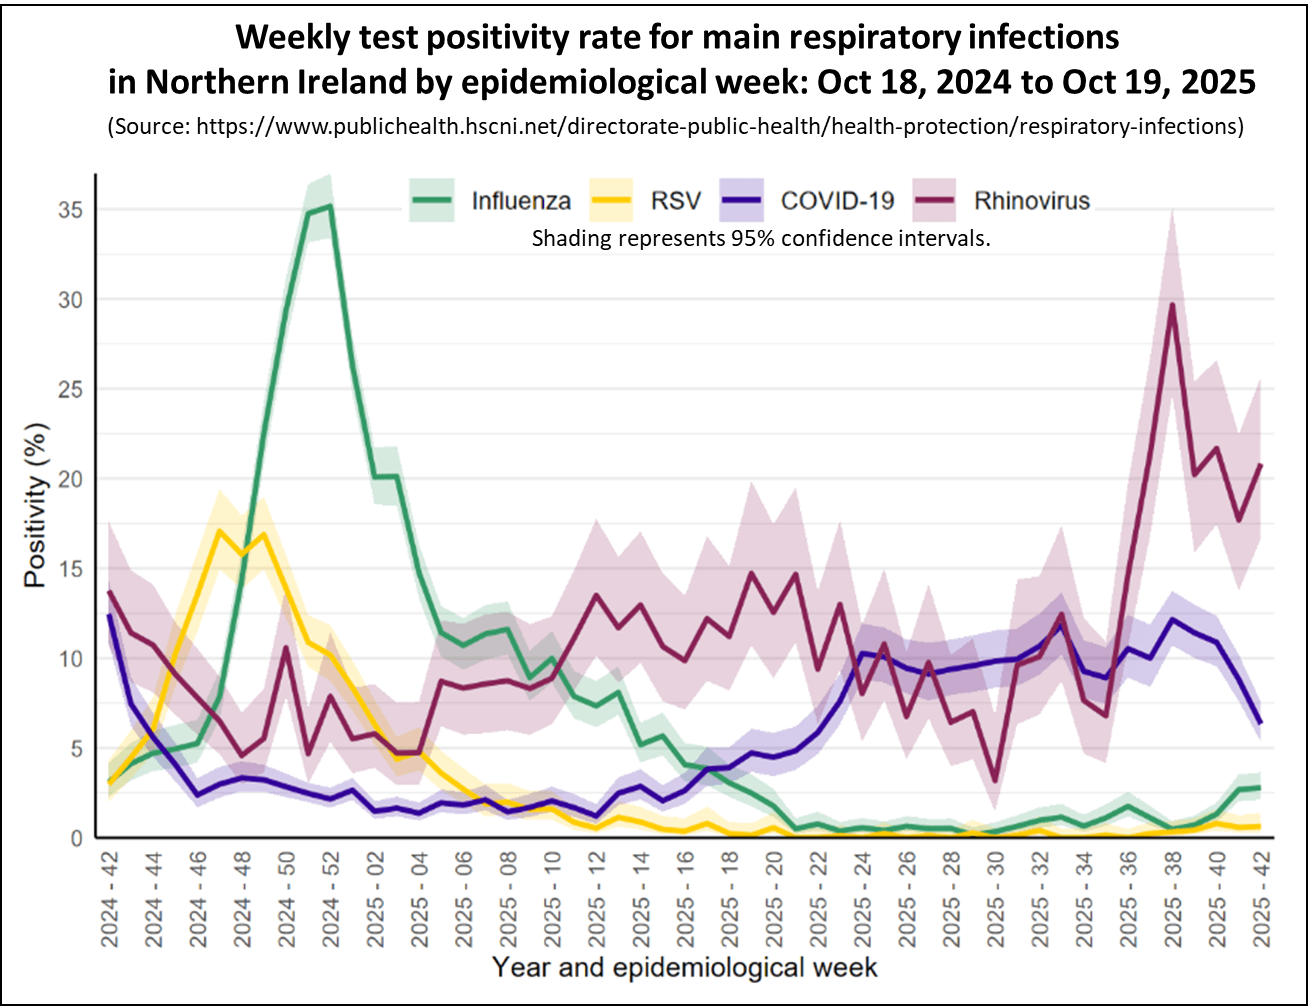
The chart shows that the Covid test positivity rate, depicted in blue, has fallen this week indicating that Covid activity has fallen.
The chart below presents the weekly count of hospital admissions for the main respiratory illnesses where the infection was contracted in the community, thereby excluding patients who contracted Covid while in hospital.
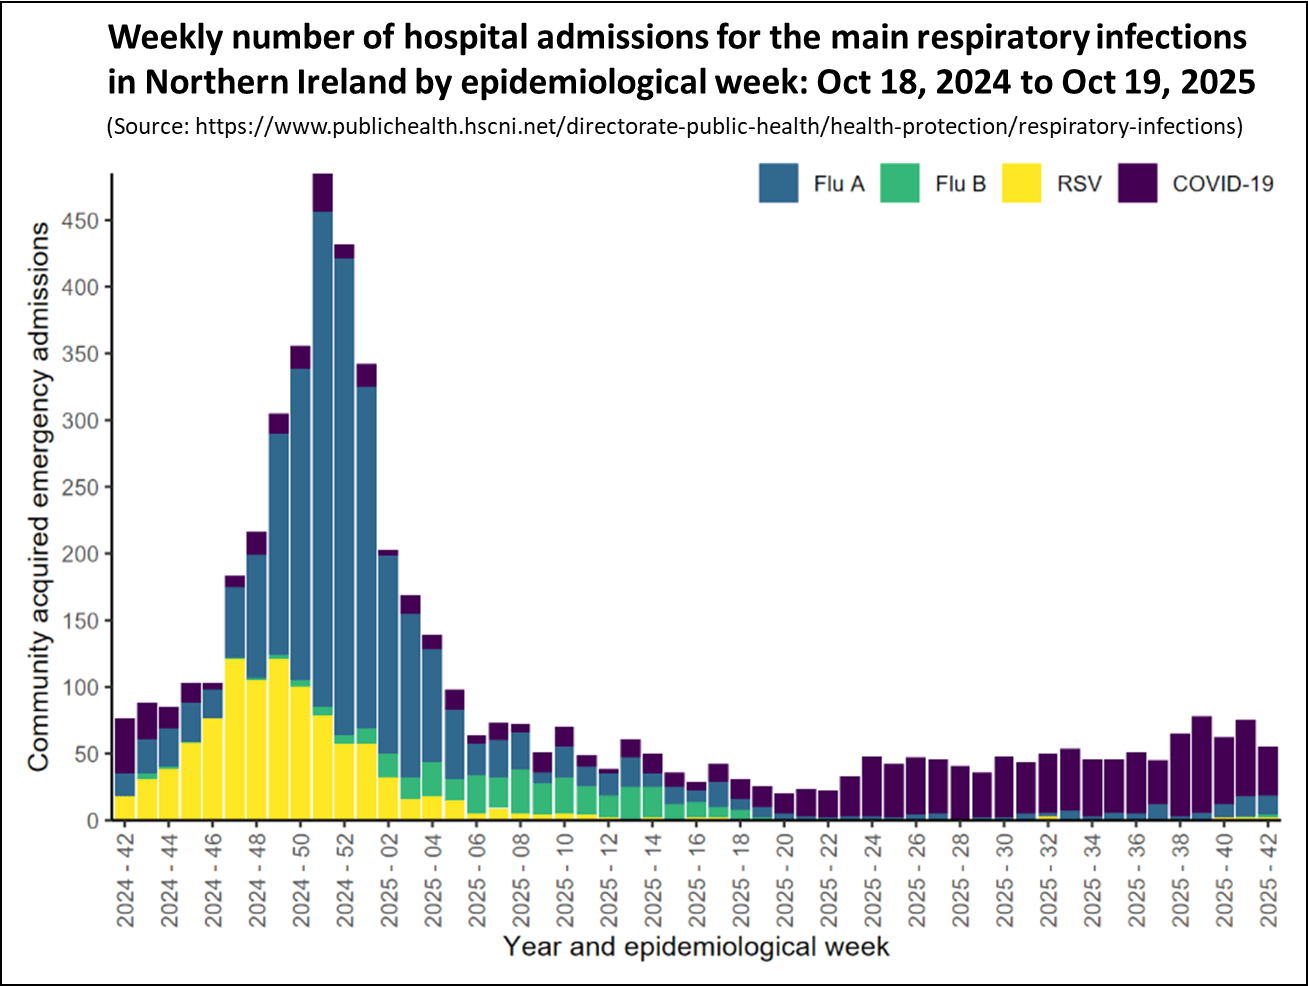
Since November 2024 hospital admissions for Covid have been low; however, their was a small increase in September which has now stabilised and started to fall.
Covid Levels in Europe and North America.
Media reports across Europe and in the USA have highlighted that the new variants, particularly XFG, have been detected in these regions, leading to concerns that there may be a new wave of Covid activity over the summer months.
This section looks at the latest data on Covid activity in Europe and North America. While Covid levels have increased in several countries across these regions, they generally remain lower than those observed during earlier waves.
The following chart shows the latest levels of Covid as measured by monitoring wastewater in a number of European countries that still publish this information.
Over the past week, Covid activity for European countries that still publish Covid levels found in wastewater presented a mixed picture. While activity levels in Germany continue to rise there are signs that Austrian levels have peaked. Wastewater levels in France are falling and those in the other countries remain broadly stable.
For the second consecutive week, the CDC has been unable to release Covid data for the USA due to the government shutdown. However, data on Covid levels in wastewater data are accessible from sources beyond the CDC, and the following chart comes from the WastewaterSCAN Dashboard.
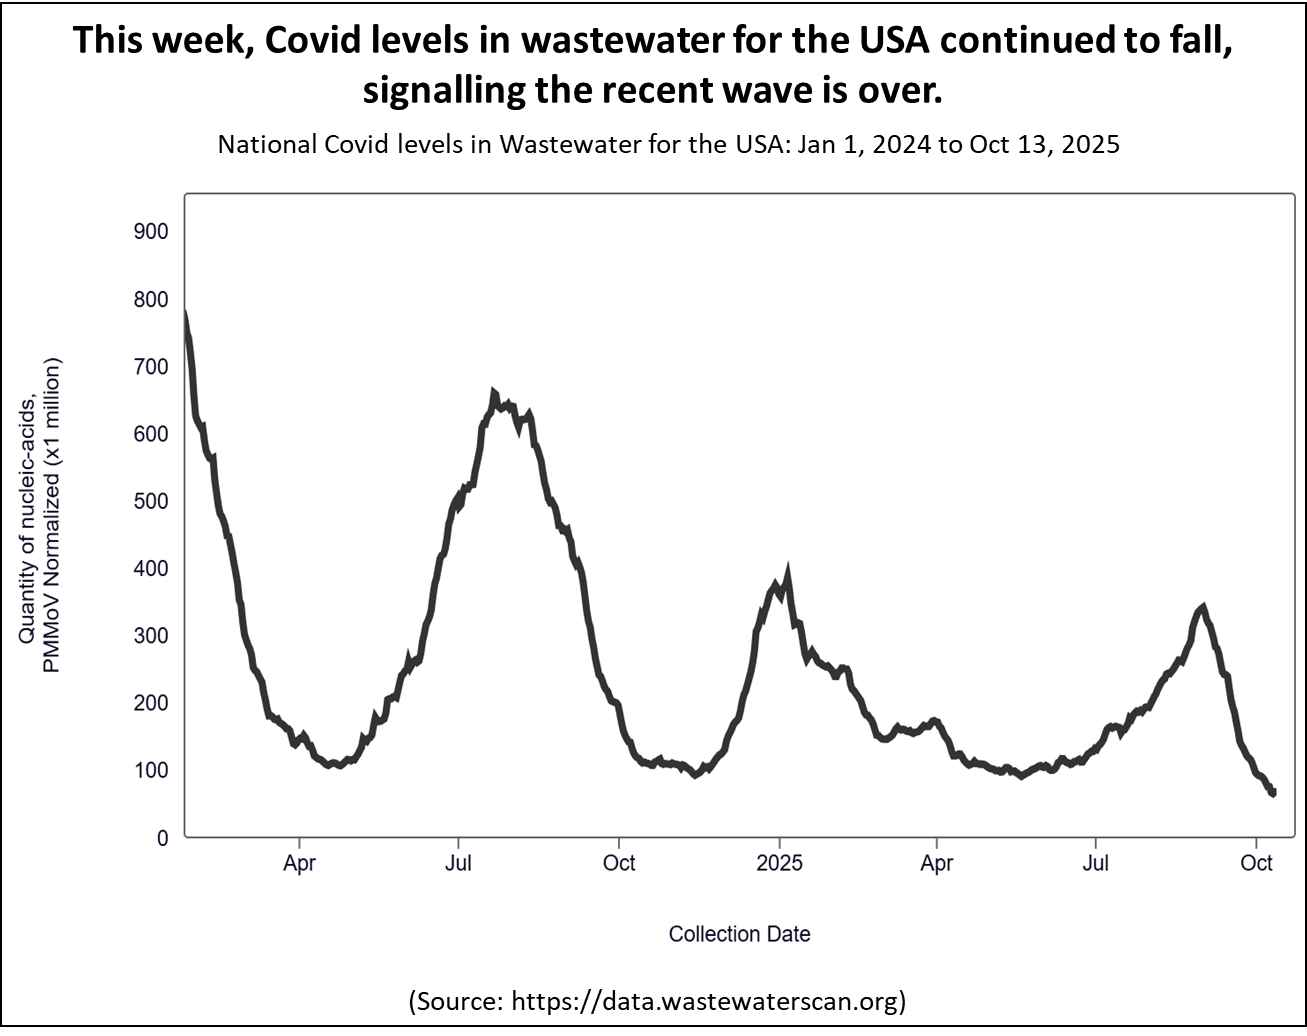
As of October 13, WastewaterSCAN assesses the national risk level as moderate. The following map shows that there are clear regional differences with southern region having lower levels of Covid activity compared to the western and north-eastern regions. However, it's worth noting that this data source does not cover all States.
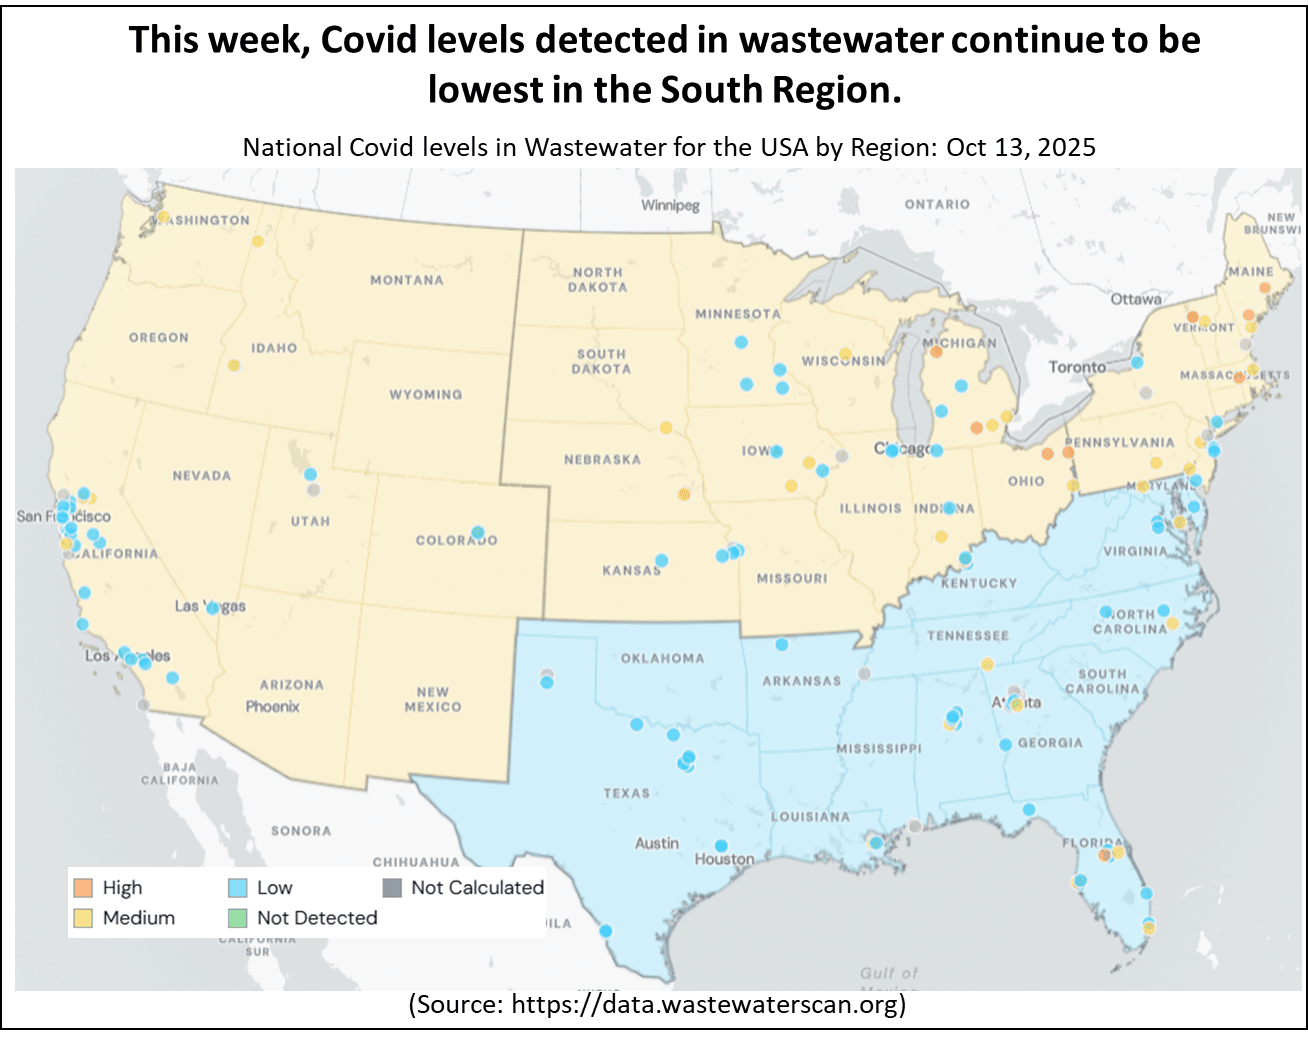
Alternative sources are also stepping in to bridge the gap by compiling the available data as best they can. In particular, interested readers should follow the Force of Infection and Dr Ruth's Newsletter substacks for more detailed information.
There were no updates on Covid wastewater levels in Canada this week, but the weekly wastewater monitoring dashboard indicated that levels are still moderate.
Autumn 2025 Covid Booster campaign.
The NHS Autumn Covid booster campaign started on October 1, 2025. This year's Autumn vaccination campaign is set to end earlier in England than in previous years, with the majority of vaccinations scheduled to be completed by the end of November. However, outreach efforts to administer vaccines in underserved communities will continue after this date.
The following chart shows the number of Covid vaccinations given by week for each of the booster campaigns in England.
In the week ending October 19, the number of booster doses administered was 765,759 compared to the previous week's 1,095,460, giving a total of nearly 3.0 million doses over the campaign's first three weeks. This means that the current progress is significantly faster than any of the previous campaigns although it is for a much smaller eligible population. For comparison, by the third week of the Spring 2025 campaign just 2.3 million doses had been given.
The last chart in this section illustrates the coverage as of the week ending October 19 for the two main eligible groups in England and Scotland. The chart indicates that while England is making solid progress, Scotland still has more work ahead.
In conclusion
Although the amount of data currently being published is reduced, the information available for England and Wales show that Covid levels continued to fall from last weeks peak. Recent data indicates that Covid activity in Scotland and Northern Ireland has also fallen and is low.
Covid activity in Europe is falling in several countries but is still increasing in Germany. In the USA, activity levels have fallen to low levels.
As always, if you have any comments on this Covid Situation Report or suggestions for topics to cover, please post a message below.
Thanks for reading Seeing The Forest for the Trees! Subscribe for free to receive new posts and support my work.
Appendix 1. Test positivity rates and prevalence
Positivity rates are derived from the results of hospital laboratory tests conducted on patients exhibiting symptoms of respiratory diseases. Test positivity is the percentage of patients who test positive for Covid of the total number of patients tested. Since the individuals tested for this measure are not a representative sample of the general population it differs from prevalence, which is derived from a representative sample of the population.
Test positivity rates, while not directly estimating the number of Covid infections in the general population, can be a valuable indicator of the infection trend. The panel chart below compares the weekly test positivity rate among hospital patients with respiratory symptoms to the prevalence of Covid in the general population, as reported in the Winter Infection Survey.
The chart shows that the weekly test positivity rates for patients with symptoms of respiratory infections follows the same pattern as the prevalence for Covid reported by the Winter Infection Survey. Since the Winter Infection Survey is based on a representative sample of the general population this supports using test positivity as a useful proxy for infection trends. However it is not possible to use test positivity to estimate prevalence.
This report belongs to a weekly series summarising the Covid situation across the UK's home nations and other countries.
Thanks for reading Seeing The Forest for the Trees! Subscribe for free to receive new posts and support my work.
This week's report covers the latest weekly test positivity rates for England, along with the most recent data for Scotland, Wales, and Northern Ireland. The report also presents the latest data on Covid levels in selected European countries and North America (USA and Canada).
The Covid Situation report depends on the availability of reliable data, which has become harder to access over time. If you are a UK citizen, you might consider supporting a petition urging the UKHSA to monitor COVID infections in specific settings. You can find the petition at the following link.
Summary.
This week, Covid indicators in England fell slightly but remained at a moderate level of activity. Indicators for Wales signalled a fall in Covid activity but levels remain moderately high. In contrast, indicators in Scotland and Northern Ireland were broadly unchanged remaining relatively low.
In England, the test positivity rate fell slightly this week and is now just below the moderate activity level. The main hospital indicators also fell slightly this week after least weeks significant rise in hospital admissions. Activity remains highest in the Midlands and Yorkshire & Humberside.
In Scotland, the key indicators of Covid activity fell slightly this week. However, the past month has seen a slow increase in the level of Covid indicators, though they remain relatively low.
This week, Covid hospital admissions in Wales fell but and are still at moderately high levels.
In Northern Ireland, Covid activity has remained stable and low across key surveillance indicators over the previous five weeks.
Last week, Covid levels in wastewater continued to increase across most European countries that still publish this data, reaching fairly high levels in some countries.
Although no data was published by the CDC this week due to the government shutdown, alternative sources show that Covid levels in the USA continued to fall from the recent peak. For US readers, the Forces of Infection substack has continued with their state-level updates on the current status of respiratory and other viruses.
The NHS Autumn Covid booster campaign started on October 1, 2025 with the aim of completing most vaccinations by the end of November 2025. Those eligible for free vaccinations in the Autumn 2025 booster campaign for all home nations are:
adults aged 75 years and over as at January 31, 2026;
residents in care homes for older adults; and
individuals who are immunosuppressed aged 6 months and over.
People registered with a GP surgery in England can now book their vaccination appointment and select a date and time starting from 1 October through this link.
Details of booking a free NHS Covid vaccination in Scotland can be found here, for Wales here, and in Northern Ireland here.
As always, it's important to remember that the risk of hospitalisation from Covid increases significantly with age and for the clinically vulnerable. Therefore, it is important to take appropriate measures such as self-isolating when experiencing Covid symptoms and enhancing ventilation or wearing masks whenever possible.
Status of main respiratory diseases in England.
The UKHSA National flu and COVID-19 surveillance report has now returned to the Winter reporting period which provides more detail on respiratory viruses on a weekly basis.
This section begins with the latest data on positivity rates for Covid in England. It's important to note that positivity is different from prevalence, which reflects the overall percentage of Covid cases in the general population. Appendix 1 offers a detailed explanation of the distinction and highlights why positivity rates are a valuable indicator of trends in Covid infection levels.
The following chart shows the test positivity rate for all Covid tests taken mapped against the UKHSA activity thresholds. The thresholds are based on the historical trend for Covid test positivity and, consequently, represent a relative risk. More details on this approach can be found in the Guide to Covid Surveillance Metrics.
The chart indicates that the test positivity rate fell slightly this week and is just below the medium level of activity, indicating a falling risk. Positivity rates were highest among those aged 85 and older at 18.8%, staying steady compared to the previous week, when the rate was 19.4% for the same age group.
The next chart presents the test positivity rate by region with the two highest activity thresholds shown.
While hospital test positivity rates fell in most regions, they were still highest in the West Midlands, East Midlands, and Yorkshire and Humberside, suggesting that these areas face the greater level of risk.
It is worth noting that regional differences in demographics will impact the hospital tests positivity rates which are based on testing all patients with symptoms of respiratory viruses.
For example, London probably has lower hospital positivity rates for Covid because it has the youngest population of all the regions. Since Covid hospital admissions are much higher among the elderly, regions with a larger elderly population would naturally see higher hospital test positivity rates. On average, the South West and North East regions have the oldest populations.
London has the lowest percentage of clinically vulnerable people, which could also play a role. In contrast, the North East, North West, and Yorkshire regions have the highest percentages of clinically vulnerable individuals.
The last chart in this section highlights four key indicators of Covid in hospitals: weekly Emergency Department visits for Covid-like symptoms, test positivity rates among patients with respiratory issues, hospital admission rates, and admission rates for intensive care.
All of the key hospital indicators for Covid activity saw a slight fall this week, though the hospital admission rate for Covid stayed relatively high.
Hospital admission rates remained the highest in the West Midlands region, though they dropped to 6.03 per 100,000 from 7.03 the previous week. For those aged 85 and over, the rate stayed steady at 48.56 per 100,000 compared to 47.29 the week before.
Scotland weekly hospital admissions and test positivity
Public Health Scotland (PHS) continue to publish weekly data on Covid hospital admissions and test positivity as well as wastewater monitoring data. The dashboard for Scotland's data can be accessed here.
The following panel chart presents the most recent data for weekly Covid test positivity shown in red, Covid levels in wastewater in blue, Covid hospital admissions depicted in orange, and beds occupied by Covid patients in brown.
Covid levels in wastewater, hospital admissions, and occupied beds saw a slight decline this week. While Covid test positivity data isn't available for the latest week, it has stayed fairly steady over the past three weeks. However, the trend in recent months shows indicators rising slowly but staying at relatively low levels.
Wales Covid hospital admissions.
The following chart provides the latest trend for weekly hospital admissions in Wales up to week ending Oct 12, 2025.
After last week's sharp increase, hospital admissions have dropped this week but still remain at moderately high levels, indicating heightened Covid activity.
Status of main respiratory diseases in Northern Ireland.
Public Health Northern Ireland publish a weekly surveillance report on influenza, respiratory syncytial virus (RSV), and Covid providing an overview of these infections within Northern Ireland.
This week, flu and RSV activity saw a slight increase across surveillance indicators but continued to remain at very low levels. Meanwhile, Covid activity shows a mixed trend across indicators but also stayed relatively low overall.
Flu and RSV activity remained low and stable over the previous two weeks, circulating at baseline levels. Covid indicators showed a mixed picture, although activity remains steady and at relatively low levels.
The first chart in this section shows the test positivity rates in Northern Ireland for the main respiratory illnesses — Flu, RSV, and Covid and Rhinovirus. Shading represents 95% confidence intervals.
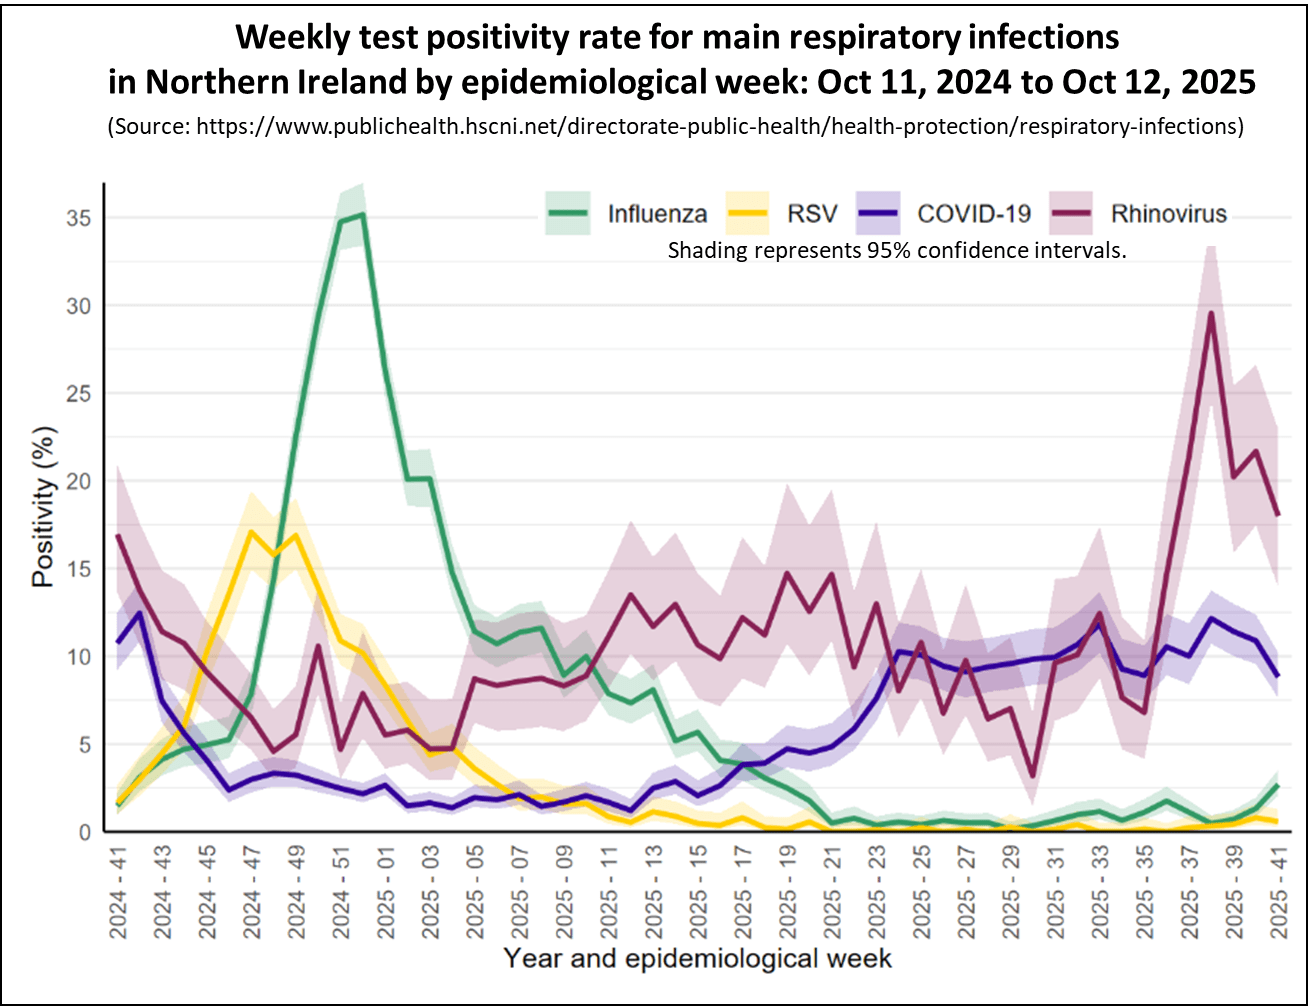
The chart shows that the Covid test positivity rate, depicted in blue, has stabilised over the past six weeks indicating that the increase in Covid activity has stopped.
The chart below presents the weekly count of hospital admissions for the main respiratory illnesses where the infection was contracted in the community, thereby excluding patients who contracted Covid while in hospital.
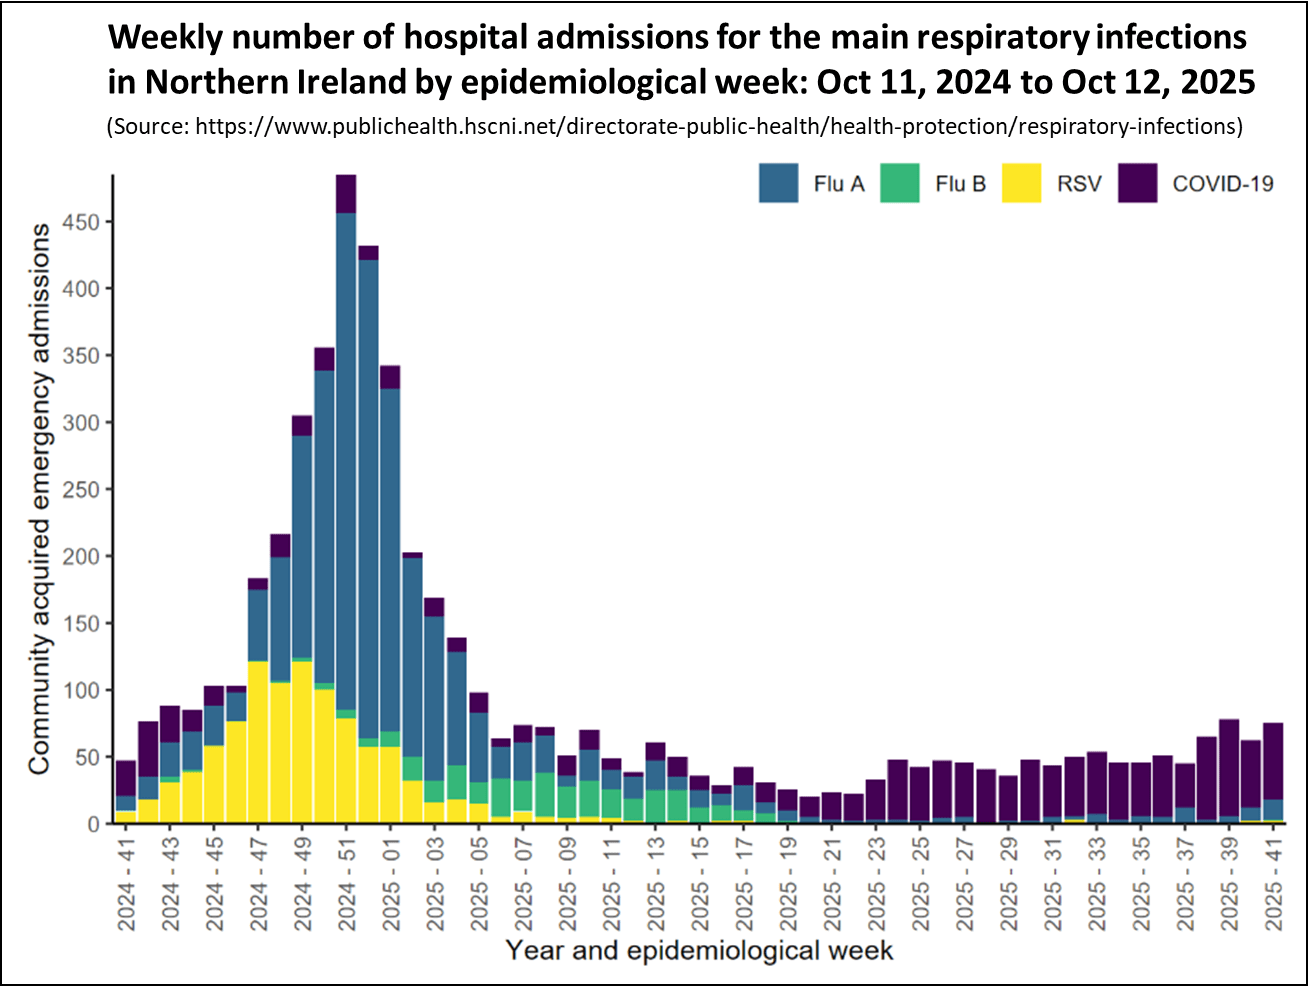
The chart shows that for most of 2024, the bulk of hospital admissions for respiratory infections stemmed from Covid, indicated in purple. Since November 2024 hospital admissions for Covid have been low; however, their was a small increase in September which has now stabilised.
Covid Levels in Europe and North America.
Media reports across Europe and in the USA have highlighted that the new variants, particularly XFG, have been detected in these regions, leading to concerns that there may be a new wave of Covid activity over the summer months.
This section looks at the latest data on Covid activity in Europe and North America. While Covid levels have increased in several countries across these regions, they generally remain lower than those observed during earlier waves.
The following chart shows the latest levels of Covid as measured by monitoring wastewater in a number of European countries that still publish this information.
Over the past week, Covid activity has risen in most of the European countries that still publish Covid levels found in wastewater. While some nations remain at relatively low levels, several have reached moderately high levels.
For the second consecutive week, the CDC has been unable to release Covid data for the USA due to the government shutdown. However, data on Covid levels in wastewater data are accessible from sources beyond the CDC, and the following chart comes from the WastewaterSCAN Dashboard.
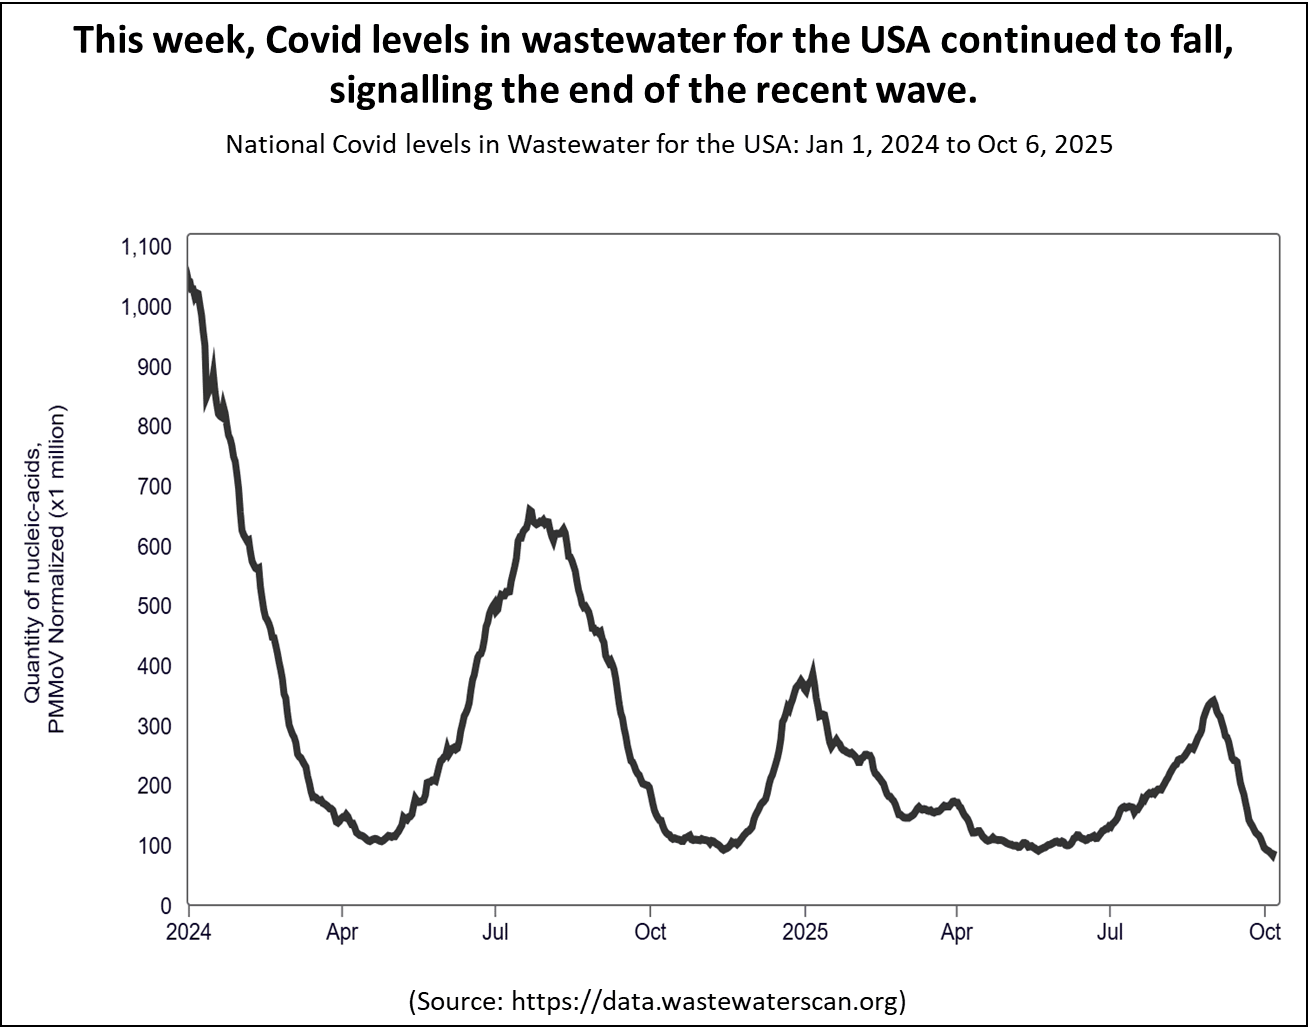
As of October 6, WastewaterSCAN assesses the national risk level as moderate. The following map shows that there are clear regional differences with southern region having lower levels of Covid activity compared to the western and north-eastern regions. However, it's worth noting that this data source does not cover all States.
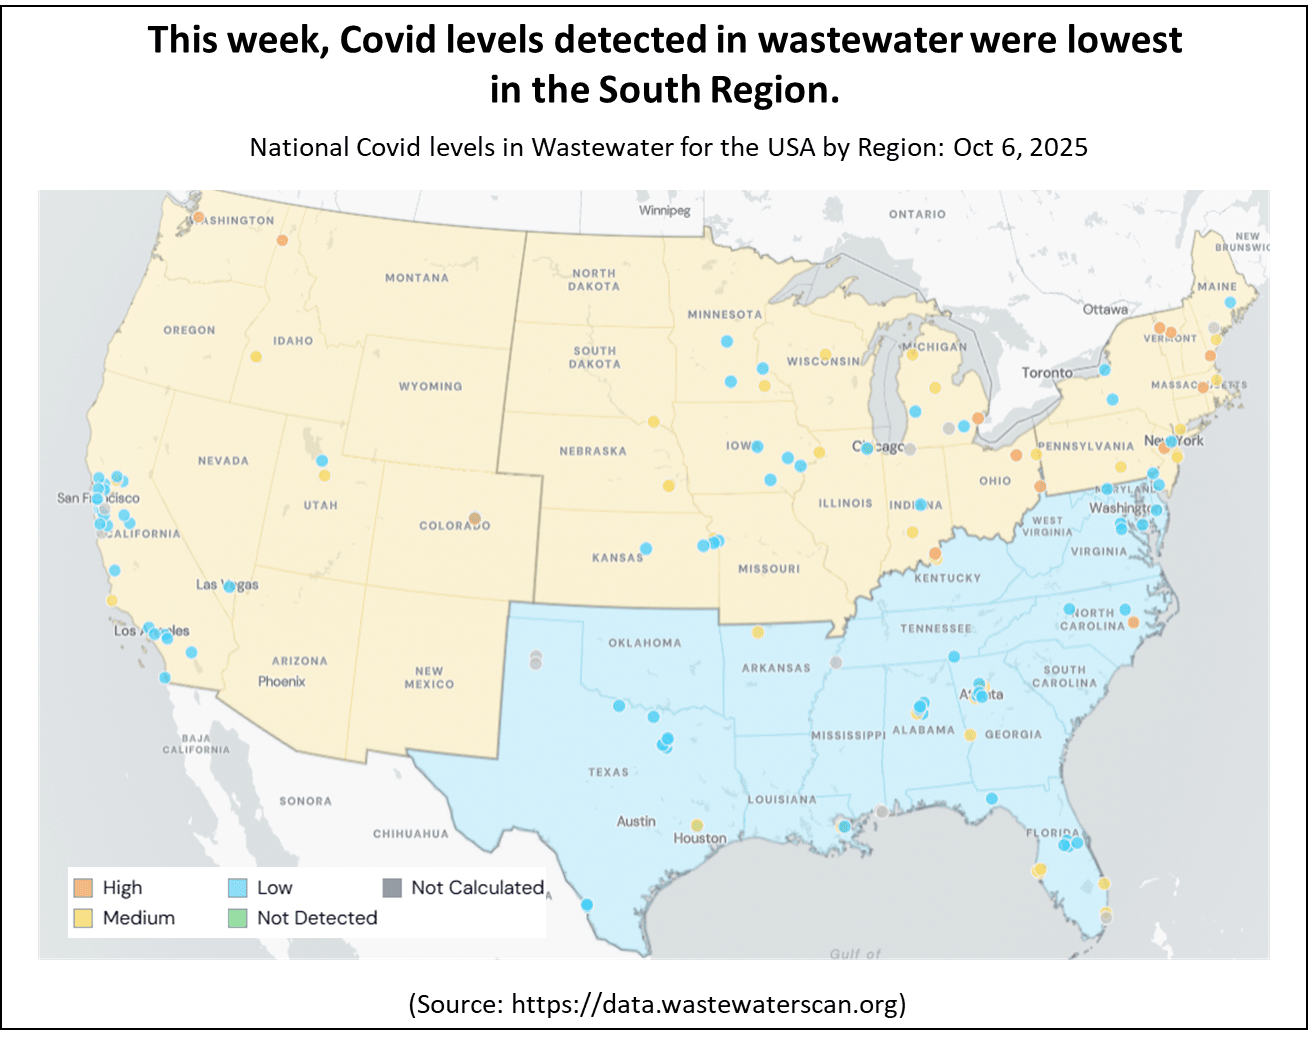
Alternative sources are also stepping in to bridge the gap by compiling the available data as best they can. In particular, interested readers should follow the Force of Infection and Dr Ruth's Newsletter substacks for more detailed information.
The final chart in this section shows that Covid activity in Canada, as measured by the latest wastewater levels, rose slightly this week but remains at a moderate level.
In conclusion
Although the amount of data currently being published has fallen, the information available for England and Wales show that Covid levels fell slightly from last weeks peak. Recent data indicates that Covid activity in Scotland has increased slowly over the past months but remains relatively low. Activity levels in Northern Ireland also remain low.
Covid activity in Europe is rising in several countries and is high in some. In the USA, activity levels have peaked and are now falling fast.
As always, if you have any comments on this Covid Situation Report or suggestions for topics to cover, please post a message below.
Thanks for reading Seeing The Forest for the Trees! Subscribe for free to receive new posts and support my work.
Appendix 1. Test positivity rates and prevalence
Positivity rates are derived from the results of hospital laboratory tests conducted on patients exhibiting symptoms of respiratory diseases. Test positivity is the percentage of patients who test positive for Covid of the total number of patients tested. Since the individuals tested for this measure are not a representative sample of the general population it differs from prevalence, which is derived from a representative sample of the population.
Test positivity rates, while not directly estimating the number of Covid infections in the general population, can be a valuable indicator of the infection trend. The panel chart below compares the weekly test positivity rate among hospital patients with respiratory symptoms to the prevalence of Covid in the general population, as reported in the Winter Infection Survey.
The chart shows that the weekly test positivity rates for patients with symptoms of respiratory infections follows the same pattern as the prevalence for Covid reported by the Winter Infection Survey. Since the Winter Infection Survey is based on a representative sample of the general population this supports using test positivity as a useful proxy for infection trends. However it is not possible to use test positivity to estimate prevalence.
This report belongs to a weekly series summarising the Covid situation across the UK's home nations and other countries.
Thanks for reading Seeing The Forest for the Trees! Subscribe for free to receive new posts and support my work.
This week's report covers the latest weekly test positivity rates for England, along with the most recent data for Scotland, Wales, and Northern Ireland. The report also presents the latest data on Covid levels in selected European countries and North America (USA and Canada).
The Covid Situation report depends on the availability of reliable data, which has become harder to access over time. If you are a UK citizen, you might consider supporting a petition urging the UKHSA to monitor COVID infections in specific settings. You can find the petition at the following link.
Summary.
This week, Covid indicators in England increased and are showing a moderately high level of activity. Wales also saw a significant increase in Covid activity. In contrast, indicators in Scotland and Northern Ireland were broadly unchanged remaining relatively low.
In England, the test positivity rate increased again this week and is now above the moderate activity level, indicating a growing risk. The main hospital indicators also increased this week with hospital admissions rising significantly. Activity is highest in the Midlands and Yorkshire & Humberside.
In Scotland, the key indicators of Covid activity remained broadly stable this week. However, the past month has seen a slow increase in the level of Covid indicators, though they remain relatively low.
This week, Covid hospital admissions in Wales continued to increase significantly and are now at moderately high levels.
In Northern Ireland, Covid activity was stable and low across key surveillance indicators over the previous four weeks.
Recently, the WHO declared NB.1.8.1 and XFG as variants under monitoring due to reported increases in cases and hospitalisations in countries which have the highest prevalence of these variants. These remain the two most common variants globally.
Last week, Covid levels in wastewater again increased across most European countries that still publish this data, reaching fairly high levels in some countries.
Although no data was published by the CDC this week due to the government shutdown, alternative sources show that Covid levels in the USA continue to fall from the recent peak. For US readers, the Forces of Infection Substack has compiled state-level updates on the current status of respiratory and other viruses.
The NHS Autumn Covid booster campaign started on October 1, 2025 with the aim of completing most vaccinations by the end of November 2025. Those eligible for free vaccinations in the Autumn 2025 booster campaign for all home nations are:
adults aged 75 years and over;
residents in care homes for older adults; and
individuals who are immunosuppressed aged 6 months and over.
People registered with a GP surgery in England can now book their vaccination appointment and select a date and time starting from 1 October through this link.
As always, it's important to remember that the risk of hospitalisation from Covid increases significantly with age and for the clinically vulnerable. Therefore, it is important to take appropriate measures such as self-isolating when experiencing Covid symptoms and enhancing ventilation or wearing masks whenever possible.
Status of main respiratory diseases in England.
The UKHSA National flu and COVID-19 surveillance report has now returned to the Winter reporting period which provides more detail on respiratory viruses on a weekly basis.
This section begins with the latest data on positivity rates for Covid in England. It's important to note that positivity is different from prevalence, which reflects the overall percentage of Covid cases in the general population. Appendix 1 offers a detailed explanation of the distinction and highlights why positivity rates are a valuable indicator of trends in Covid infection levels.
The following chart shows the test positivity rate for all Covid tests taken mapped against the UKHSA activity thresholds. The thresholds are based on the historical trend for Covid test positivity and, consequently, represent a relative risk. More details on this approach can be found in the Guide to Covid Surveillance Metrics.
The chart indicates that the test positivity rate continued to increase this week and is within the medium level of activity, indicating a growing risk. Rates were highest among those aged 85 and over, with a weekly average of 18.8%. This marks an increase from the previous week, when the rate was 16.6% for the same age group.
The next chart presents the test positivity rate by region with the two highest activity thresholds shown.
Test positivity rates are high in the West Midlands, East Midlands, and Yorkshire and Humberside, indicating that these areas are at the highest level of risk.
The last chart in this section highlights four key indicators of Covid in hospitals: weekly Emergency Department visits for Covid-like symptoms, test positivity rates among patients with respiratory issues, hospital admission rates, and admission rates for intensive care.
All of the main hospital indicators for Covid activity increased this week with the hospital admission rate for Covid rising significantly. Unfortunately, the positive rate was not published for the latest week.
Hospital admission rates were highest in the West Midlands region (increasing to 7.27 per 100,000 compared with 4.81 in the previous week) and for those aged 85 years and over (increasing to 48.56 per 100,000 compared with 34.71 in the previous week).
Scotland weekly hospital admissions and test positivity
Public Health Scotland (PHS) continue to publish weekly data on Covid hospital admissions and test positivity as well as wastewater monitoring data. The dashboard for Scotland's data can be accessed here.
The following panel chart presents the most recent data for weekly Covid test positivity shown in red, Covid levels in wastewater in blue, Covid hospital admissions depicted in orange, and beds occupied by Covid patients in brown.
Hospital admissions and occupied beds increased slightly this week whilst wastewater levels remained unchanged. Covid test positivity was not updated this week. However, the overall trend for the past months is that the indicators are rising slowly whilst remain at relatively moderately low levels.
Wales Covid hospital admissions.
The following chart provides the latest trend for weekly hospital admissions in Wales up to week ending Oct 5, 2025.
Hospital admissions have again risen sharply this week and are now at moderately high levels, reflecting an increased level of Covid activity.
Status of main respiratory diseases in Northern Ireland.
Public Health Northern Ireland publish a weekly surveillance report on influenza, respiratory syncytial virus (RSV), and Covid providing an overview of these infections within Northern Ireland.
This week, flu and RSV activity saw a slight increase across surveillance indicators but continued to remain at very low levels. Meanwhile, Covid activity shows a mixed trend across indicators but also stayed relatively low overall.
Flu and RSV activity remained low and stable over the previous two weeks, circulating at baseline levels. Covid indicators showed no significant change, with activity remaining steady and at low levels.
The first chart in this section shows the test positivity rates in Northern Ireland for the main respiratory illnesses — Flu, RSV, and Covid and Rhinovirus. Shading represents 95% confidence intervals.
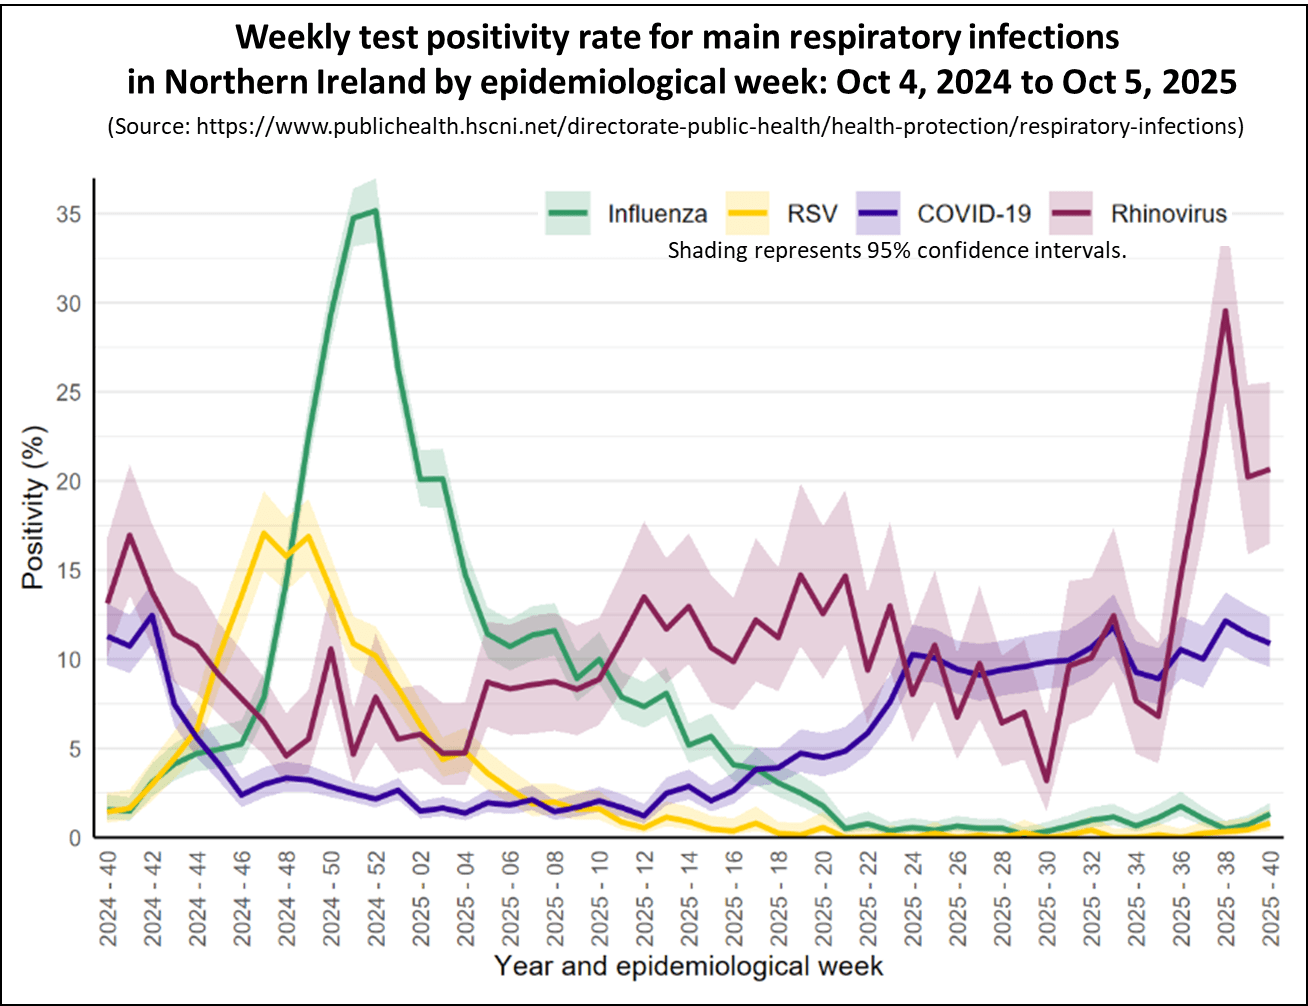
The chart shows that the Covid test positivity rate, depicted in blue, has stabilised over the past six weeks indicating that the increase in Covid activity has stopped.
The chart below presents the weekly count of hospital admissions for the main respiratory illnesses where the infection was contracted in the community, thereby excluding patients who contracted Covid while in hospital.
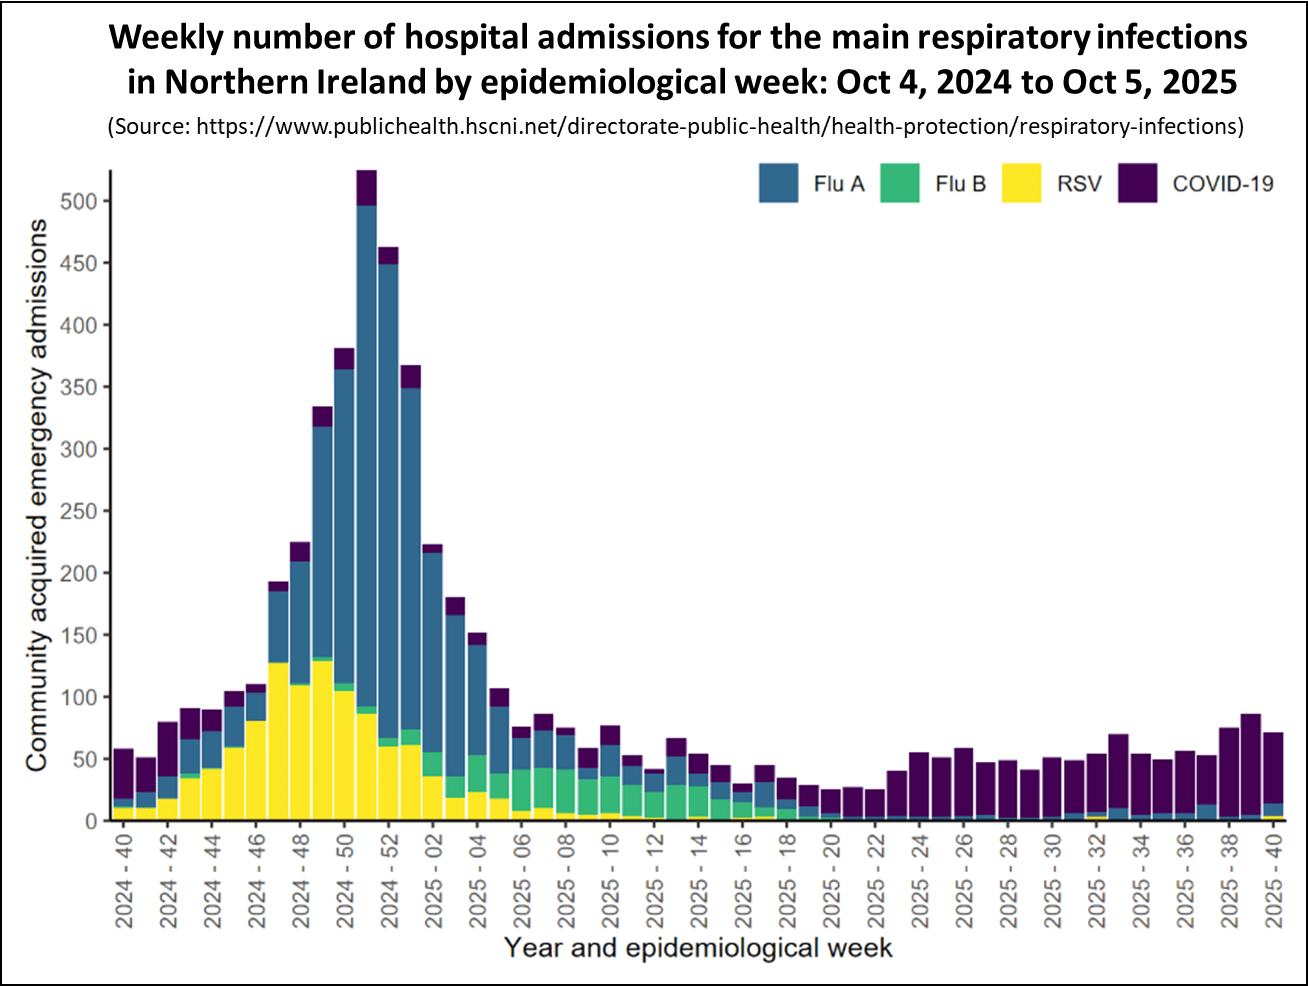
The chart shows that for most of 2024, the bulk of hospital admissions for respiratory infections stemmed from Covid, indicated in purple. Since November 2024 hospital admissions for Covid have been low; however, their was a small increase in May which has now stabilised.
Recent Variants Update
The World Health Organisation (WHO) declared NB.1.8.1 a variant under monitoring in May 2025, followed by the XFG variant in June 2025. In both cases the WHO stated that although they both have a slight growth advantage over other variants circulating, there was no evidence they were a more severe illness.
Based on the limited available data, the following panel chart shows that XFG and NB.1.8.1 remain the dominant variants globally with XFG continuing to grow.
The NB.1.8.1 variant is widespread in several South-East Asian and Western Pacific countries, driving a rise in Covid cases in places like Hong Kong and New Zealand. Covid activity in these countries has now peaked and returned to baseline levels.
This weeks European Respiratory Virus Surveillance Summary reported that the most common Covid variants in GISAID for the European Region in September so far were XFG (59%), XFG.3 (18%), and NB.1.8.1 (10%). Once again, it is important to note that the number of tests sequenced is low, making these estimates uncertain.
Covid Levels in Europe and North America.
Media reports across Europe and in the USA have highlighted that the new variants, particularly XFG, have been detected in these regions, leading to concerns that there may be a new wave of Covid activity over the summer months.
This section looks at the latest data on Covid activity in Europe and North America. While Covid levels have increased in several countries across these regions, they generally remain much lower than those observed during earlier waves.
The following chart shows the latest levels of Covid as measured by monitoring wastewater in a number of European countries that still publish this information.
Over the past week, Covid activity has risen in most of the European countries that still publish Covid levels found in wastewater. While some nations are still at relatively low levels, several have reached moderately high levels.
This week, the CDC was unable to publish Covid data due to the government shutdown. However, other sources of data were available. In particular, interested readers should follow the Force of Infection Substack, where Caitlin Rivers and her team have gathered data from all 50 state health department websites to provide a summary of the status of major respiratory viruses, including COVID-19.
The following panel chart illustrates the recent trends in the USA for Covid test positivity and the percentage of Emergency Department visits diagnosed with Covid.
The charts indicate that Covid activity has steadily declined, marking the end of the recent wave. Wastewater data is also accessible from sources beyond the CDC, and the following chart comes from the WastewaterSCAN Dashboard.
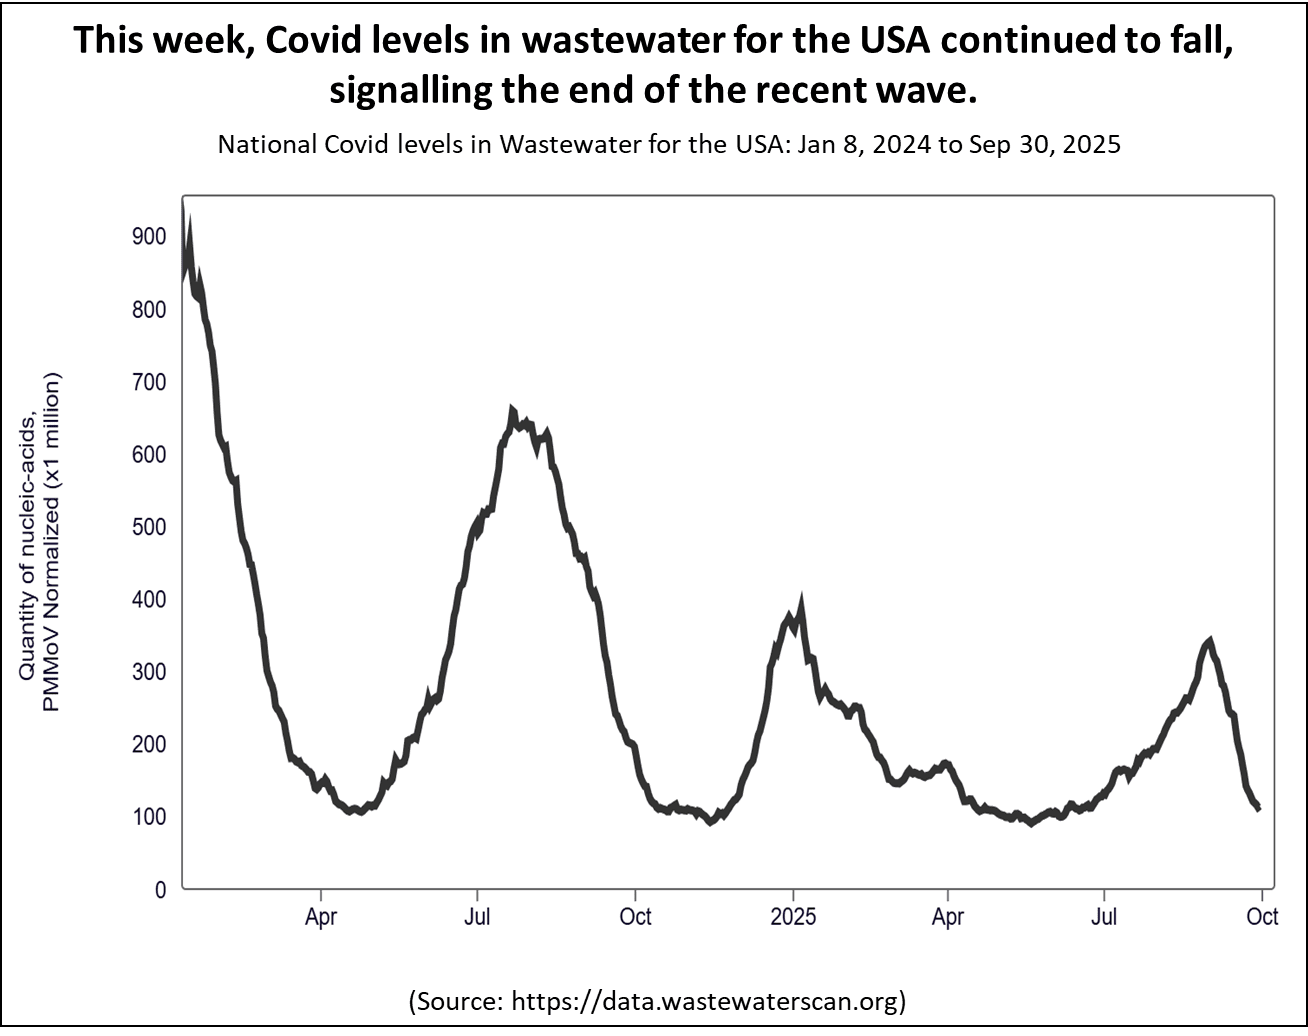
Covid levels detected in wastewater are also falling confirming the trend seen in the test positivity and emergency department visit data.
The final chart in this section shows that Covid activity in Canada, as measured by the latest wastewater levels, fell slightly this week but remains at a moderate level.
In conclusion
Although the amount of data currently being published has fallen, the information available for England and Wales show that Covid levels are increasing. Recent data indicates that Covid activity in Scotland has increased slowly over the past months but remains relatively low. Activity levels in Northern Ireland also remain low.
The WHO have declared NB.1.8.1 and XFG as variants under monitoring due to reported increases in cases and hospitalisations in some countries which have the highest prevalence of these variants. These are now the two most common variants globally.
Covid activity in Europe is rising in several countries and is high in some. In the USA, activity levels have peaked and are now falling quite fast.
As always, if you have any comments on this Covid Situation Report or suggestions for topics to cover, please post a message below.
Thanks for reading Seeing The Forest for the Trees! Subscribe for free to receive new posts and support my work.
Appendix 1. Test positivity rates and prevalence
Positivity rates are derived from the results of hospital laboratory tests conducted on patients exhibiting symptoms of respiratory diseases. Test positivity is the percentage of patients who test positive for Covid of the total number of patients tested. Since the individuals tested for this measure are not a representative sample of the general population it differs from prevalence, which is derived from a representative sample of the population.
Test positivity rates, while not directly estimating the number of Covid infections in the general population, can be a valuable indicator of the infection trend. The panel chart below compares the weekly test positivity rate among hospital patients with respiratory symptoms to the prevalence of Covid in the general population, as reported in the Winter Infection Survey.
The chart shows that the weekly test positivity rates for patients with symptoms of respiratory infections follows the same pattern as the prevalence for Covid reported by the Winter Infection Survey. Since the Winter Infection Survey is based on a representative sample of the general population this supports using test positivity as a useful proxy for infection trends. However it is not possible to use test positivity to estimate prevalence.
This report belongs to a weekly series summarising the Covid situation across the UK's home nations and other countries.
Thanks for reading Seeing The Forest for the Trees! Subscribe for free to receive new posts and support my work.
This week's report covers the latest weekly test positivity rates for England, along with the most recent data for Scotland and Wales. The report also presents the latest data on Covid levels in selected European countries and North America (USA and Canada). Finally, there is a short update on deaths due Covid in England and Wales.
The Covid Situation report depends on the availability of reliable data, which has become harder to access over time. If you are a UK citizen, you might consider supporting a petition urging the UKHSA to monitor COVID infections in specific settings. You can find the petition at the following link.
Summary.
This week, Covid indicators in England increased and are now just below the moderate level of activity. Wales also saw an increase in Covid activity. In contrast, indicators in Scotland were broadly unchanged remaining relatively low.
In England, the test positivity rate increased again this week and is now just below the moderate activity level, indicating a growing risk.
In Scotland, the key indicators of Covid activity remained stable this week. However, the past month has seen a slow increase in the level of Covid indicators, though they remain relatively low.
This week, Covid hospital admissions in Wales increased significantly and are now at moderately high levels.
There was no update published for Northern Ireland this week. Covid activity was stable and low across key surveillance indicators over the previous four weeks.
Deaths due to Covid in England and Wales are are significantly lower this year compared to last year.
Recently, the WHO declared NB.1.8.1 and XFG as variants under monitoring due to reported increases in cases and hospitalisations in some countries which have the highest prevalence of these variants. These remain the two most common variants globally.
Last week, Covid levels in wastewater increased across most European countries, reaching fairly high levels in some areas. Meanwhile, Covid activity in the USA is declining, though it still remains high in some states.
The NHS Autumn Covid booster campaign started on October 1, 2025 with the aim of completing most vaccinations by the end of November 2025. Those eligible for free vaccinations in the Autumn 2025 booster campaign for all home nations are:
adults aged 75 years and over;
residents in care homes for older adults; and
individuals who are immunosuppressed aged 6 months and over.
The Pfizer vaccine updated for the LP.8.1 variant has been approved for use in the Autumn 2025 booster campaign. However, this is only for those immunosuppressed between the age of six months and 12 years old. The older cohort will be vaccinated with the 2024 vaccine updated for the KP.2 variant.
People registered with a GP surgery in England can now book their vaccination appointment and select a date and time starting from 1 October through this link.
As always, it's important to remember that the risk of hospitalisation from Covid increases significantly with age and for the immunocompromised. Therefore, it is important to take appropriate measures such as self-isolating when experiencing Covid symptoms and enhancing ventilation or wearing masks whenever possible.
Status of main respiratory diseases in England.
The UKHSA National flu and COVID-19 surveillance report has moved to a condensed summer report published every two weeks and is not available this week.
Consequently, this weeks report only provides an update on the test positivity rate as published weekly on the UKHSA data dashboard.
This section starts with the latest available data on positivity rates for primary respiratory infections in England. It is important to understand that positivity differs from prevalence, which refers to the overall percentage of COVID-19 in the general population. Appendix 1 provides a more detailed explanation of the difference and why positivity rates are a useful indicator of trends in Covid infection levels.
The following chart shows the test positivity rate for all Covid tests taken as published on the UKHSA dashboard. The positivity rate is mapped against the UKHSA activity thresholds. The thresholds are based on the historical trend for Covid test positivity and, consequently, represent a relative risk. More details on this approach can be found in the Guide to Covid Surveillance Metrics.
The chart indicates that the test positivity rate rose again this week and is now just below the moderate level of activity, suggesting a growing risk.
Scotland weekly hospital admissions and test positivity
Public Health Scotland (PHS) continue to publish weekly data on Covid hospital admissions and test positivity as well as wastewater monitoring data. The dashboard for Scotland's data can be accessed here.
The following panel chart presents the most recent data for weekly Covid test positivity shown in red, Covid levels in wastewater in blue, Covid hospital admissions depicted in orange, and beds occupied by Covid patients in brown.
Covid test positivity, wastewater levels, hospital admissions and occupied beds remained broadly unchanged this week. However, the overall trend for the past months is that the indicators are rising slowly whilst remain at relatively moderately low levels.
Wales Covid hospital admissions.
The following chart provides the latest trend for weekly hospital admissions in Wales up to week ending Sep 21, 2025.
Hospital admissions have risen sharply this week and are now at moderately high levels, reflecting an increased level of Covid activity.
Status of main respiratory diseases in Northern Ireland.
Public Health Northern Ireland publish a weekly surveillance report on influenza, respiratory syncytial virus (RSV), and COVID-19 providing an overview of these infections within Northern Ireland.
Note that over the summer period the Northern Ireland surveillance report is only released every two weeks. Consequently, this section is not updated next week. Last weeks charts are included here for reference .
Flu and RSV activity remained low and stable over the previous two weeks, circulating at baseline levels. Covid indicators showed no significant change, with activity remaining steady and at low levels.
The first chart in this section shows the test positivity rates in Northern Ireland for the main respiratory illnesses — Flu, RSV, and Covid and Rhinovirus. Shading represents 95% confidence intervals.
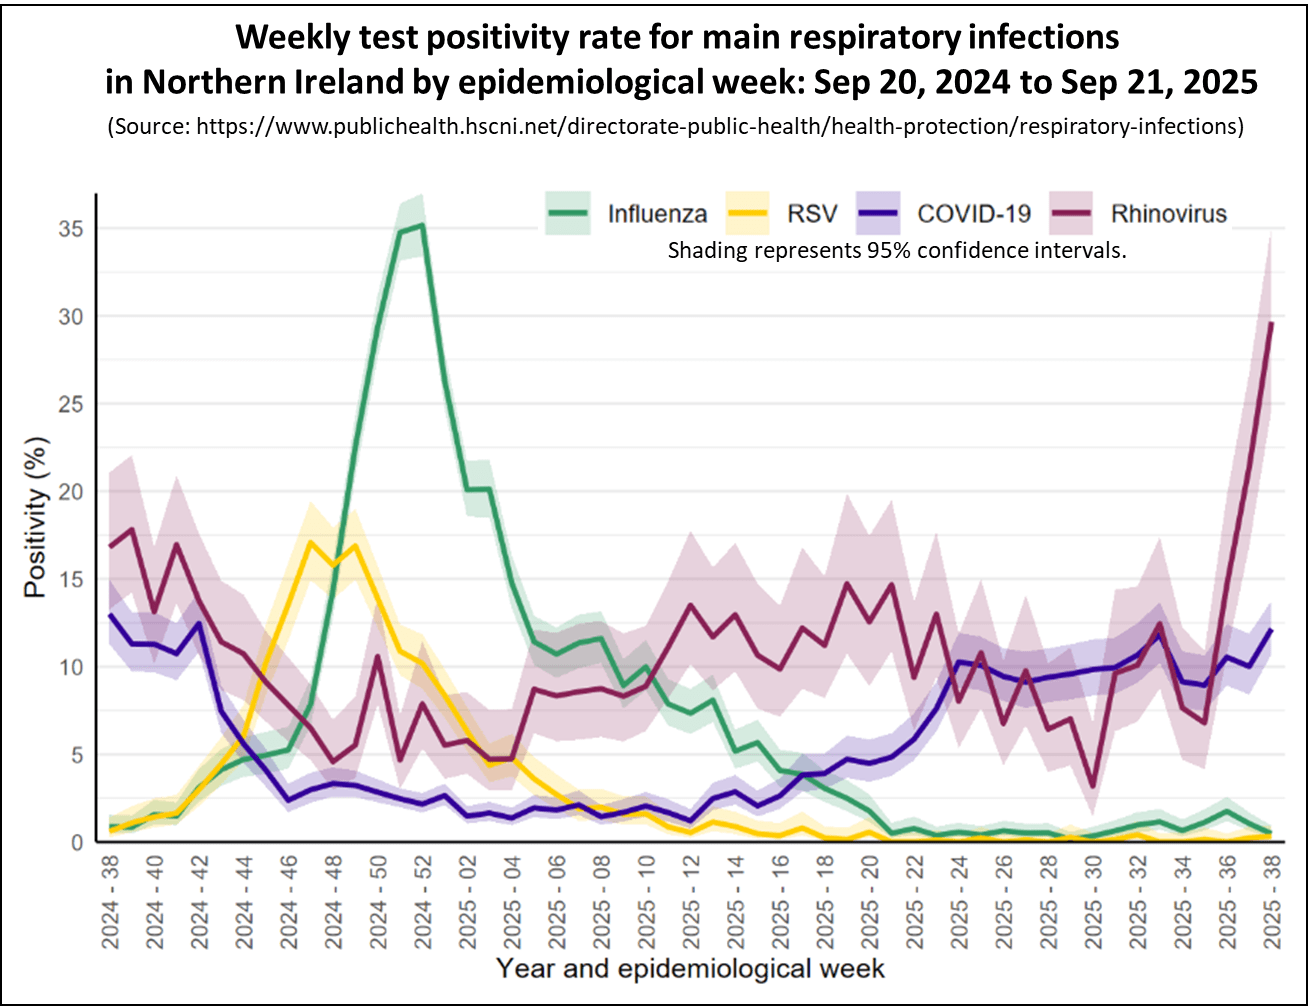
The chart shows that the Covid test positivity rate, depicted in blue, has stabilised over the past six weeks indicating that the increase in Covid activity has stopped.
The chart below presents the weekly count of hospital admissions for the main respiratory illnesses where the infection was contracted in the community, thereby excluding patients who contracted Covid while in hospital.

The chart shows that for most of 2024, the bulk of hospital admissions for respiratory infections stemmed from Covid, indicated in purple. Since November 2024 hospital admissions for Covid have been low; however, their was a small increase in May which has now stabilised.
Covid deaths in England and Wales
The Office of National Statistics (ONS) releases weekly reports on deaths listed on certificates due to or involving Covid. The data covers both England and Wales. The following chart compares the weekly deaths due to Covid in England and Wales for 2024-25 with the same period for 2023-24. The figures in the chart are based on the date a death was registered, which is usually later than the date it occurred.
The chart shows that deaths due to Covid were lower in nearly every week of 2024-25 compared to the same weeks in 2023-24. During the period shown, the number of deaths in 2024-25 (3,747) was just over half of those recorded in 2023-24 (7,344).
Recent Variants Update
The World Health Organisation (WHO) declared NB.1.8.1 a variant under monitoring in May 2025, followed by the XFG variant in June 2025. In both cases the WHO stated that although they both have a slight growth advantage over other variants circulating, there was no evidence they were a more severe illness.
This week, UK news outlets reported that the WHO identified BA.3.2 as a new variant potentially requiring monitoring due to its higher likelihood of evading the immune system. These reports stemmed from a data request by the WHO Technical Vaccine Advisory Group to help shape their December 2025 recommendations on future Covid vaccine compositions.
Initially identified in South Africa, the BA.3.2 variant was first detected outside South Africa in the Netherlands on April 2025. In June 2025, a study reported in the Lancet found that BA.3.2 was more likely to evade the immune system but was not as infectious. The report summarised the study findings as follows:
In summary, our findings indicate that BA.3.2 exhibits robust antibody evasion but has low ACE2-binding capability and infectivity, which substantially limits its likelihood of prevailing.
Currently, BA.3.2 is not outcompeting any of the variants currently in circulation, as illustrated in the chart below. However, the WHO is taking a cautious stance in requesting further information before making recommendations for future vaccines.
Based on the limited available data, the panel chart shows that XFG and NB.1.8.1 remain the dominant variants globally with XFG continuing to grow.
The NB.1.8.1 variant is widespread in several South-East Asian and Western Pacific countries, driving a rise in Covid cases in places like Hong Kong and New Zealand. Fortunately, Covid activity in these countries has now peaked and returned to baseline levels.
This weeks European Respiratory Virus Surveillance Summary reported that the most common Covid variants in GISAID for the European Region in September so far were XFG (71%); NB.1.8.1 (12%); and XFG.3 (5%). Once again, it is important to note that the number of tests sequenced is low and these estimates have a wide range of uncertainty.
Covid Levels in Europe and North America.
Media reports across Europe and in the USA have highlighted that the new variants, particularly XFG, have been detected in these regions, leading to concerns that there may be a new wave of Covid activity over the summer months.
This section looks at the latest data on Covid activity in Europe and North America. While Covid levels are increasing in several countries across these regions, they generally remain much lower than those observed during earlier waves.
The following chart shows the latest levels of Covid as measured by monitoring wastewater in a number of European countries that still publish this information.
Over the past week, Covid activity has risen in many countries based on wastewater levels. While some nations are still at relatively low levels, several have reached moderately high levels.
The following panel chart illustrates the recent trends in the USA regarding Covid test positivity and Covid levels in wastewater. It also highlights the health impact, measured by the percentage of Emergency Department visits diagnosed with Covid and the hospital admission rate per 100,000 people.
Covid activity in the USA has fallen over the past week as measured by all key indicators and are now at moderate levels.
Wastewater analysis also shows that Covid levels are now falling across many US States, as illustrated in the following map. The map shows wastewater viral activity levels across states for the week ending Sep 20, 2025.
Each state is coloured based on activity levels, ranging from very high (dark red) to very low (light green), with grey indicating no data available. States with increasing activity levels are marked with cross-hatching. The map is interactive, and moving the cursor over a state provides additional detail about wastewater viral activity levels.
The interactive map shows that wastewater activity levels decreased in 35 states last week, and 28 are at a high or very high level of activity. Wastewater activity levels are typically highest in states that are holiday destinations.
Further details on the trend in Covid activity at the State level can be found at the CDC Current Epidemic Trends for States website which can be accessed here. Just to note that on August 15, 2025, CDC updated the methodology used to calculate the wastewater viral activity level. For more information, visit CDC's Wastewater Surveillance Data Methodology page.
The final chart in this section shows that Covid activity in Canada, as measured by the latest wastewater levels, fell this week but remains at a moderate level.
In conclusion
Although the amount of data currently being published has fallen, the information available for England and Wales show that Covid levels are increasing. Recent data indicates that Covid activity in Scotland has increased slowly over the past months but remains relatively low.
The WHO have declared NB.1.8.1 and XFG as variants under monitoring due to reported increases in cases and hospitalisations in some countries which have the highest prevalence of these variants. These are now the two most common variants globally.
Covid activity in Europe is rising in several countries and is high in some. In the USA, activity levels have peaked, although some states are still experiencing high levels.
As always, if you have any comments on this Covid Situation Report or suggestions for topics to cover, please post a message below.
Thanks for reading Seeing The Forest for the Trees! Subscribe for free to receive new posts and support my work.
Appendix 1. Test positivity rates and prevalence
Positivity rates are derived from the results of hospital laboratory tests conducted on patients exhibiting symptoms of respiratory diseases. Test positivity is the percentage of patients who test positive for Covid of the total number of patients tested. Since the individuals tested for this measure are not a representative sample of the general population it differs from prevalence, which is derived from a representative sample of the population.
Test positivity rates, while not directly estimating the number of Covid infections in the general population, can be a valuable indicator of the infection trend. The panel chart below compares the weekly test positivity rate among hospital patients with respiratory symptoms to the prevalence of Covid in the general population, as reported in the Winter Infection Survey.
The chart shows that the weekly test positivity rates for patients with symptoms of respiratory infections follows the same pattern as the prevalence for Covid reported by the Winter Infection Survey. Since the Winter Infection Survey is based on a representative sample of the general population this supports using test positivity as a useful proxy for infection trends. However it is not possible to use test positivity to estimate prevalence.
This report belongs to a weekly series summarising the Covid situation across the UK's home nations and other countries.
Thanks for reading Seeing The Forest for the Trees! Subscribe for free to receive new posts and support my work.
This week's report covers the latest information for England, along with the most recent data for Scotland, Wales, and Northern Ireland. The report also presents the latest data on Covid levels in selected European countries and North America (USA and Canada). Finally there is a short correction to information on Covid vaccines published in last weeks report
Summary.
This week the key indictors show that Covid activity continues to increase slowly across all Home Nations, although levels remain relatively low.
In England, Covid test positivity continued to increased slowly over the past two weeks and are now solidly within the low activity threshold level. Hospital admissions also increased but remain relatively low.
In Scotland Covid levels found in wastewater increased slightly, continuing the gradual upward trend seen in recent months.
Covid hospital admissions in Wales have risen slightly this week. Although still relatively low, there has been a gradual increase over the past month.
In Northern Ireland, Covid activity has increased across the majority of surveillance indicators but remains relatively low.
The WHO have declared NB.1.8.1 and XFG as variants under monitoring due to reported increases in cases and hospitalisations in some countries which have the highest prevalence of these variants. These remain the two most common variants globally with XFG dominant in Europe and the Americas.
Over the past week, Covid activity has risen in many European countries according to wastewater data. While some nations are keeping levels relatively low, Denmark, Sweden, and Austria are experiencing high activity. Covid activity also increased in USA but there are signs levels have peaked.
The NHS Autumn Covid booster campaign will start on 1 October 2025 with the aim of completing most vaccinations by the end of November 2025. Those eligible for free vaccinations in the Autumn 2025 booster campaign for all home nations are:
adults aged 75 years and over;
residents in care homes for older adults; and
individuals who are immunosuppressed aged 6 months and over.
The Pfizer vaccine updated for the LP.8.1 variant has been approved for use in the Autumn 2025 booster campaign. However, this is only for those immunosuppressed between the age of six months and 12 years old. The older cohort will be offered the vaccine updated for the KP.2 variant.
People registered with a GP surgery in England can now book their vaccination appointment and select a date and time starting from 1 October through this link.
As always, it's important to remember that the risk of hospitalisation from Covid increases significantly with age and for the immunocompromised. Therefore, it is important to take appropriate measures such as self-isolating when experiencing Covid symptoms and enhancing ventilation or wearing masks whenever possible.
Covid vaccines offered in the UK - Correction
Last week, I shared an update on the Covid vaccines available in the UK, but I need to correct a mistake made in that update.
Even though the updated Pfizer LP.8.1 vaccine has been approved for use in the UK, it won't be available to everyone eligible for free vaccination through the NHS. It will only be offered to eligible individuals aged 6 months to 11 years, while all other eligible groups will be offered the Pfizer KP.2 vaccine.
For those who aren't eligible for free vaccinations but still want protection, the Pfizer LP.8.1 vaccine should be available for purchase at local pharmacies.
Status of main respiratory diseases in England.
Note that presently the UKHSA National flu and COVID-19 surveillance report is released every two weeks. Consequently, this section will not be fully updated next week.
This section starts with the latest available data on positivity rates for primary respiratory infections in England. It is important to understand that positivity differs from prevalence, which refers to the overall percentage of COVID-19 in the general population. Appendix 1 provides a more detailed explanation of the difference and why positivity rates are a useful indicator of trends in Covid infection levels.
The first chart in this section shows the test positivity rate for all Covid tests taken, including those outside of hospitals, and is mapped against the UKHSA activity thresholds. The thresholds are based on the historical trend for Covid test positivity and, consequently, represent a relative risk. More details on this approach can be found in the Guide to Covid Surveillance Metrics.
The chart below displays the test positivity rates for hospital patients for the main respiratory illnesses in England, covering Flu, Covid, RSV, and Rhinovirus.
The chart shows that the test positivity rate increased slightly over the past two weeks, maintaining its upward trend since the start of the year, and is now solidly within the low activity threshold. This indicates a relatively low but growing level of risk. The positivity rate for Flu and RSV remained low, but the rate for Rhinovirus increases significantly.
The next chart in this section shows weekly hospital admissions per 100,000 people in England for the main respiratory diseases.
Over the last two weeks, weekly hospital admission rates for Covid have gone up but are still at baseline levels. The highest rates were seen in the North East region, rising to 4.42 per 100,000 from 3.58 the previous week, and in those aged 85 and older, increasing to 24.97 per 100,000 from 17.53 the previous week.
The final chart in this section depicts the estimated prevalence of the main Covid variants in England from Jan 14, 2024 to Aug 31, 2025. It clearly shows that XFG is the dominant variant in England.
Scotland weekly hospital admissions and test positivity
Scotland continues to publish weekly data on Covid hospital admissions and test positivity as well as wastewater monitoring data. The dashboard for Scotland's data can be accessed here.
Unfortunately, Covid hospital admissions and test positivity data was not available at the time of publication because of technical problems at Public Health Scotland.
However, Covid levels in wastewater data was published this week and the following chart present the latest data up to Sep 15, 2025.
Covid levels in wastewater remained stable this week. However, there has been a slow upward trend over the past few months, reflecting similar patterns in hospital admissions and test positivity rates
Wales Covid hospital admissions.
The following chart provides the trend for weekly hospital admissions in Wales up to week ending Sep 21, 2025.
While hospital admissions for Covid in Wales increased this week and remain low, there has been a gradual upward trend over the past two months.
Status of main respiratory diseases in Northern Ireland.
Public Health Northern Ireland publish a weekly surveillance report on influenza, respiratory syncytial virus (RSV), and COVID-19 providing an overview of these infections within Northern Ireland.
Note that over the summer period the Northern Ireland surveillance report is only released every two weeks. Consequently, this section will not be updated next week.
Covid levels have increased but remain relatively low across most surveillance indicators. Flu has shown a slight uptick in some areas but, like RSV, remains low and within typical seasonal ranges.
The first chart in this section shows the test positivity rates in Northern Ireland for the main respiratory illnesses — Flu, RSV, and Covid and Rhinovirus. Shading represents 95% confidence intervals.

The chart shows that the Covid test positivity rate, depicted in blue, has stabilised over the past six weeks indicating that the increase in Covid activity has stopped.
The chart below presents the weekly count of hospital admissions for the main respiratory illnesses where the infection was contracted in the community, thereby excluding patients who contracted Covid while in hospital.
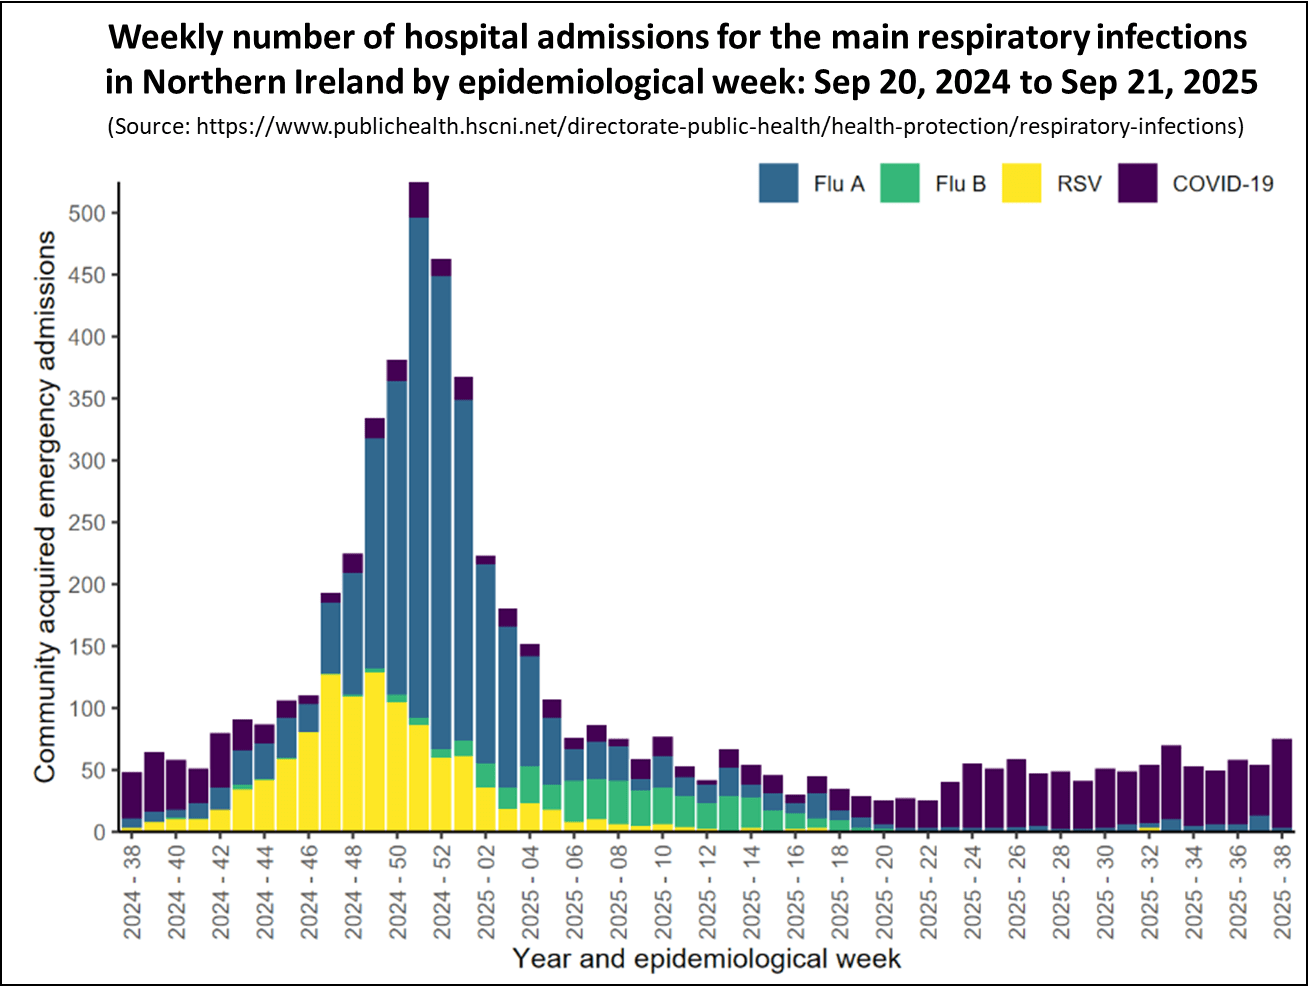
The chart shows that for most of 2024, the bulk of hospital admissions for respiratory infections stemmed from Covid, indicated in purple. Since November 2024 hospital admissions for Covid have been low; however, their was a small increase in May which has now stabilised.
Recent Variants Update
Recently, the WHO declared NB.1.8.1 a variant under monitoring but assessed the risk to public health as low. This was because although it has a slight growth advantage over other variants circulating, there was no evidence it was a more severe illness.
On June 25, the XFG variant was also classified as a variant under monitoring by the WHO. In their risk evaluation the WHO stated that the risk level was also low, noting that whilst XFG has grown rapidly compared to other variants circulating there are no reports to suggest that the associated disease severity is higher.
The following chart shows the latest global prevalence data for the main variants by week over the past few months.
Based on the limited data available, the most prevalent variant is XFG which accounted for 67% of all submitted sequences in the week ending on Aug 31, 2025 which is an increase from 58% in the week ending on Aug 3, 2025. NB.1.8.1 accounted for 21% of all submitted sequences in the week ending on Aug 31, 2025, a decrease from 25% in the week ending on Aug 3, 2025.
The NB.1.8.1 variant is dominant in several South-East Asian and Western Pacific countries, which contributed to increased Covid activity in places like Hong Kong and New Zealand. However, Covid activity in these regions has already peaked and fallen to low levels.
The European Respiratory Virus Surveillance Summary reported that the most common Covid variants in GISAID for the European Region in August so far were XFG (76%) and NB.1.8.1 (10%). Once again, it is important to note that the number of tests sequenced is low and these estimates have a wide range of uncertainty.
Covid Levels in Europe and North America.
Media reports across Europe and in the USA have highlighted that the new variants, particularly XFG, have been detected in these regions, leading to concerns that there may be a new wave of Covid activity over the summer months.
This section examines the latest Covid data in Europe and North America. Covid activity is on the rise in many countries across these regions, with some reaching high levels as indicated by wastewater measurements. However, levels are still lower than those seen in earlier waves inmost countries.
The following chart shows the latest levels of Covid as measured by monitoring wastewater in a number of European countries that still publish this information.
Over the past week, Covid activity has risen in most countries according to wastewater data, particularly in Denmark and Sweden. Levels in Germany, Austria and France continue to increase and are at moderate levels, with Netherlands the only country showing a slight fall.
Covid activity in the USA has also risen over the past month, with moderate to high levels indicated by key metrics. However, this weeks data presents a mixed picture, showing some signs that Covid levels might have peaked.
The following panel chart illustrates the recent trends in the USA for Covid test positivity and Covid levels in wastewater. It also highlights the health impact, measured by the percentage of Emergency Department visits diagnosed with Covid and the hospital admission rate per 100,000 people.
Wastewater viral activity levels are also available at the state level and the following map presents this data for the week ending Sep 13, 2025. Each state is coloured based on activity levels, ranging from very high (dark red) to very low (light green), with grey indicating no data available. States with increasing activity levels are marked with cross-hatching. The map is interactive, and moving the cursor over a state gives additional detail about wastewater viral activity levels.
The map shows that in the past week, 29 states experienced high or very high levels of Covid wastewater activity. However, 36 states reported decreasing yet still high levels, suggesting that Covid activity might have peaked.
The final chart in this section shows that Covid activity in Canada, as measured by the latest wastewater levels, was unchanged and remains at a moderate level.
In conclusion
While the amount of published data has decreased, the available information for England, Scotland, Wales, and Northern Ireland indicates that Covid activity is increasing but levels remains relatively low.
The WHO have declared NB.1.8.1 and XFG as variants under monitoring due to reported increases in cases and hospitalisations in some countries which have the highest prevalence of these variants. These are now the two most common variants globally.
The situation in Europe and the USA varies, with many countries and states experiencing high activity levels, although these remain below the levels observed during earlier waves..
As always, if you have any comments on this Covid Situation Report or suggestions for topics to cover, please post a message below.
Appendix 1. Test positivity rates and prevalence
Positivity rates are derived from the results of hospital laboratory tests conducted on patients exhibiting symptoms of respiratory diseases. Test positivity is the percentage of patients who test positive for Covid of the total number of patients tested. Since the individuals tested for this measure are not a representative sample of the general population it differs from prevalence, which is derived from a representative sample of the population.
Test positivity rates, while not directly estimating the number of Covid infections in the general population, can be a valuable indicator of the infection trend. The panel chart below compares the weekly test positivity rate among hospital patients with respiratory symptoms to the prevalence of Covid in the general population, as reported in the Winter Infection Survey.
The chart shows that the weekly test positivity rates for patients with symptoms of respiratory infections follows the same pattern as the prevalence for Covid reported by the Winter Infection Survey. Since the Winter Infection Survey is based on a representative sample of the general population this supports using test positivity as a useful proxy for infection trends. However it is not possible to use test positivity to estimate prevalence.

As we brace ourselves for chillier days and look forward to more indoor gatherings and seasonal social events with friends and family, now is the ideal time to remind ourselves of behaviours that can reduce the spread of respiratory infections known to peak during the autumn and winter period.
The early start to the current flu season and the emergence of the drifted influenza A(H3N2) strain has caused some concern. Early data from UKHSA rapidly assessed how well this season's flu vaccines are working. This showed the flu vaccines are providing good protection against hospitalisation in children and adults. There are currently no changes to the advice on what to do if you have, or think you may have COVID-19, influenza (flu) or any other respiratory infection.
Vaccines help protect those most vulnerable from developing serious illness and being hospitalized and we strongly encourage all those eligible to get vaccinated against flu as soon as possible - vaccines remain our best defence.
What actions can I take to avoid catching or spreading respiratory illnesses?Here is a list of simple actions you can take to reduce the spread of respiratory infections, and protect those at highest risk:
- Get vaccinated if you are eligible
- If you are feeling unwell, stay at home
- If you're meeting people indoors, open a window for fresh air. Just keep in mind the room temperature and whether anyone might be sensitive to the cold
- Practise good hygiene:
- cough into your bent elbow, or use a tissue and dispose of it afterwards in the nearest bin
- wash your hands frequently with warm water and soap
- clean your surroundings often, especially areas that are touched frequently such as door handles
- Wear a mask when you are unwell and need to go out
Masks continue to be a useful tool in limiting the spread respiratory viruses in some situations.
Wearing a well-fitting mask when unwell can reduce the number of particles containing viruses that are released from the mouth and nose of someone who is infected with a respiratory infection.
Face coverings can also protect the person wearing them from becoming infected with other respiratory viruses.
There is further information on when people with symptoms of a respiratory infection should wear a face covering in the guidance for people with symptoms of a respiratory infection.
What should I do if I have symptoms?If you have symptoms of a respiratory infection and you have a high temperature or do not feel well enough to go to work or carry out normal activities, try to stay at home and avoid contact with other people, until you no longer have a high temperature (if you had one), or until you no longer feel unwell.
If you need to go out, then avoid close contact with anyone who you know is at higher risk of becoming seriously unwell.
Should I get vaccinated against flu, COVID-19 or RSV?Flu can be particularly dangerous for certain groups, which is why they are eligible for the vaccination programme. This includes pregnant women, young children, those with certain long-term health conditions, and older adults aged 65 years and over. You can find the full list of those eligible here.
For those who are more likely to become seriously ill from COVID-19, the NHS also offers a free vaccine in the autumn and winter. See the list of those eligible here.
RSV can be especially dangerous for infants and the elderly. Pregnant women at week 28 or soon after and everyone aged 75 to 79, or who turned 80 after 1 September 2024, can have a vaccine to protect themselves or their babies against Respiratory Syncytial Virus (RSV).
Should I be vaccinated against flu, whooping cough and RSV during pregnancy?Being pregnant changes the way your body handles infections and can restrict the depth of your breathing as the baby grows and pushes on your lungs. This can make you more vulnerable to severe complications from flu, such as pneumonia. If you catch flu during pregnancy, it can also cause your baby to be born prematurely or have a low birth weight and, if you get infection near to delivery, you can also pass it to your newborn baby. Babies under 6 months of age have one of the highest hospitalisation rates for flu every season. Vaccinating against flu during your pregnancy means that you will make an immune response (including antibodies) to the vaccine, and these protective antibodies are passed onto your baby through the placenta, helping to protect your baby for the first few months of their life. You can have the flu vaccine at any stage of pregnancy, from conception onwards.
The best way to protect babies against RSV infection is for the mother to have the vaccine during pregnancy. Vaccination reduces the risk of severe RSV lung infection by around 70% in the first 6 months of a baby's life.
If you're pregnant, you are also eligible to receive a vaccine against pertussis (whopping cough), to help protect your baby for the first few months of life. This disease can circulate at any time of year, including during the winter months. You'll usually be offered a vaccine called ADACEL that protects against whooping cough, diphtheria and tetanus.
All vaccines go through a regulatory approval process to ensure they meet strict safety and effectiveness checks. And it's fine to have the jabs at any stage of pregnancy. Millions of women in England have had the flu vaccine during pregnancy since this was introduced in 2011. Flu, whooping cough and RSV vaccines do not contain live virus and cannot infect your unborn baby.
What should I do if my child is unwell?Current guidelines for parents state that it's fine to send your child to school with a minor cough or common cold. Children and young people who are unwell and have a high temperature should stay at home and avoid contact with other people, where they can.
There is wide agreement among health and educational professionals that school attendance is vital to the life chances of children and young people. Being in school regularly improves mental and physical health, wellbeing and socialisation throughout children's lives.
This year, school-aged children and young people from reception up to year 11 are being offered the flu vaccination nasal spray at their school: parents should look out for the electronic or paper consent form and be sure to return it when asked to do so.
If you have a child aged 2 or 3 years on 31 August 2025 (born between 1 September 2021 and 31 August 2023), you can book a flu vaccine at your GP practice. Find out more at the NHS website.
Following this guidance should help you and your family avoid catching a respiratory illness this winter, and if someone close to you is eligible for a vaccine, encourage them to take it up - it will reduce their risk of becoming seriously ill this season.

This blog post was last checked and updated December 2025.
You might have a lot on right now, but winter illness could throw all your plans out of the window.
We see cases of influenza (flu), RSV and COVID-19 throughout the year, but in winter they circulate at the same time and can reach high levels.
We also track other respiratory viruses - rhinovirus, adenovirus, human metapneumovirus (hMPV) and parainfluenza - that can also peak over the autumn and winter months.
There are vaccines to help protect against flu, COVID-19 and RSV, which are offered to different vulnerable groups.
Staying at home when you have symptoms of flu or COVID-19 helps protect those who are vulnerable. If you need to go out when unwell, consider wearing a mask around other people.
Simple measures like catching coughs and sneezes in a tissue, regular handwashing, and opening a window when meeting others indoors can all help reduce the spread of respiratory infections.
You can find advice on managing winter illnesses on the NHS website, including how to use medications like paracetamol and ibuprofen. If you are taking cold or flu remedies, check whether they already contain paracetamol to make sure you don't take too much. If you have any concerns, speak to your pharmacist.
The following is an explainer of important information about these winter infections; their signs and symptoms, and information on who is eligible for vaccination.
FluFlu - also known as influenza - is a viral infection affecting the nose, throat, and lungs, mostly during the winter months. It is far worse than an ordinary cold, which usually causes a runny nose, sneezing, watery eyes and throat irritation. Symptoms of a cold usually occur gradually without causing a fever or body aches, which usually occur with flu. Flu signs and symptoms develop very rapidly and extreme tiredness is common.
Flu can lead to serious illness, especially in children, with thousands of hospitalisations each winter. Older people, those with a weakened immune system, and people with certain long-term health conditions are at higher risk. Last winter there were around 8,000 deaths associated with flu - this is higher than the approximately 3,500 deaths recorded the year before, but lower than during the 2022 to 2023 season, when there were around 16,000 deaths.
For those who took up the offer, last year's flu vaccine had a significant impact on reducing severe illness, ranging from an almost 40% reduction in the number of those aged 65 and over being hospitalised, and a 75% reduction in those aged between 2 and 17 years.
Many people are eligible for the flu vaccine including:- everyone aged 65 years and over
- those aged between 6 months and 65 with certain medical conditions
- those living with people who are immunocompromised
- frontline health and social care workers
- all pregnant women, to protect both themselves, their pregnancy and their newborn
- all children aged 2 and 3 years
- school-aged children (reception to year 11) are offered a nasal spray vaccine through school immunisation teams.
Flu is infectious and can easily be spread to other people. You are more likely to give it to others in the first 3 to 5 days
COVID-19While for most people COVID-19 is not as severe as during the early years of the pandemic, the virus is still causing severe illness, hospitalisations, and deaths - particularly among those with a weakened immune system and those 75 year old and over.
It is normal and expected for viruses to genetically change over time and the current COVID-19 variants, much like previous variants, can spread easily through droplets released when an infected person coughs, sneezes or speaks. The autumn COVID-19 vaccines are our best defence against serious illness.
We have seen COVID-19 symptoms change over time. Today, many people now experience cold-like symptoms and some will also experiencefever or chills, continuous cough, shortness of breath, tiredness, body aches, headache, sore throat, blocked nose, loss of appetite, nausea, diarrhoea, or change in sense of taste or smell. Some people report a hoarse voice or a particularly painful sore throat, associated with the latest variants. This has been referred to in the media as 'razor-blade throat'.
People aged 75 and over, living in a care home for older adults, or in who are immunosuppressed and aged over 6 months, are eligible for a COVID-19 vaccine.
Rhinovirus (as the most common cause of the 'common cold')Rhinovirus causes what we know as the common cold. Cold symptoms come on gradually over 2 to 3 days.
The main symptoms include a blocked or runny nose, sneezing, a sore throat, a hoarse voice, a cough, feeling tired and unwell. You may also have a high temperature, aching muscles, a loss of taste and smell and a feeling of pressure in your ears and face.
Symptoms of a cold can last longer in young children. They may also be irritable, have difficulty feeding and sleeping, breathe through their mouth, and get sick after coughing.
You can get more information on telling the difference between colds and flu via the NHS website.
RSVRespiratory syncytial virus (RSV) is a major respiratory virus that is common over the winter period, typically November to February, and can spread through coughs and sneezes.
Symptomsinclude cough, wheezing, shortness of breath, tiredness and fever.
While the symptoms are mild for many, RSV can cause bronchiolitis in infants, which can make it difficult for them to breathe and feed. You may see your baby experiencing fast or noisy breathing and being unsettled or difficult to comfort. This accounts for approximately 20,000 hospitalisations annually in children aged under 1.
RSV can also be severe in older adults, causing pneumonia and flare-ups of existing lung disease and other long-term conditions. It causes around 9,000 hospitalisations in those aged 75 and over in the UK each year.
An NHS vaccine has been introduced for pregnant women, to protect babies once they are born, and for those aged 75 to 79 years. It hasn't been recommended for those age 80 or older because there were too few people of that age in the clinical trials to be sure of protection.
If received during pregnancy, the vaccine reduces the risk of severe bronchiolitis by 70% in the first 6 months of a baby's life.
AdenovirusAdenoviruses are a group of viruses that cause a range of infections. Adenovirus infections can occur at any time of year. While adenovirus infections are most common in babies and young children, people of any age can be affected. Most are mild and cause symptoms similar to a common cold:
- fever
- sore throat
- runny or congested nose
- cough
Adenovirus can also cause other illnesses, including conjunctivitis (pink eye), lung infections (like bronchitis and pneumonia), croup (a barking cough in children), ear infections, and gastroenteritis (tummy bug). Adenovirus can be more severe in people with weakened immune systems.
Parainfluenza and human metapneumovirus (hMPV)These viruses cause a wide range of symptoms similar to those of a cold.
Parainfluenza viruses are common causes of respiratory infections in infants, young children, older adults, and people with weakened immune systems.
hMPV typically causes mild, cold-like illnesses in people of all ages. It is seen throughout the year, but can spread more easily in winter.
Tracking these illnessesYou can see our surveillance reports which track these viruses, plus flu and COVID-19 here.

As we enter autumn, rates of respiratory illnesses start to rise and people ask how the most common current lineages - or groups of genetically similar viruses - compare to previous COVID-19 variants.
What have we seen so far?The most common current variants are the XFG and NB.1.8.1 (sometimes referred to in the media as the Stratus and Nimbus variants). Our genomic surveillance of SARS-CoV-2 lineages last month found that 35% were classified as XFG.3, 28% were classified as XFG, 11% were classified as NB.1.8.1, 7% were classified as XFG.5 and 7% were classified as XFG.3.4.1. You can see our latest data on the National flu and COVID-19 surveillance reports.
Current data does not indicate that these variants lead to more severe illness than other variants in circulation.
It's normal for viruses to mutate and change, and as more data becomes available on these variants we'll have a better understanding of how they interact with our immune systems and how to optimise our protection, as well as actions we can take to keep the most vulnerable safe and live our lives as normally as possible. The most important thing is for those eligible to get their vaccination when it is due.
If people become unwell, and are unsure if they have COVID-19, what should they do?If you have symptoms of a respiratory infection, such as COVID-19, and you have a high temperature or do not feel well enough to go to work or carry out normal activities, you should avoid contact with vulnerable people and stay at home if possible.
For those of us who absolutely can't stay at home, the Living with COVID guidance remains unchanged, and will reduce the chance of passing on your infection to others:
- Wear a well-fitting face covering made with multiple layers or a surgical face mask
- Avoid crowded places such as public transport, large social gatherings, or anywhere that is enclosed or poorly ventilated
- Take any exercise outdoors in places where you will not have close contact with other people
- Cover your mouth and nose when you cough or sneeze; wash your hands frequently with soap and water for 20 seconds or use hand sanitiser after coughing, sneezing and blowing your nose and before you eat or handle food; avoid touching your face
Vaccines remain our best defence against severe disease and hospitalisation from flu and COVID-19. You can find details of who is eligible and how they can book their vaccination here.
What surveillance systems are in place?We publish the latest surveillance data for COVID-19 and other respiratory illnesses on the UKHSA data dashboard. We're also getting vital data from those who are admitted to hospital with symptoms, and use genome sequencing to understand which variants people are most vulnerable to.
Hospital is where we will see the more severe cases, and we will be monitoring the numbers of people attending who test positive or with COVID-19 symptoms very carefully. This will help us understand the growth rate and transmission potential of the current variants.
We continue to collaborate globally with health organisations in other countries, WHO and initiatives such as the Global Influenza Surveillance & Response System (GISAID) to ensure that we have the most current data.

This blog post was reviewed and updated in September 2025.
When autumn comes, protection from any earlier COVID-19 vaccination you may have had will be starting to wane. For those who are more likely to become seriously ill from COVID-19, the NHS offers a free vaccine in the autumn, previously known as the 'Autumn Booster'.
Current vaccines provide good protection against severe disease and hospitalisation. UKHSA surveillance data relating to last autumn's programme shows that those who received a vaccine were around 43% less likely to be admitted to hospital with COVID-19 from 2 weeks following vaccination, compared to those who remained unvaccinated.
Vaccination continues to help protect against severe illness, hospitalisations and deaths arising from COVID-19. Last winter, between November, December and January around 13,000 people were admitted to hospital with the virus.
Eligible groups for autumn 2025The Joint Committee on Vaccination and Immunisation (JCVI) has updated its advice for the autumn 2025 COVID-19 vaccination programme, which has been accepted by ministers. The focus of the programme is shifting towards targeted vaccination of those at highest risk of serious disease.
For autumn 2025, COVID-19 vaccination will be offered to:
- adults aged 75 years and over
- residents in care homes for older adults
- individuals who are immunosuppressed aged 6 months and over
This represents a change from the autumn 2024 programme, which also included adults aged 65 to 74 and all those aged 6 months and over in a clinical risk group.
The eligibility is the same across the 4 nations of the UK (England, Scotland, Wales and Northern Ireland).
The vaccine should usually be offered no earlier than around 6 months after the last vaccine dose. If you are eligible, you can get protection from an autumn COVID-19 vaccination even if you have not taken up a COVID-19 vaccine offer in the past.
Eligibility for the immunosuppressedWe understand that having a weakened immune system (immunosuppression) is a lot less straight forward than the other criteria. Looking online can cause even more confusion, as people might see themselves (and be considered by others) as immunosuppressed but might not fit the immunosuppression criteria for vaccination.
So, what are the immunosuppression criteria? Eligibility is outlined in Chapter 14a of the Green Book, a document published by UKHSA specifically for public health professionals. It can be a complicated document for non-experts, so we've listed some of the groups here:
- Organ, bone marrow or stem cell transplant patients
- Those being treated with systemic steroids for more than a month
- Those living with HIV
- Those receiving immunosuppressive or immunomodulating biological therapy, including children who are about to receive therapy
- Those undergoing chemotherapy or radiotherapy
- Those requiring long-term treatment for immunosuppression
- Those with a history of haematological malignancy including chronic leukaemia, lymphomas, and leukaemia
- Those with genetic disorders affecting the immune system
While this list summarises some major groups, it does not cover everything. Please check online at nhs.uk/get-vaccine to see if you are eligible.
How to access the COVID-19 autumn vaccinationCOVID-19 spreads more easily in winter because we spend more time indoors with others.
Appointments for the COVID-19 vaccination are open now.
If you are eligible, having your COVID-19 vaccination this autumn will give you protection from serious COVID illness over winter.

As we move into spring, protection from any earlier COVID-19 vaccination you may have had will be starting to wane.
COVID-19 can still be very dangerous and even life threatening, particularly for older people and those with a weakened immune system.
Thankfully, for those who are more likely to become seriously ill from COVID-19, the NHS offers a free vaccine in the spring to top up their protection. This was previously known as the 'Spring Booster'.
The vaccine has saved countless lives, prevented thousands from needing to go to hospital and helped us to live with the virus without fear or restrictions.
UKHSA surveillance data relating to last spring's programme shows that those who received a vaccine were around 45% less likely to be admitted to hospital with COVID-19 from 2 weeks following vaccination, compared to those who remained unvaccinated.
Eligibility for the COVID-19 vaccination this springThe eligibility criteria is the same as for spring 2024, and similar to spring 2022 and spring 2023, with the addition of immunocompromised people in younger age groups:
- adults aged 75 years and over
- residents in a care home for older adults
- individuals aged 6 months and over who have a weakened immune system
The eligibility is the same across the 4 nations of the UK (England, Scotland, Wales and Northern Ireland).
Age-based criteriaThose who are aged 75 and over can come forward to top up their protection this spring. If you are 74 but turn 75 years old by 17 June 2025, you don't have to wait for your birthday to come forward.
Eligibility for residents and staff in care homesThose who are resident in care homes for older adults are also eligible. Carers and staff in care homes are not eligible, this is because the vaccination programme this spring is targeted towards providing protection to those most vulnerable to severe disease.
Those with a weakened immune systemWe understand that having a weakened immune system (immunosuppression) is a lot less straightforward than the other criteria. Looking online can cause even more confusion, as people might see themselves (and be considered by others) as immunosuppressed but might not fit the immunosuppression criteria for vaccination.
So, what are the immunosuppression criteria? Eligibility is outlined in Chapter 14a of the Green Book, a document published by UKHSA specifically for public health professionals. It can be a complicated document for non-experts, so we've listed some of the groups here:
- organ, bone marrow or stem cell transplant patients
- those being treated with systemic steroids for more than a month
- those living with HIV
- those receiving immunosuppressive or immunomodulating biological therapy, including children who are about to receive therapy
- those undergoing chemotherapy or radiotherapy
- those who require long-term treatment for immunosuppression
- those with a history of haematological malignancy including chronic leukaemia, lymphomas, and leukaemia
- those with genetic disorders affecting the immune system
While this list summarises some major groups, it does not cover everything. Please check online at nhs.uk/get-vaccine to see if you are eligible.
Booking the spring COVID-19 vaccineYou should come forward rather than waiting for the NHS to contact you this year. The National Booking System opens on 25 March to book appointments from 1 April: nhs.uk/bookcovid. If you or someone you know can't get online, book by calling 119 free of charge, where a translator is available if needed.
Getting your COVID-19 vaccine is very convenient, with thousands of appointments available across the country every day, usually at pharmacies and GP practices.
While having your spring vaccine around 6 months after your last dose is the usual timeframe, you can have it as soon as 3 months after a previous COVID-19 vaccine dose. If you are eligible, you can get protection from a spring COVID-19 vaccination even if you have not taken up a COVID-19 vaccine offer in the past. Most people do not need extra vaccinations to make up for any they have missed, but your doctor may advise a further dose if you have a severely weakened immune system.
It is important that everyone who is eligible takes up the offer this spring before the vaccination programme closes on 17 June 2025.

As we move into spring, protection from any earlier COVID-19 vaccination you may have had will be starting to wane. For those who are more likely to become seriously ill from COVID-19, the NHS offers a free vaccine in the spring to top up their protection, previously known as the 'Spring Booster'.
Current vaccines provide good protection against severe disease and hospitalisation. UKHSA surveillance data relating to last spring's programme shows that those who received a vaccine were around 50% less likely to be admitted to hospital with COVID-19 from 2 weeks following vaccination, compared to those who remained unvaccinated.
According to World Health Organization data, 400,000 lives in England are estimated to have been saved up to March 2023 due to the COVID-19 vaccine programme.
Are you eligible to top up your COVID-19 protection this spring?While you might have received your COVID-19 vaccine during winter or in past 'Spring Booster' campaigns, the criteria for this year's spring vaccine have changed slightly:
- Adults aged 75 years and over.
- Residents in a care home for older adults.
- Individuals aged 6 months and over who have a weakened immune system.
As you can see, the criteria are similar to the spring 2022 and spring 2023 booster campaigns, but this year the criteria for the immunosuppressed group has lowered to include those 6 months and over.
The eligibility is the same across the four nations of the UK (England, Scotland, Wales and Northern Ireland).
Let's explain the age-based criteriaThose who are aged 75 and over can come forward to top up their protection this spring. If you are 74 but turn 75 years old by 30 June 2024, you don't have to wait for your birthday to come forward.
What about residents, and staff in care homes?Those who are a resident in care homes for older adults are also eligible. Carers and staff in care homes are not eligible, this is because the spring vaccine is targeted towards providing protection to those most vulnerable to severe disease.
I have a weakened immune system, am I eligible this spring?We understand that having a weakened immune system (immunosuppression) is a lot less straight forward than the other criteria. Looking online can cause even more confusion, as people might see themselves (and be considered by others) as immunosuppressed but might not fit the immunosuppression criteria for vaccination.
So, what are the immunosuppression criteria? Eligibility is outlined in Chapter 14a of the Green Book, a document published by UKHSA specifically for public health professionals. It can be a complicated document for non-experts, so we've listed some of the groups here:
- Organ, bone marrow or stem cell transplant patients.
- Those being treated with systemic steroids for more than a month.
- Those living with HIV.
- Those receiving immunosuppressive or immunomodulating biological therapy, including children who are about to receive therapy.
- Those undergoing chemotherapy or radiotherapy.
- Those who require long-term treatment for immunosuppression
- Those with a history of haematological malignancy including chronic leukaemia, lymphomas, and leukaemia.
- Those with genetic disorders affecting the immune system.
While this list summarises some major groups, it does not cover everything. Please check online at nhs.uk/get-vaccine to see if you are eligible.
How do I get my spring COVID-19 vaccine?You should come forward rather than waiting for the NHS to contact you this year. You will be able to book your vaccine online at nhs.uk/get-vaccine from 15 April 2024. If you or someone you know can't get online, book by calling 119 free of charge, where a translator is available if needed.
While having your spring vaccine around 6 months after your last dose is the usual timeframe, you can have it as soon as 3 months after a previous COVID-19 vaccine dose. If you are eligible, you can get protection from a spring COVID-19 vaccination even if you have not taken up a COVID-19 vaccine offer in the past. Most people do not need extra vaccinations to make up for any they have missed, but your doctor may advise a further dose if you have a severely weakened immune system.
It is important that everyone who is eligible takes up the offer this spring before the vaccination programme closes on 30 June 2024.

With the emergence at the end of last year of COVID-19 variant JN.1, there are questions about how it compares to the many other variants that have been identified.
JN.1 descends from variant BA.2.86 and has an additional mutation in the spike protein. It has recently become the most widely circulating variant in the US as well as in France. As of January 2024, approximately 60% of English cases are caused by JN.1.
UKHSA is continuing to monitor data relating to variants both in the UK and internationally, including close monitoring of the JN.1 variant, and assessment of severity and vaccine effectiveness. There is no change to the wider public health advice at this time.
There are no reports of people becoming more ill with this COVID-19 variant than with previous ones.
It is important to note that we will need more data to draw any conclusions about the effect of these mutations on transmissibility and severity of the variant. In this blog post we'll outline what we know so far and what action we are taking.
It's normal for viruses to mutate and change, and more widely we're still getting to grips with how the healthcare system responds to the ebb and flow of seasonal cases. As more data becomes available on this variant, we'll have a better understanding of how it interacts with our immune systems and how to optimise our protection and as well as actions we can take to keep the most vulnerable safe and live our lives as normally as possible.
If people become unwell, and are unsure if they have COVID-19, what should they do?If you have symptoms of a respiratory infection, such as COVID-19, and you have a high temperature or do not feel well enough to go to work or carry out normal activities, you should avoid contact with vulnerable people and stay at home if possible.
For those of us who absolutely can't stay at home, our Living with COVID guidance is unchanged, and outlines how to prevent transmission to others.
Why should people come forward for their vaccine?Vaccines remain our best defence against severe disease and hospitalisation from flu and COVID-19. That's why we're asking over-65s, anyone in a clinical risk group, and anyone living in a household with someone who is in a clinical risk group, to come forward for their vaccination. Their protection since their last vaccination will have waned and they remain at increased risk from a respiratory infection this winter. It's also important to note that COVID-19 isn't a special case; respiratory infections can be unpredictable, and we're asking similar groups to get vaccinated against flu.
The last date that the seasonal COVID-19 vaccination will be available is 31 January 2024.
What surveillance systems are in place?We publish the latest surveillance data for COVID-19 and other respiratory illnesses weekly, to the UKHSA data dashboard. We're also getting vital data from those who are admitted to hospital with symptoms, and we are utilising genome sequencing to understand which variants people are most vulnerable to.
There are also specific surveillance programmes in place, where small sample groups are tested regularly. These allow us to monitor trends in the wider community.
Hospital is where we will see the more severe cases, and we will be monitoring the numbers of people attending with COVID-19 symptoms very carefully. This will help us understand the growth rate and transmission potential of the new variant.
We continue to collaborate globally with health organisations in other countries, the World Health Organisation and initiatives such as the Global Influenza Surveillance & Response System (GISAID) to ensure that we have the most current data.
What is the UKHSA doing to tackle the new variant?When a new variant appears on our radar, at the initial stages it is often quite difficult to know whether the mutations provide any advantages to the virus. Genetic mutations happen all the time, and in some cases have been known to make a virus less transmissible or cause a milder reaction in people.
At these early stages our scientists at the Vaccine Development and Evaluation Centre (VDEC) are busy growing a stock of the JN.1 variant in our high containment facilities, so that we can begin testing.
At the same time, scientists in our COVID-19 Vaccine Unit work hand in glove with vaccine developers to get samples of new, as yet unlicensed, vaccines to assess whether they will give better protection against the virus.
Vaccinations for flu and COVID-19 help to keep vulnerable people out of hospital and carrying on with their day-to-day lives, as well as reduce pressure on our NHS which is always critical in the winter. If you're eligible for the jabs, please don't hesitate, book your vaccine and get winter strong.

Flu and COVID-19 can be unpleasant for most people, but if you're pregnant, it's particularly important to get vaccinated to protect both you and your baby.
We recommend that all pregnant women get flu and COVID-19 vaccines in the coming weeks as part of the winter vaccination campaign, no matter what stage of pregnancy they're at. Both vaccinations are available free on the NHS as unvaccinated pregnant women and their babies are at higher risk of complications requiring hospitalisation than women who aren't pregnant.
Why is it crucial for pregnant women to get the jabs?Being pregnant changes the way your body handles infections and can restrict the depth of your breathing as the baby grows and pushes on your lungs. This can make you more vulnerable to severe complications from COVID-19 and flu, such as pneumonia. If you catch flu or COVID-19 during pregnancy, it can also cause your baby to be born prematurely or have a low birth weight and, if you get infection near to delivery, you can also pass it to your newborn baby.
Earlier in the pandemic, many serious cases of COVID-19 were seen in pregnant women often with serious consequences for their babies. Although disease is less likely to be serious with the Omicron variant, vaccination will protect you against getting severe disease in pregnancy and help keep your baby healthy.
Is it safe to have the flu and COVID-19 vaccines while pregnant?All vaccines go through a regulatory approval process to ensure they meet strict safety and effectiveness checks. And it's fine to have the jabs at any stage of pregnancy.
Millions of women in England have had the flu vaccine during pregnancy since this was introduced in 2011. COVID-19 vaccine has been given to millions of pregnant women worldwide with numerous studies, including those in the UK, showing reassuring safety for the mother and her baby. Flu and COVID-19 vaccines do not contain live virus and cannot infect your unborn baby.
Having a vaccine while pregnant passes on some immunity to your baby once they are born, protecting them during their first months of life. This is particularly important for flu as babies are at risk of hospitalisation if they catch it.
The safety record is good for breastfeeding mums too, if you're eligible due to an underlying health condition.
How do I get the flu and COVID-19 vaccines?The best time to get the jabs is in the autumn before infections circulate more widely. But don't worry if you find out that you're pregnant later on - you can have the flu vaccine right up until 31 March 2024. COVID vaccine is being offered between September and December 2023.
You can book your COVID-19 and flu vaccination appointment online, by downloading the NHS App or by calling 119 if you can't get online. You can also book your flu vaccine by finding a local pharmacy or through your GP practice and some maternity services.
And remember, you need the flu vaccine every year as flu viruses can change and the protection from the vaccine decreases with time. So even if you had it last year, it's important to get it again to get winter strong. You should also get a COVID-19 vaccine even if you have had one previously to increase your protection whilst you are pregnant. These vaccines provide essential protection for you and your little one.

As we brace ourselves for chillier days, more indoor gatherings and seasonal social events with friends and family, now is the ideal time to revisit the current guidance on face coverings, isolation, vaccination and other behaviours that can reduce the spread of COVID-19 and other respiratory infections known to peak during the autumn and winter period.
The recent emergence of COVID-19 variant BA 2.86 has led some people to ask if they should change their behaviour in response to this or any other new variant. However, there are currently no changes to the advice on what to do if you have, or think you may have COVID-19, influenza (flu) or any other respiratory infection.
The current guidance on living safely with respiratory infectionsThe guidance on Living Safely with respiratory infections including coronavirus (COVID-19) issued in April 2022, still applies.
It sets out a range of simple actions you can continue to take to reduce the spread of COVID-19 and other respiratory infections, and protect those at highest risk:
- Get vaccinated if you are eligible
- Let fresh air in if meeting others indoors
- Practise good hygiene:
- wash your hands with warm, soapy water
- cover your coughs and sneezes
- clean your surroundings frequently
- Consider wearing a face covering
If you have symptoms of a respiratory infection, such as COVID-19 or flu, and you have a high temperature or do not feel well enough to go to work or carry out normal activities, try to stay at home and avoid contact with other people, until you no longer have a high temperature (if you had one) or until you no longer feel unwell.
If you need to go out, then avoid close contact with anyone who you know is at higher risk of becoming seriously unwell. The full guidance on what to do if you have symptoms is available at: Guidance for Living Safely with respiratory infections including coronavirus (COVID-19).
Who can get free COVID-19 testsYou may be able to get free COVID-19 rapid lateral flow tests if you have a health condition which means you're eligible for COVID-19 treatments, or work in healthcare or in a hospice.
If you're not eligible, you can buy rapid lateral flow tests from some pharmacies and retailers, in person or online.
What to do if you test positive for COVID-19If you have a positive COVID-19 test result you should try to stay at home and avoid contact with other people for 5 days after the day you took your positive test, even if you have no symptoms.
You should avoid meeting people at higher risk of becoming seriously ill with COVID-19 for 10 days after the day you took your test. See the full guidance on what to do if you test positive for COVID-19.
Who is eligible for COVID-19 vaccinationThanks to the success of our vaccine programme, we have built a strong, broad immune defences against COVID-19 throughout the population. However, some people remain more vulnerable to severe illness from COVID-19, and vaccination will provide the best protection against severe infection this winter.
Those eligible for an autumn COVID-19 vaccine are:
- residents in a care home for older adults
- all adults aged 65 years and over
- people aged 6 months to 64 years in a clinical risk group, as laid out in the Immunisation Green Book, COVID-19 chapter
- frontline health and social care workers
- people aged 12 to 64 years who are household contacts (as defined in the Green Book) of people with immunosuppression
- people aged 16 to 64 years who are carers (as defined in the Green Book) and staff working in care homes for older adults.
All the vaccines advised for the 2023 autumn booster campaign are expected to be effective at preventing serious illness and hospitalisation from COVID-19. If you are offered a booster vaccination, or any other COVID-19 or Flu vaccinations, please accept the offer as soon as you are able to. It is important to have your vaccine to build up your protection against severe illness before the winter.
COVID-19 vaccine and pregnancyAll pregnant women are defined as part of a clinical risk group and are encouraged to get vaccinated to protect themselves and their unborn babies. Being pregnant changes how your body fights infections like COVID-19 and catching it while pregnant increases your risk and your baby's risk of complications which may result in hospitalisation.
The COVID-19 vaccine can be given safely to expectant mothers at any stage of pregnancy, even right from the start.
When to consider wearing a face coveringAlong with the other measures set out in the Living with COVID-19 guidance, face coverings continue to be a useful tool in limiting the spread of COVID-19 and other respiratory viruses in some situations.
As existing guidance states, wearing a well-fitting face covering when unwell can reduce the number of particles containing viruses that are released from the mouth and nose of someone who is infected with COVID-19 and other respiratory infections. This is standard respiratory health advice and guidance on face coverings has not changed since it was published in April 2022.
Face coverings can also protect the person wearing them from becoming infected with other respiratory viruses.
There is further information on when people with symptoms of a respiratory infection or a positive COVID-19 test result should consider wearing a face covering available in the guidance for people with symptoms of a respiratory infection or a positive test result.
What to do if your child is unwellCurrent guidelines for parents state that it's fine to send your child to school with a minor cough or common cold. However, children should not be sent to school if they have a temperature of 38°C or above, or if they feel unable to go to school or do their normal activities. See the NHS 'Is my child too ill for school?' guidance for further information.
There is wide agreement among health and educational professionals that school attendance is vital to the life chances of children and young people. Being in school regularly improves mental and physical health, wellbeing and socialisation throughout children's lives.
This year, children and young people up to year 11 are being offered the flu vaccination nasal spray at their school or college: parents should look out for the electronic or paper consent form and be sure to return it when asked to do so.
If you have a child aged 2 or 3 years on 31 August 2023 (born between 1 September 2019 and 31 August 2021), you can book a flu vaccine at your GP Practice. Find out more at the NHS website.
See our 'back to school' post for more information and advice on keeping children healthy when they return to the classroom.
By all doing our bit to prevent transmission, we can help our families and communities get winter strong.

In November 2022 the SARS-CoV2 Immunity and Reinfection Evaluation study, or SIREN for short, expanded to study flu and Respiratory Syncytial Virus (RSV).
The COVID-19 pandemic provided a masterclass in how to rapidly build understanding of a virus - with new studies rolled out, unprecedented levels of data collected, and scores of dedicated researchers tasked with translating this data into answers about the virus.
What is SIREN?SIREN is a nationwide study involving over 44,000 healthcare workers at 135 NHS organisations. The SIREN study was established early in the COVID-19 pandemic, and we have been following participants for over two years now - collecting regular PCR swabs and blood samples from an incredibly dedicated cohort of NHS workers who volunteer their time.
Flu, or influenza, is a highly infectious respiratory virus. In the UK the flu season runs from around October to March, with most cases occurring between December and February.
Each year flu is a major area of focus for healthcare workers and researchers aiming to protect the UK population. This includes the development and rollout of a vaccine, providing a seasonal information campaign on the virus, and treating those who become really unwell.
We saw reduced flu transmission resulting in lower flu levels during the COVID-19 pandemic, thanks to social distancing measures and widespread use of face coverings. The relaxing of these measures means that flu is circulating at higher levels, increasing the burden on healthcare settings.
SIREN will also investigate the impact of RSV infection on healthcare workers as part of this expansion. Like the flu, RSV is a highly infectious respiratory virus, and accounts for over half a million GP appointments and over 40,000 hospitalisations a year, largely affecting young children and the elderly.
Gaps in our knowledgeThis has been a difficult winter for the NHS and we know that flu puts a strain on the system each year. Learning more about the burden of flu and other respiratory viruses on both the NHS and wider population is important. We do not currently have accurate estimates of the levels of flu circulating among healthcare workers.
One reason for this is that we do not know how many people have flu without experiencing symptoms. In addition, we do not yet understand how flu interacts with COVID-19 and what impact this may have. This is particularly important now that we have moved into a phase in the pandemic where protection measures have reduced, and flu and COVID-19 are circulating at the same time.
Knowing more about flu, along with RSV and COVID-19, could help hospitals and policy makers plan effectively for future winters. It is crucial to understand the extent of the burden respiratory viruses place on healthcare workers so that employers can look after the health and wellbeing of staff, which is important in its own right and the foundation of high-quality patient care.
How is the SIREN study looking to fill these knowledge gapsAnalysis of SIREN samples has helped the UK to evaluate the immune response to COVID-19, provided insight into COVID-19 reinfections and has helped us to build an understanding of the level of protection offered by vaccines. SIREN has helped answer some of the most pressing questions about COVID-19, enabling decision-makers - both national and locally - to control the spread of the disease.
SIREN is now turning its attentions to flu and RSV as well as COVID-19. SIREN is uniquely placed to study the impact of additional respiratory viruses - making the most of the samples provided by our fantastic cohort, the data systems we have built and the research collaborations across the UK we have forged, to help answer the most pressing questions.
Some of the key questions we hope to answer are:
- What are the levels of flu in healthcare staff?
- How many people with flu have no symptoms?
- How effective is the influenza vaccination against infection?
- What symptoms do participants experience during respiratory infections?
- How many sick days do respiratory viruses cause in healthcare workers?
We would like to thank the NHS organisations, research teams and lab staff across the UK who have made the SIREN Flu and Winter Pressures sub-study possible, in addition to each and every NHS staff member participating - we could not do this without you.
The SIREN Flu and Winter Pressures sub-study is funded by UKHSA with support from Public Health Scotland, Public Health Wales and the Public Health Agency Northern Ireland. We are pleased to share that the sub-study has also recently been awarded grant funding by Health Data Research UK (HDR UK). SIREN is one of 16 research studies chosen to examine how winter pressures faced by the NHS can be eased.
You can find more information about the SIREN study here.
Dry air indoors can cause an inflammatory reaction, yet so can cold, windy outdoor conditions - but turning down the heating and using a moisturising cream can help
'This is kind of true," says consultant dermatologist Dr Emma Craythorne. Human skin has evolved to retain water, thanks to a protective barrier on its surface. But that barrier isn't totally watertight. Water is constantly moving across it, depending on the humidity of the surrounding air.
Skin tends to be most comfortable at a relative humidity of about 40%. When the air around us is drier than that, water is more likely to leave the skin. That matters because the process of water escaping across the skin barrier is mildly inflammatory.
Continue reading...The hit podcaster, author and former GP says a failure to regulate big tech is 'failing a generation of children'. He explains why he quit the NHS and why he wants a ban on screen-based homework
A 16-year-old boy and his mum went to see their GP, Dr Rangan Chatterjee, on a busy Monday afternoon. That weekend, the boy had been at A&E after an attempt at self-harm, and in his notes the hospital doctor had recommended the teenager be prescribed antidepressants. "I thought: 'Wait a minute, I can't just start a 16-year-old on antidepressants,'" says Chatterjee. He wanted to understand what was going on in the boy's life.
They talked for a while, and Chatterjee asked him about his screen use, which turned out to be high. "I said: 'I think your screen use, particularly in the evenings, might be impacting your mental wellbeing.'" Chatterjee helped the boy and his mother set up a routine where digital devices and social media went off an hour before bed, gradually extending the screen-free period over six weeks. After two months, he says the boy stopped needing to see him. A few months after that, his mother wrote Chatterjee a note to say her son had been transformed - he was engaging with his friends and trying new activities. He was, she said, like a different boy from the one who had ended up in hospital.
Continue reading...The long-running series in which readers answer other readers' questions ponders how to overcome fear and do what is needed
This week's question: what would be the most socially useful way to spend a billion dollars?
Is it possible to acquire courage if you don't have it? I was moved by the recent story of the Australian boy who swam to land for several hours in rough waters to raise the alarm that his mother and siblings had been swept out to sea. Despite his exhaustion, he then ran several kilometres to find a phone.
But I'm also thinking of the lesser demands for courage - such as standing up to a friend, or family member, or tackling a company that's ignoring your polite requests when you're suffering from its actions. Or I also wonder how people do certain jobs that, to me, require buckets of courage: starting a business or any other sort of professional risk-taking; reporting from a war zone like Lyse Doucet or Jeremy Bowen. Or just being a police officer knocking on the door of a suspect and not knowing what is on the other side.
Continue reading...He didn't look like a stereotypical 'drug addict', but when he fled to South Africa with all our savings it was obvious that is what he had become
When I tell people that a drug addiction nearly killed my dad, I know what most of them are thinking. Heroin. Crack. Maybe meth or ket. Those substances that steal your soul and slowly wreak havoc on your body. They're imagining Trainspotting; too-skinny frames and protruding hip bones, the physical effects of addiction that are impossible to miss.
But that isn't how it played out in my family.
Continue reading...Does it only affect weak people? Is work always the cause? Burnout myths, busted by the experts
Once, after surviving yet another round of redundancies in a former job, I did something very odd. I turned off the lights in my room and lay face-down on the bed, unable to move. Rather than feeling relief at having escaped the axe, I was exhausted and numb. I'm not the only one. Fatigue, apathy and hopelessness are all textbook signs of burnout, a bleak phenomenon that has come to define many of our working lives. In 2025, a report from Moodle found that 66% of US workers had experienced some kind of burnout, while a Mental Health UK survey found that one in three adults came under high levels of pressure or stress in the previous year. Despite the prevalence of burnout, plenty of misconceptions around it persist. "Everybody thinks it's some sort of disease or medical condition," says Christina Maslach, the psychology professor who was the first to study the syndrome in the 1970s. "But it's actually a response to chronic job stressors - a stress response." Here we separate the facts from the myths.
Continue reading...It's possible this is a platonic relationship, but your concerns are valid and your husband isn't providing any reassurance
My husband and I are in our 60s. We have been married for 40 years, some of it happily, some not so much. Our children are grown up and gone, and we have recently retired. Some of our tensions over the years have been around my husband's tendency to be undermining and belittling. He claims not to understand why I might find certain things upsetting, yet refuses to engage with couples counselling (apparently I would tell lies). We have muddled through and mostly get on well now, though he dislikes most of my friends and siblings, and won't socialise with them. To be fair, he is self-contained and doesn't seem to need friends in the way I do - he has one friend.
A few months ago, an ex-colleague got in touch with my husband and asked to meet for coffee. They met, had a long lunch, and my husband mentioned a few weeks later that they were arranging to meet again as he had enjoyed the catchup. I was a bit thrown. I found it odd that she couldn't confide in her partner or friends, but my husband exploded and we had one of our worst, most vicious arguments in years. He accused me of not wanting him to have friends (the opposite is true) and threw up the fact that I have platonic male friends; true, but my male friends and I go back 30-plus years and we don't meet one-to-one. This just feels a bit out of character and potentially inappropriate.
Continue reading...The Guardian's sex advice column is coming to an end after 20 years. Here are some of the most memorable questions and answers
• Pamela Stephenson Connolly on two decades of solving readers' sex problems
My wonderful new wife is everything I have always looked for in a woman. The issue is that she is openly and proudly bisexual. When we first became involved, she even joked that she didn't want me getting mad when it was time for her to visit her friend on girls' trips. A threesome with a bisexual woman has always been my fantasy. She even gave me permission to go online and find a "unicorn" for us. But when I set up a meeting, she didn't seem to want to follow through with it, so I stopped looking. Recently, on holiday, she made a sexual comment about a girl in a bikini, so I again brought up the idea of a threesome. But she said she might have grown out of that phase of her life and just wants to be with me. She also said that adding another person would ruin the marriage, and I worry that things might change between us if we get together with another girl. I am at a loss as to what to do. If she is truly bisexual, I am worried that if those desires are not met, she may pursue them without me. My only rule is that if she is with a girl, I am also present. Most guys would love my situation - am I making this harder than it is?
Continue reading...Its 'fibre checker' tool confirmed I could have a connection, but a month later it changed its mind
My internet provider informed me by email that full fibre broadband had become available for my property, confirmed by Openreach's "fibre checker" tool.
After a month, Openreach declared the connection uneconomical due to blockages in the conduits below the road.
Continue reading...It can feel overwhelming, writes advice columnist Eleanor Gordon-Smith. But ask yourself what sacrifices make the biggest proportionate impact
Read more Leading questions
I'm finding it difficult living up to my morals - where is the line between compromising a little, versus becoming complicit in what I don't agree with?
I'm one of those people who believes we can each take a role in solving big problems, and that we should try to make things better where we can. For this reason, I've ended up working in public service and try to reduce how much meat I eat. I'm vegetarian 60% of the time, which is not perfect, but I believe doing something is better than doing nothing.
Continue reading...They offer independence, reduce emissions and congestion. But they are also endangering lives
Get our breaking news email, free app or daily news podcast
After the Sydney Harbour Bridge was swarmed by 40 or so ebikes and e-motorcycles on Wednesday, the Australian government said the country faced a "real emergency".
"[Illegal ebikes] are a total menace on the road," the health minister, Mark Butler, said on Friday.
Continue reading...Experts say souped-up e-bikes pose big risk for children aged from 12 to 15, who account for many A&E cases
On a busy lunchtime, thick-tyred electric bikes zoom through the leafy lanes of the Vondelpark in Amsterdam. But after a marked rise in accidents - particularly involving children - these vehicles the Dutch call "fatbikes" are to be banned in some parts of the Netherlands.
"It's nonsense!" said Henk Hendrik Wolthers, 69, from the saddle of his wide-tyred, electric Mate bike. "I drive a car, I ride a motorbike, I've had a moped and now I ride a fatbike. This is the quickest means of transport in the city and you should be able to use it."
Continue reading...In 2021, Harold Price, now 82, broke a vertebra while on a motorbike, leaving him barely able to use his legs. Then a chance recommendation changed his life
Before the accident, Harold Price, 82, loved being on two wheels. A retired engineer from Griffithstown in Wales, he cycled about 95 miles a week on his road bike. "Not bad for 78," he says. On other days he'd be out on one of his restored motorbikes, as he was in June 2021, with a friend. They were riding at 10 miles an hour on a narrow road when his friend pulled out in front of him. "I had nowhere to go," Price says. He remembers his head snapping back into his helmet before he blacked out.
Price spent months in hospital. He had broken the fifth vertebra in his neck, resulting in compression of his spinal cord. He was told he wouldn't walk again. "That was a bit of a downer, obviously," he says. He was determined to prove the doctors wrong. "My mind told me I could get up and walk out. But when I tried, I collapsed."
Continue reading...Our fitness expert clocked up his indoor miles to put the best exercise bikes, including simple spin machines and gym-quality models, to the test
• The best treadmills for your home, tested
Cycling has the potential to benefit your health in myriad ways, whether it's the mood-boosting properties of inhaling fresh air, the social element of riding with friends or the simple act of improving cardiovascular fitness with every pedal stroke.
The UK weather doesn't always play ball, though, so for those who don't want a dire forecast to result in a missed workout, indoor training replicates the exercise (if not the fresh air).
Best exercise bike overall:
Peloton Bike+
Best budget exercise bike for beginners:
Horizon 3.0SC indoor cycle
Figuring out how to diagnose and fix a problem myself generated a sense of satisfaction powerful enough to get me up a medium-sized hill
It wasn't until Covid lockdowns that I became a regular bike rider, but it has become one of the joys of my life. Nothing melts away a stressful day like whizzing down a hill; not having to think about petrol prices, one-way streets or parking spots does wonders for my mood.
When it came to maintenance, though, my attitude was decidedly timid. If something worked, that was good enough for me - how it did so was simply none of my business. Strange noises and glitches were things I figured would either go away on their own or deteriorate into something I'd hand off to an expert. I'm not proud to admit I've walked my bike half an hour to a bike shop to fix a puncture more than once; my chain was perpetually caked in gunk because I thought even looking at it the wrong way might break something.
Continue reading...With no plans, I set off from John O'Groats to travel down south to Dover. Friends and family didn't think I'd last a mile
Since coming to England from Ethiopia eight years ago, I've lost parts of my cultural identity. I was stuck in a monotonous, isolated routine studying for a biochemistry degree at Imperial College London, without the family-centred lifestyle I was used to. Back in Ethiopia, I'd be surrounded by my aunt, grandparents, friends.
So this year, I took 12 months out and moved to my uncle's house in Leeds. The change helped me try new things, like cycling: as a child, I had never ridden a bike. I bought one in a charity shop. My friends told me that it was made for a 10-year-old and donated an adult-sized bike to me.
Continue reading...Emulating the bike-friendly highways enjoyed by our continental neighbours will take a lot more money and political will
Ever since Team GB's velodrome successes at the 2008 Olympics, campaigners and government ministers have confidently predicted that Britain is about to become a nation of cyclists. There is just one problem: for the most part, it has not happened.
Apart from a very concentrated spike in bike use during Covid, the level of cycle trips in England has stayed broadly static for years, and things do not appear to be changing.
Continue reading...Wondering what to get the nature lover in your life? Our outdoor enthusiast curates the must-haves: Loop earplugs, Yeti Rambler and more
The 163 best holiday gift ideas for 2025, vetted by the Guardian US staff
Sign up for the Filter US newsletter, your weekly guide to buying fewer, better things
Whether you know someone who camps every weekend or just enjoys morning coffee outside, you already know: outdoorsy people can be particular about their gear. They want to stay both comfortable and safe in the elements - a reliable water bottle means no spills in the pack and a good headlamp keeps them on the trail and not in a ravine.
Outdoor gear can be intimidating and expensive, but I've pulled together a list of affordable yet reliable things that I've personally used as an outdoors lover. (I have also gifted many of these to family members who now use them often.) These are things I've dragged through mud, shoved into carry-ons and relied on when the weather turned. Whether your person camps, hikes, fishes or bikes, here are durable and practical gifts that make being outside easier and more fun.
Our favorite gifts for teens and tweens
The best gifts for the person who has everything
Unique gifts from indie businesses that beat predictable big brands
Continue reading...