Today, the world is filled with conflict. Part of the problem is oil limits, but there are many other issues as well:
- Resources such as coal, lithium, and copper are also becoming more expensive to extract.
- Fresh water is often inadequate for the world’s rising population.
- Debt levels are very high.
- Complexity is very high.
- An adequate standard of living is becoming unaffordable for many people.
- The increasing world population leads to a need for more food and more paved roads.
These symptoms strongly suggest that the world economy is headed for a slow-motion collapse.
 Figure 1. Overall pattern of today’s predicament, in an image by Gail Tverberg. We seem to be up near the top now.
The system causing the problem is physics-based. Without enough affordable energy of the right types, the economy tends to collapse. This is the predicament we are facing today.
What should ordinary citizens do? I am not certain that there is one correct answer, or that I know it. In this post, I would like to offer some suggestions for discussion.
[1] Every day, give thanks for the many things you do have.We are at the peak of resources per capita. This means that, as a group, we have as many goods and services as any population that has ever lived. We also have lots of natural resources remaining. We have a huge amount of complexity, with many young people receiving university degrees.
It is easy to lose sight of how much we do have. Most readers of this blog eat a variety of food in the quantities desired. We live in homes that are heated in winter. Even today, many people around the world are not as fortunate as we are.
[2] To the extent possible, stay away from conflict yourself.The physics of the system will create conflict because the system must change if there is no longer enough oil to ship huge amounts of goods and services across the Atlantic or Pacific Oceans. Perhaps a few highly valued goods and services can be shipped long distance, but patterns must change to put the production of goods and services closer to the consumption of goods and services. This is a major reason why countries are quarreling now.
There is no point in individuals strongly objecting to cutbacks in trade because today’s lack of oil supply is demanding these cuts. The only way one country can lessen the impact of the reduced oil supply is to push the reduction in indirect oil consumption onto another country, using quotas or tariffs on its imports of goods and services. Needless to say, pushing other countries down to benefit one’s own country is likely to create conflict.
Another issue is that with reduced oil and other energy supplies, governments cannot continue to provide as many services as they have in the recent past. They need to reduce the number of government workers in many departments. This is the reason for the many cutbacks by the US Department of Government Efficiency and similar cuts in other countries. It also means that benefit programs, such as those aimed at seniors, the disabled, or hurricane relief, will need to be reduced or eliminated in the future.
We can argue about which programs should be cut back first, but ultimately, all government programs will need to be cut back substantially. Just printing money to try to solve the problem will likely lead to inflation; money doesn’t solve the physics problem we are facing. Energy products of the right kinds are needed for every part of GDP; not having sufficient oil is likely to cut back the supply of goods produced using oil products, including food.
If you get involved in protests, or even in war, you will be putting yourself in harm’s way. And, in the long run, you are unlikely to gain significant benefits personally.
[3] Expect declining complexity in the future.There are many aspects to complexity:
- Much international trade
- Much debt
- Businesses with multiple layers
- Governments providing a wide range of services, including pension plans and health care
- Energy efficient vehicles
- Appliances that are designed to save energy
- Healthcare with many specialized physicians and high-cost drugs
- Agriculture with many hybrid seeds, herbicides, insecticides, and soil amendments
All these types of complexity will need to be scaled back in the future, but we don’t know precisely to what extent or how rapidly. We cannot go back to old solutions because these won’t necessarily be available. For example, we know from the past that if an economy no longer operates with horses and carriages, it will no longer make buggy whips.
We need to expect a rapidly changing world. Complex appliances we own will fail, and we will not be able to obtain replacement parts. Many drugs imported from Asia will no longer be available. Homes purchased with debt will be affordable by fewer and fewer people. We need to be aware of these issues and change our expectations accordingly.
[4] Expect fewer goods and services to be available in the future, and money to have less value.We are no longer moving to an ever-better world; we are moving (at least for a few years, perhaps much longer) to a shrinking world economy. Do not be surprised if home values drop and stock market values fall.
Saving money for the future makes less and less sense because fewer goods and services will be available to buy in the future. Even saving gold will not necessarily work around the problem of there being fewer goods to buy. For example, farmers and others involved in producing food will likely get food before others, to assure the continued production of food. This will leave less food for others to buy.
Electricity is likely to become intermittent in the years ahead. It would seem wise to stay away from purchasing condominiums that can only be accessed by elevators.
[5] Focus on the present, not the past or the future.In our current world, great stress is placed on planning for the future. For example, workers are encouraged to save for retirement, and young people are encouraged to take courses that will allow them to work in a well-paying occupation for the long term. This plan assumes that that the upward trend we have seen in the past will continue. We also expect that governments will be able to make good on their promises.
But we really cannot expect this pattern to continue for the long term. The best we can hope for is that what we have right now will continue. If a family member is lost, the remaining members will need to pick themselves as quickly as possible and continue as best they can. This is one reason an extended family is helpful in Africa. Such an approach will increasingly be helpful elsewhere.
Fossil fuels have made retirement possible. As fossil fuel availability declines, retirement is less likely to be available. Everyone will need to work as long as they are physically available. Thus, saving for retirement becomes a less useful goal.
[6] Living in groups, particularly family groups, will increasingly make sense.When things were going well, and wages of most educated people were high, it made sense for many people to live by themselves. If they had an argument with their spouse, picking up and leaving might sound like a sensible idea. The job of each spouse would be sufficient to pay for housing for each separately.
As the economy goes downhill, people will need to live in more compact housing in order to save on heating and transportation expenses. Multiple generations will increasingly need to live together. In the case of singles, they will increasingly need to band together. Government programs will likely not be sufficient to provide separate living arrangements for a mother with children or for elderly individuals in care homes.
[7] Young people should not go into debt for higher education.At this point, the US has educated far too many people with college degrees (and beyond) relative to the number the economy can afford to hire. With declining complexity, adding more college-educated workers to the pool makes little sense.
A better choice for most young people is a short course or certificate program leading to a useful skill, such as appliance repair or becoming a licensed practical nurse. Apprentice programs may also make sense.
If families are wealthy enough to pay for their children’s education, a few people with advanced degrees will probably be needed. There may be some solutions to today’s problems that can be tackled by these individuals.
[8] People will need to be more flexible in their career choices.As the economy changes, job availability will change. Demand for workers in many of today’s high-paying careers will likely decline. For example, fewer specialty physicians will be needed. There will also be a need for fewer college professors, fewer stock market analysts, and fewer computer programmers.
The most immediate new jobs will involve the demolition of infrastructure that is no longer needed, such as movie theaters, shopping malls, office buildings, and many homes. Some materials will likely be saved for reuse elsewhere. This may involve heavy labor. Smaller, more local stores or open-air markets may open. Jobs previously held by immigrants picking vegetables and fruit will also be available.
How does a person step down from a high-paid desk job to a low-paid manual labor job? I don’t know. But, somehow, we need to be thinking through this issue.
[9] People should focus on taking care of their own health through healthy eating and adequate exercise.I expect the healthcare industry will be forced to change. One part of the problem will be fewer imported drugs and medical devices; another will be that most people will be less wealthy. They will not be able to afford the enormous costs of today’s bloated US healthcare system. Somehow, the system will need to shrink back.
Fortunately, there is a way that people can become healthier, despite lower spending. People can cook their own food, instead of buying over-processed food available from grocery stores and restaurants. They can eat less meat than the average American eats, and they can stay away from sugary soft drinks. They can exercise more. Part of this exercise can take place by walking to more local markets.
[10] Planting a modest garden, as far as this is possible, is probably a good idea.Most people do not have sufficient land to plant very much in the way of food crops. In fact, a large share of my readers probably lives in apartment buildings. And most young people, attempting to live on their own, will not have space to grow food crops. The cost of buying land is likely to be high, and property taxes will need to be paid.
If space is available on property that is already owned, fruit trees that grow and bear fruit without the need for pesticide spraying are a good choice. These trees will likely take several years to get started. Potatoes are another reasonable choice, as are vegetables in general.
It is not clear to me that people who set out to operate a self-sufficient farm will have much success. They require a complex infrastructure to support them. Such farms are very vulnerable to robbers and generally don’t have good backup plans if something goes wrong, such as the farmer becoming injured. I wish these individuals success in their endeavors, but I am not optimistic that these farms will succeed beyond their first major setback. We need a bridge to sustainable agriculture, but it is hard for me to see one right now.
[11] Concluding Observation: Why standing back from conflict is a suitable approach.Most people have a completely mistaken idea regarding what oil limits will look like. They assume that oil limits will lead to very high prices or long lines at gasoline stations. They fail to appreciate that oil limits will arrive at the same time as many other limits, including affordability limits. They also fail to understand that prices that are too low for producers will bring down oil production quickly. In fact, too low oil prices, rather than too high, are the issue the world is facing today.
What oil limits really lead to is lots of conflict: among nations, among political parties, among people who feel that it is unfair that they have spent a lot of money on an advanced education but cannot find a job that pays well enough to repay their education-related debt with interest. As limits of many kinds mentioned in the beginning of this post are hit, today’s economy will need to greatly shrink back in size. Many governmental structures that we expect today, including the EU, the World Bank, and the UN, may disappear.
We don’t know precisely what is ahead over the longer term. Some people believe a religious ending is likely. Other people think that some of the research that is currently underway may eventually lead to a solution. Still others are concerned that some parts of the world will need to shrink back to a very low level, perhaps similar to hunter-gathering, before these economies can grow again.
Regardless of how things play out, it is the physics of the self-organizing system that determines what happens next. No matter how offended we as individuals may feel regarding what some political party or politician has done or has not done, individuals are not able to fix the system, except to the extent that available inexpensive energy supply allows such a fix. This is why standing back from whatever conflict is taking place seems to me to be a suitable strategy.
I predict that the world economy will shrink in the next 10 years. I think that this is bound to happen because of energy and debt limits the world economy is hitting. There are a variety of other factors involved, as well.
In this post, I will try to describe the physics-based limits that the economy is facing, related to diminishing returns of many kinds. The problem we are facing has sometimes been called “limits to growth,” or “overshoot and collapse.” Such changes tend to lead to a loss of “complexity.” They are part of the way economies evolve. I would also like to share some ideas on the changes that are likely to occur over the coming decade.
[1] The world economy is a tightly integrated physics-based system, which is experiencing diminishing returns in far more areas than just oil supply.When extraction of a mineral takes place, usually the easiest (and cheapest) portion of the mineral deposit is extracted first. After the most productive portion is removed, the cost of extraction gradually increases. This process is described as “diminishing returns.” Generally, more energy is required to extract lower quality ores.
The economy is now reaching diminishing returns in many ways. All kinds of resources are affected, including fossil fuels, uranium, fresh water, copper, lithium, titanium, and other minerals. Even farmland is affected because with higher population, more food is required from a similar amount of arable land. Additional-cost efforts such as irrigation can increase food supply from available arable land.
The basic problem is two-fold: rising population takes place while the easiest to extract resources are depleting. The result seems to be Limits to Growth, as modeled in the 1972 book, “The Limits to Growth.” Academic research shows that problems such as those modeled (sometimes referred to as “overshoot and collapse”) have been extremely common throughout history.
Precisely how this problem unfolds varies according to the specifics of each situation. Growing debt levels and increasing wage disparity are common symptoms before collapse. Governments become vulnerable to losses in war and to being overthrown from within. Epidemics tend to spread easily because high wage disparity leads to poor nutrition for many low-wage workers. Dr. Joseph Tainter, in his book, “The Collapse of Complex Societies,” describes the situation as the loss of complexity, as a society no longer has the ability to support some of the programs it previously was able to support.
At the same time the existing economy is failing, the beginnings of new economies can be expected to start. In some sense, economies “evolve,” just as plants and animals evolve. New economies will eventually replace existing ones. These changes are a necessary part of evolution, caused by the physics of the biosphere.
In physics terms, economies are dissipative structures, just as plants, animals, and hurricanes are dissipative structures. All dissipative structures require energy supplies of some type(s) to grow and remain away from a dead state. These structures do not “live” endlessly. Instead, they come to an end and are often replaced by new, slightly different, dissipative structures.
[2] Over the next 10 years, the general direction of the economy will be toward contraction, rather than growth.There are many indications that the world economy is hitting a turning point because of rising population and diminishing returns with respect to resource extraction. For example:
[a] Debt levels are very high in the US and other countries. A rising debt level can temporarily be used to pull an economy forward without adequate energy supplies because it indirectly gives workers and businesses more spendable income. This income can be used to work around the lack of inexpensive energy products of the preferred types in a variety of different ways:
- It can allow consumers to afford a higher price for existing energy products, if the additional funds get back to customers as higher incomes or lower taxes.
- It can allow businesses to find more efficient ways of using resources, such as ramping up international trade or building more efficient vehicles.
- It can allow the development of new energy products, such as nuclear power generation and electricity from wind and solar.
What we are finding now is that these new approaches tend to encounter bottlenecks of their own. For example, oil supply is sufficiently constrained that the current level of international trade no longer seems to be feasible. Also, wind and solar don’t directly replace oil; electricity based on wind turbines and solar panels can lead to blackouts. Furthermore, diminishing returns with respect to oil and other resources tends to get worse over time, leading to a need for ever more workarounds.
If at some point, extraction becomes more constrained and workarounds fail to provide adequate relief, added debt will lead to inflation rather than to hoped-for economic growth. Higher inflation is the issue that many advanced economies have been struggling with recently. This is an indication that the world has hit limits to growth.
[b] Because of low oil prices, companies are deciding to cut back new investments in extracting oil from shale, and likely elsewhere.
 Figure 1. Brent equivalent oil prices, in 2024 US dollars, based on a combination of indications through 2023. Sources include historical oil prices in 2023$ from the 2024 Statistical Review of World Energy, published by the Energy Institute; the increase in average Brent spot price from 2023 to 2024, published by the US EIA; and the US Consumer Price Index for Urban consumers.
Figure 1 shows that oil prices rise and fall; they don’t rise endlessly. They rose after US oil production hit its first limits in 1970, but this was worked around by ramping up oil production elsewhere. Prices rose in the 2003 to 2008 period and then fell temporarily due to recession. They returned to a higher level in 2011 to 2013, but they have settled at a lower level since then.
One factor in the price decline since 2013 has been the production of US shale oil, adding to world oil supply. Another factor has been growing wage disparity, as workers from rich countries have indirectly begun to compete with workers from low-wage countries for many types of jobs. Low-wage workers cannot afford cars, motorcycles, or long-distance vacations, and this affordability issue is holding down oil demand.
US oil production from shale is in danger of collapsing during the next few years because prices are low, making new investment unprofitable for many producers. In fact, current prices for oil from shale are lower than shown on Figure 1, partly because US prices are a little lower than Brent, and partly because prices have fallen further in 2025. The recent price available for US WTI oil is only about $62 per barrel.
[c] World per capita coal production has fallen since 2014. A recent problem has been low prices.
 Figure 2. World coal production through 2023 based on data of the 2024 Statistical Review of World Energy, published by the Energy Institute.
Transportation costs are a major factor in the delivered price of coal. The reduced production of coal is at least partly the result of coal mines near population centers getting mined out, and the high cost of transporting coal from more distant mines. Today’s coal prices do not seem to be high enough to accommodate the higher costs relating to diminishing returns.
[d] In theory, added debt could be used to prop up oil and coal prices, but debt levels are already very high.
Besides the problem with inflation, mentioned in point [a], there are problems with debt levels becoming unmanageably high.
 Figure 3. Figure from page 10 of The Long-Term Budget Outlook 2025 to 2055, published in March 2025 by the US Congressional Budget Office.
Figure 3 shows US government debt as a ratio to GDP. If we look at the period since 2008, there was an especially large increase in debt at the time of the 2007-2009 Financial Crisis and the 2020 Pandemic. The debt level has become so high that interest on the debt is likely to require tax revenue to rise endlessly. The underlying problem is needing to pay interest on the huge amount of outstanding debt.
Putting together [a], [b], [c], and [d], the world has a huge problem. As the world economy is currently organized, it is heavily dependent on both oil and coal. Oil is heavily used in agriculture and in transportation of all kinds (cars, trucks, trains, airplanes, and ships). Coal is especially used in steel and concrete making, and in metal refining. We don’t have direct replacements for coal and oil for these uses. Wind and solar are terribly deficient at their current state of development.
The laws of physics tell us that, given the world’s current infrastructure, a reduction in the availability of both crude oil and coal will lead to cutbacks in the production of many kinds of goods and services around the world. Thus, we should expect that GDP will contract, perhaps for a long period, until workarounds for our difficulties can be developed. Today’s wind turbines and solar panels cannot solve the problem for many reasons, one of which is that fact that production and transport of these devices is dependent upon coal and oil supplies.
Thus, without adequate oil and coal to meet the needs of the world’s growing population, the world economy is being forced to gradually contract.
[3] Overall living standards can be expected to fall rather than rise during the next decade.A recent article in the Economist shows the following chart, based on an analysis by the United Nations:
 Figure 4. Chart showing global average “Human Development Index,” as calculated by the United Nations, in the Economist.
Figure 4 shows the trend in the Human Development Index as level in 2023-24. I expect that the trend will gradually shift downward in 2024-2025 and beyond. Modern advances, such as the availability of potable water in homes and the availability of electricity 24 hours per day, will become increasingly less common.
The Economist article displaying Figure 4 notes that, so far, most of the drop in living standards has happened in the poorer countries of the world. These countries were hit harder by Covid restrictions than rich countries. For example, the drop in tourism had a greater impact on less advanced countries than on rich countries. Poor countries were also affected by a decline in export orders for luxury clothing.
Outside of poor countries, young people are already finding it difficult to find jobs that pay well. They are often burdened with debt relating to advanced education, making it difficult for them to have the same standard of living that their parents had. This trend is likely to start hitting older citizens, as well. Jobs will be available, but they won’t pay well. This problem will affect both young and old.
[4] Governments will be especially vulnerable to cutbacks.History shows that when overshoot and collapse occur, governments are likely to experience severe difficulties, indirectly because many of their citizens are getting poorer. They require more government programs, but if wages tend to be low, the taxes they pay tend to be low, too.
Unfortunately, the kinds of cutbacks being undertaken by the Department of Government Efficiency (DOGE) are very much necessary to get payments by the US government down to a level that can be supported by taxes. Regardless of how successful the current DOGE program is, I expect a huge reduction in the number of individuals on the payroll of the US government, perhaps by 50% to 75%, in the next 10 years. I also expect major cutbacks in the funding for outside organizations, such as universities and the many organizations DOGE has targeted.
At some point, the US government will need to reduce or eliminate many types of benefit payments made now. One approach might be to try to send many kinds of programs, such as job loss protection, Medicaid, and Medicare, back to the states to handle. Of course, the states would also have difficulty paying for these benefits without huge tax increases.
[5] Ten years from now, universities and colleges will enroll far fewer students.I expect that university enrollments will fall by as much as 75% over the next 10 years, partly because government funding for universities is expected to fall. With less funding, tuition and fees are likely to be even higher than they are today. At the same time, jobs for university graduates that pay well will become less available. These considerations will lead fewer students to enroll in four-year programs. Shorter, more targeted education teaching specific skills are likely to become more popular.
There will still be some high-paying jobs available, requiring university degrees. One such area may be in finding answers to our energy and resource problems. Such research will likely be carried out by a smaller number of researchers than are active today because some current areas of research will be discarded as having too little potential benefit relative to the cost involved. Any approach considered will need to succeed with, at most, a tiny amount of government funding.
High paying jobs may also be available to a few students who plan to be the “wheeler-dealers” of the world. Some of these wheeler-dealer types will want to be the ones founding companies. Others will want to run for public office. They may be able to succeed, as well. They may want to study specialized tracks to advance their career goals. Or they may want to choose institutions where they can make contacts with people who can help them in pursuing their career goals.
For most young people, I expect that four-year university degrees will increasingly be viewed as a waste of time and money.
[6] In a shrinking economy, debt defaults will become an increasing problem.A growing economy is very helpful in allowing financial institutions to prosper. With growth, future earnings of businesses tend to be higher than past earnings. These higher earnings make it possible repay both the borrowed amount and the required interest. With growth, there is little need to lay off employees. Thus, the employees have a reasonable chance to repay mortgage loans and car loans according to agreed-upon terms.
If an economy is shrinking, overhead becomes an ever-larger share of total revenues. This makes profits harder to achieve and may make it necessary to lay off employees. These laid-off employees are more likely to default on their outstanding loans. As debt defaults rise, interest rates charged by lenders tend to rise to compensate for the greater default risk. The higher interest rates make debt repayment for future borrowers even more difficult.
All these issues are likely to lead to financial crises, as debt defaults become more common.
[7] As debt defaults rise, banks tend to fail. This can lead to hyperinflation or deflation.In a shrinking economy, the big question when banks fail is, “Will governments bail out the banks?”
If governments bail out the failing banks, there is a tendency toward inflation because the bailouts increase the money supply available to citizens, but not the quantity of goods available for purchase. If enough banks fail, the tendency may be toward hyperinflation–way too much money available to purchase very few goods and services.
If no government bailouts are available, the tendency is toward deflation. Without bailouts, the problem is that fewer banks are available to lend to citizens and businesses. As a result, fewer people can afford to buy homes and vehicles using debt, and fewer businesses can take out loans to purchase needed supplies. These changes lead to less demand for finished goods. This change in demand can indirectly be expected to affect commodity prices, as well, including oil prices. With low prices, some suppliers may go out of business, making any supply problem worse.
Regardless of whether bailouts are attempted or not, on average, citizens can be expected to be getting poorer and poorer as time goes on. This occurs because with a shrinking economy, fewer goods and services will be made. Unless the population shrinks at the same rate, individual citizens will find themselves getting poorer and poorer.
[8] Expect more tariffs and more conflicts among countries.Without enough oil for transportation, the quantity of imported goods must be cut back. A tariff is a good way of doing this. If one country starts raising tariffs, the temptation is for other countries to raise tariffs in return. Thus, the overall level of tariffs can be expected to rise in future years.
Without enough goods and services for everyone to maintain their current standard of living, there will be a definite tendency for more conflict to occur. However, I doubt that the result will be World War III. For one thing, the West seems to have inadequate ammunition to fight a full-scale conventional war. For another, the nuclear bombs that are available are valuable for providing fuel for our nuclear power plants. It makes no sense to use them in war.
[9] Expect an increasing share of empty shelves, as time goes on.High tech goods are especially likely to disappear from shelves. Replacement parts for automobiles may also be difficult to find, especially before an aftermarket of locally manufactured parts appears.
[10] Interest rates are likely to stay at their current level or increase to a higher level.The high level of borrowing by governments and others makes lenders reluctant to lend unless the interest rates are high. It should also be noted that current interest rates are not high relative to historical standards. The world has been spoiled in recent years with artificially low interest rates, made possible by Quantitative Easing and other manipulations.
[11] Clearly, this list is not exhaustive.The world economy has gone through two major disruptions in recent years, one in 2008, and one in 2020. Very unusual changes such as these are quite possible again.
We don’t know how soon new economies will begin to evolve. Eric Chaisson, a physicist who has researched this issue, says that there is a tendency for ever more complex, energy-dense systems to evolve over time. This would suggest that an even more advanced economy may be possible in the future.
Note: I am also publishing this post on Substack. At this point, it is still sort of an experiment. Comments sometimes don’t post well on WordPress. This will give readers a different option for viewing posts. Using Substack, my posts may reach a new audience as well.
Some of you may receive an email about my Substack post. I put in some email addresses back in January 2024 when I put up a post on Substack earlier. Subscriptions will continue to be free both places. This is a direct link to my new post. https://gailtverberg.substack.com/p/economic-contraction-coming-right
If the government achieves its targets for renewable electricity capacity for 2030, will it meet its objective for virtually decarbonising the GB grid? Other calculations are more optimistic but this note suggests that in all probability the answer is no.
I looked at the last year (May 2025 to end April 2025) and multiplied the output of solar and wind generators in each half hour period to reflect the proposed increase in capacity and possible improvements in yield per megawatt of capacity. I also amended the output of nuclear power stations to reflect the closure of two units and I added the possible ouput of NZT, the proposed new gas fired power station with carbon capture.[1] In addition, I assume a 10% increase in total electricity demand resulting from the use of EVs and heat pumps.
This analysis shows that solar, wind, nuclear and hydro would cover about 90% of total GB electricity demand in 2030 if the weather patterns were the same as in the last 12 months. The government could not meet its target to make as much clean electricity as the grid uses over the course of a year even if we add in biomass generation as a 'clean' source.[2]
Absent the rapid growth of either hydrogen or gas power stations with CCS, we will also struggle to reach the second target of getting 95% of total electricity generation from clear sources. Put simply, clean energy is too variable to mean that 95% of generation will come from wind and other low carbon routes, even using the enhanced capacity of import interconnectors. At times of prolonged low wind, fossil electricity sources will often be needed throughout the year.
Achieving targets for 2030 generation.
The UK plans to increase its renewable energy capacity substantially by 2030. The plan is that 'clean sources produce as much power as Great Britain consumes in total' by this date. As a second objective, the government says, 95% of all generation should come from clean sources.[3]
In the basic analysis below, I suggest that neither target can be achieved unless wind and solar capacity is increased even more ambitiously than currently planned. Or that both of the Hinkley Point C reactors come online by 2030. At the moment EdF is expecting Hinkley Point C to start between 2029 and 2031.
I looked at half hour by half hour electricity generation data for the 12 month period from May 1st 2024 to April 30th 2025. I used data provided by NESO, the GB electricity system operator, to model what might happen in 2030 if the same meteorological conditions pertain.
NESO provides accurate estimates of the amount of electricity provided by the main sources of power for each thirty minute period. These sources include gas turbines, nuclear power stations, hydro-electric, solar, wind, biomass and other generators such as energy from waste plants.[4]
I assume that by 2030 the UK had reached the midpoint of the government's targets. This means
o 46 gigawatts of solar, up from about 17.6 gigawatts in the year studied[5]
o 28 gigawatts of onshore wind, up from about 15.7 gigawatts in the year studied
o 46.5 gigawatts of offshore wind, up from about 15.0 gigawatts in the year studied
I multiplied the output of onshore wind, offshore wind and solar for each half hour in the year to the end of April 2025 by the targeted change in generating capacity. So, for example, if solar power delivered 1 gigawatt in a particular half hour period in this year I calculate that it would provide 2.6 gigawatts in 2030. 46 gigawatts of solar capacity in 2030 will provide 2.6 times as much electricity as 17.6 gigawatts does today.
I took note of EdF's current intention to close two nuclear reactors in 2027. Hartlepool and Heysham 1 power stations have a maximum capacity of around 1,170 MW each. This leaves three reactors open in 2030: Sizewell B, Torness and Heysham 2 (although Torness and Heysham 2 are said to be closing during the course of 2030). I have optimistically forecast that nuclear power output will decline to about 60% of today's levels in 2030, equivalent to a yearly average of around 3 GW of working capacity after allowing for outages and refuelling. I assume Hinkley Point C has not opened by 2030.
Over the 17,520 half hour periods of the year, output from wind and solar varies hugely. The highest wind output during the year was over a hundred times greater than the calmest period. These two events, over 22 gigawatts on 17th December 2024 and 0.2 gigawatts on 22nd January were just over a month apart. Of course these large differences will remain if we model an alternative world in which wind and solar capacities are much greater.
The results of the analysis
In the year under study to the end of April 2025, sources defined as 'clean' provided just under 48% of GB electricity supply.[6] These generating stations produced 134 terawatt hours out of a total of 282.5 terawatt hours consumed in GB.
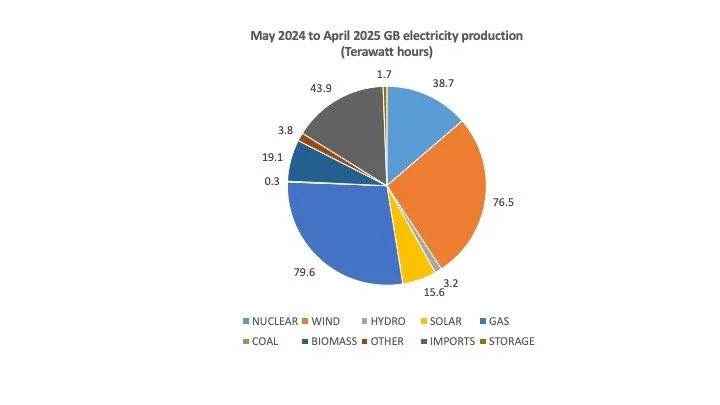
The government targets an increase in solar power capacity from an average of about 17.6 gigawatts in the year studied to about 46 gigawatts in 2030.[7] This is a multiple of 2.6 times. Onshore wind is planned to go up from 15.7 to 28 gigawatts and onshore wind from 15.0 gigawatts to 46.5 gigawatts. NESO half hourly data does not separate onshore and offshore outputs so I have generated estimates of capacity factors from each source from information published elsewhere. The result is that expected output from wind will rise by about 2.55 times if new connections match the government's target.
a. The basic test
Multiplying the power output from wind and solar in the 20224/2025 years as if the target 2030 capacities were already in use increases the amount of clean electricity produced to 278 terawatt hours.[8] Total electricity demand in the year under study was 282 terawatt hours.
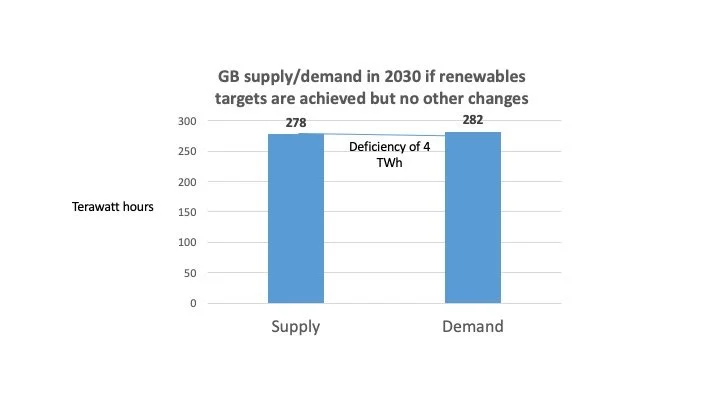
Production of clean energy - 278 terawatt hours
Less Energy consumption - 282 terawatt hours
Surplus or deficit production - minus 4 terawatt hours
b. Increasing realism
Electricity production, after having falling regularly for several decades, will start increasing as EVs become more common, heat pumps gain in popularity and data centre use ramps up. So I increased total electricity consumption by 10% across all half hours in 2030.
The average output per megawatt of capacity from wind and solar power will also probably rise. Locations will be better chosen and technologies will improve. I propose a 4% increment in electricity production per unit of solar and wind power capacity in 2030. But nuclear production will fall as two nuclear plants are withdrawn from service in 2027, cutting average production by 40%. (I assume Hinkley Point C has not opened by 2030, an assumption which may be too harsh).
In addition, GB will probably have its first carbon capture and storage gas-fired power station by 2030 and I include an estimate of maximum output from this unit.
The impacts of these changes are as follows
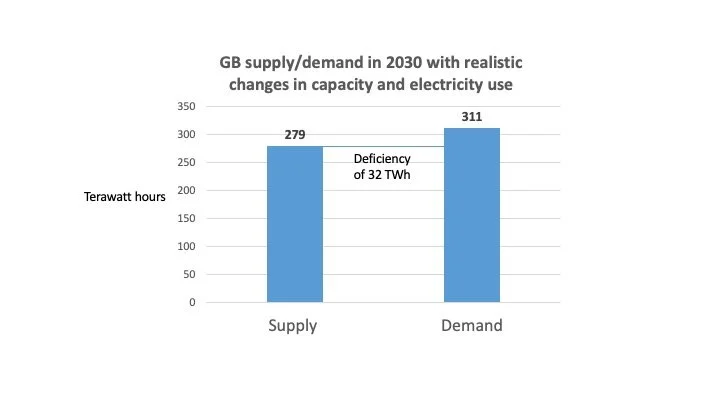
Production of clean energy - 279 terawatt hours
Less Energy consumption - 311 terawatt hours
Surplus or deficit production - minus 32 terawatt hours
So under reasonable assumptions GB's output of clean electricity will be only about 90% of the possible higher level of demand in 2030. Adding in biomass-based electricity production will not be sufficient to fill this gap, largely because of the much more limited subsidy available to Drax by 2030 and the restrictions placed on how much electricity is generated.
c. The government's second objective - 95% of all production is clean
Why is the objective even more difficult to achieve? At those moments when wind and solar plus other clean sources are not sufficient to cover that hour's demand, other sources will have to be brought into action. These may include more gas with CCS or hydrogen turbines but these source are unlikely to be operating at a large scale by 2030. The more variable is wind and solar output, the more other generators will have to be used, pushing down the percentage of clean production. This does not seem to be properly acknowledged in official communications.
In the 12 months of study, under the realistic assumptions including the 10% increase in demand and a 4% rise in wind and solar efficiency, GB would see about 6,400 half hour periods of excess production and about 11,100 half hours of deficiency. (This is before any biomass use is taken into account).
The excess production periods total 32 terawatt hours and deficiencies amount to about 71 terawatt hours. If the new gas with CCS power station operates during all the 11,100 half hours of deficiency, the volume of unfilled power need would fall to 66 terawatt hours when alternative generators or imports would have to be pulled into use. These numbers are in the context of total expected electricity usage of 311 terawatt hours so the UK would be unlikely to be able to make more than 80% of its electricity from clean domestic sources over the course of year.
Imports will help but even if clean imported electricity are available, the core problem is that periods of deficiency require more import connectors than are available. NESO predicts about 12 gigawatts of capacity by 2030, of which about 1 gigawatt represents the links to the island of Ireland and which are generally used to export from Great Britain, not import.[9]
Well over 25% of all half hour periods during the year under study experienced deficits of more than 11 gigawatts. Even in the highly unlikely event that all 11 gigawatts of import capacity were available at all these times, about 22 terawatt hours of demand would remain unsupplied. Other sources of electricity would have to be employed. At the improbable best, therefore, the UK could only hope to provide 94% of generation from clean sources, and this is assuming imports are all 'clean'.
d. What about the impact of storage, such as using batteries?
The problem with using storage is that the demands for extra electricity, or alternatively the need to take in surplus power, typically cannot be met by the volumes of batteries proposed. If clean supplies are short and they persist for several days, batteries are almost useless. Long duration storage is needed rather than batteries, which are more capable of dealing with short term fluctuations in power supplies.
One particularly clear period under study was January 8 to January 11, when clean power, including gas with carbon capture, and 11 gigawatts of imports still left GB short of 1 terrawatt hour of power over a period of less than 3 days. The average deficiency during this period was about 15 gigawatts. NESO is estimating that GB will have a total storage capacity of about 50-99 gigawatt hours by 2030. So, at the very best, GB might have battery and pumped hydro storage of about 6 hours during a similar 65 hour period on 2030. The excess of demand over supply did not stop on January 11th. It went on for 360 hours in total up until 23rd January so batteries and other storage might have meet less than 2% of the eventual need.
What about periods of excess supply? The best days in the GB market were a month earlier from December 14th to December 24th. The average excess supply in this period was about 16 gigawatts, equating to about 6 hours of storage capacity rather than the 240 hours for which batteries would have been required to capture the excess. And even if other countries had wanted all that electricity, our export capacity would be routinely exceeded. The excess power would inevitably have been wasted.
Conclusions
GB will not attain clean power output levels equal its electricity demand in 2030. Assuming reasonable growth in electricity demand, improvements in solar and wind plus a more than 2.5 times volume of renewables capacity and a new CCS gas power station but declining nuclear output, clean power will only represent about 90% of national need.
The second target - ensuring that 95% of all generation will be clean - will not be met either. This is principally because when wind output is low the expected level of interconnection with Europe will not provide sufficient power to meet requirements. Even if 11 gigawatts of connectors are available, imports will frequently not fill the deficiency. So non-clean sources in GB, such as gas without CCS, will need to be utilised to match demand and supply.
Batteries are not particularly useful in helping to maximise the amount of clean power generation. Spells of low wind speed and little sun last far too long for storage systems to offer substantial aid, even if battery capacity rises as fast as expected.
To achieve its targets GB needs even more renewable capacity and an ability to turn surplus power into usable hydrogen that can be used to make electricity when supplies are tight.
[1] In reality, NZT may not operate much of the time because of low prices resulting from Europe-wide power surpluses at times of high wind speeds.
[2] However 2025 announcements of subsidy levels suggest that biomass will only probably produce about half as much electricity in 2030 as today.
[3] The Northern Irish electricity system is part of the all-Ireland network, separate from the GB system. The government's targets refer to the GB network.
[4] The last coal-fired power station in GB closed during the twelve month period and is therefore included for part of the year.
[5] The figures used for the year under study are approximate average capacities across the 12 month period.
[6] Clean sources are defined as nuclear, wind, solar and hydro.
[7] The government offers a range for wind and solar capacity targets in 2030. I have chosen the mid point of this range.
[8] Wind, solar, nuclear and hydro.
[9] https://www.neso.energy/document/346651/download
Abstract
This article takes data surrounding last week's announcement of the first SMR farm in Ontario, Canada to assess whether this new approach to nuclear shows any signs of reducing costs below the level of larger reactors and renewable generators. In brief, the conclusion is that it does not.
SMRs
A small number of experimental SMRs have been built or are under construction in Russia, China and Argentina.[1] The history of these reactors has been full of delays and huge cost overruns.
Nevertheless recent months and years have seen an explosion of interest in constructing new reactors, often to serve specific customers with a high and consistent power need such as the operation of data centres. The International Atomic Energy Agency reported that there are 80 different designs and design concepts for new types of SMRs around the world although no formal decisions had then been taken to proceed with any new projects. Many commentators see SMRs as a realistic route to decarbonising electricity production; in its recent report, the UK's Tony Blair Institute wrote that 'The new generation of small modular reactors offers hope for the renaissance of nuclear power'.[2]
We saw a big step forward last week with the final governmental approval given for the construction of the first SMR farm at an existing nuclear reactor site in Ontario, Canada. The information released when the announcement was made gives us useful information about the possible cost of SMRs. Despite the upbeat press releases from participants in the project, the numbers provided will not increase optimism about the future of this route to a zero carbon energy system.[3]
The plans
The Darlington project plans to eventually put 4 SMRs, each of 300 MW capacity, onto the site. The Ontario government estimates the project's total cost at 20.9 billion Canadian dollars (CAN$) and is supporting it financially. Expressed in US dollars, the price is about $15bn at early May 2025 exchange rates for a total of 1.2 gigawatts of electricity.
The technology provider is GE Hitachi using its BWRX 300 boiling water reactor, a simplified version of the company's full scale nuclear plants. The BWRX 300 has been identified as one of the lowest cost competitors in the race to dominate the SMR industry and the design is one of those currently being evaluated in the UK as a potential recipient of substantial government support. GE Hitachi claims numerous advantages over other SMR technologies, including lower steel and concrete costs, passive cooling and the use of well-understood and widely available nuclear fuel.
Groundwork has been underway for more than 2 years near the existing Darlington nuclear power station in readiness for the formal safety approval finally given in April 2025. Construction is projected to be completed in 2030.[4] In a challenge to the widespread view that SMRs will be simple to construct, one of the challenges facing the first Darlington reactor is creating a tunnel to carry cooling water that will stretch for 3.4 kilometres with a diameter of 6 metres.[5]
The costs of building and operating the SMRs in Ontario.
Capital cost
The first reactor to be built is projected to have a cost of 6.1bn CAN$ (about US$4.4bn). Additional infrastructure will be needed at the site that will be shared between this SMR and the three equivalents that will be eventually built there. The capital cost of these shared facilities is separately budgeted at 1.6bn CAN$ (about US$1.15bn).
The total budget for the entire 4 reactor site is 20.9bn CAN$ (about US$15bn). So the three SMRs to be installed after the first reactor are projected to cost a total of about 13.2bn CAN$, or 4.4bn CAN$ each, a roughly 28% reduction on the 'first of a kind' (FOAK).
The cost per kilowatt of capacity for the first reactor (excluding the price of the shared services is about 20,300 CAN$, or US$14,600. Taken together, all four come in at about US$12,900.
Just a year ago, the Institute for Energy Economics and Financial Analysis (IEEFA) published a report on SMRs that showed 2020 forecast for a kilowatt of capacity for a BWRX 300 of just under US$2,900 for an 'nth of a kind' reactor.[6][7] This number was expressed in 2023 dollars to account for inflation. The suggested cost of the first Darlington, Ontario reactor is thus about five times the projected NOAK cost in 2020, just five years ago. (However this comparison could be considered unfair to the GE Hitachi reactor because it compares NOAK and FOAK budgets).
The IEEFA report also provides high and low cost estimates from 2023 for the BWRX 300 reactor from external sources. The low figure is just over US$7,400 and the high number is around US$12,350. Thus the Ontario cost for the first of the four reactors is almost 19% above the 'high' estimate from just two years ago and almost double the 'low' forecast.
As an aside, GE Hitachi in 2020 was estimating its reactor could be constructed in 24-36 months. The building work at the Darlington site commenced in autumn 2022 and is projected to finish in 2030, and therefore is scheduled to take at least 7 years.
Costs compared to renewables
How do the costs per kilowatt of capacity compare to solar and wind equivalents? The Ontario government says that it estimates that the 1.2 GW to be eventually provided in SMR capacity could be replaced by about 8.9 GW of solar and wind power. As far as I can see, it has not split this number between the two renewable sources of electricity.
In the UK, and using capacity factors appropriate to southern England, it would take about 10 GW of solar farms to create an equivalent amount of annual electricity to 1.2 GW of nuclear.[8] Given that Darlington, Ontario sits at a latitude of about 43 degrees north - equivalent approximately to Marseille - compared to London, England at 51 degrees average solar productivity will be probably be higher at the Canadian location.
So let's assume that 8.9 GW of solar PV in Ontario would provide the same amount of power as the Darlington reactors. This would cost no more than about US$9bn in the UK today, and probably much less by the time the reactors are constructed. In other words, solar alone would be less than half the capital cost of the four SMRs to provide the same amount of electricity. (However the province of Ontario does make the valid point that solar PV would probably require far more new grid capacity. It would also need long term storage). But the conclusion has to be that SMRs, at least as shown by the GE Hitachi prices, are not likely to be cheaper to construct than solar or wind.
Comparison with other nuclear sources
Equally important, are SMRs going to be cheaper than full-scale large nuclear reactors?
The new European Pressurised Reactor (EPR) at Flamanville on the Normandy coast of France was connected to the grid in late 2024. The estimated cost of this reactor is about €19.1 billion, or about US$21.5 million.[9] At maximum capacity it produces just over 1.6 gigawatts of electricity, compared to the 1.2 GW projected for the four SMRs at Darlington, Ontario.
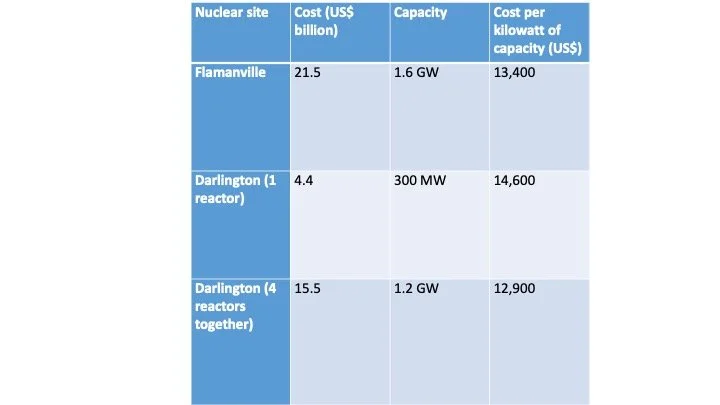
Thus the hugely expensive and long-delayed reactor at Flamanville, the fourth EPR to be completed in the world, was cheaper to construct than the estimates for the first SMR at Darlington and only marginally more expensive than the projected costs for the eventual group of 4 reactors when expressed as capital cost per kilowatt of capacity.
Do SMRs offer savings in operating costs over large nuclear power stations and renewable plants?
Most sources suggest that SMRs will have operating costs at roughly the same level as large nuclear plants per unit of capacity. However we cannot know this with any more certainty than the comparison of capital costs.
One careful piece of academic research put it as follows: ..it is expected that O&M and fuelling costs will be very similar to that of LRs.[10] This conclusion was reached some years ago and estimates may now be out of date. However I have seen no data suggesting that SMRs will be cheaper to operate than larger nuclear power plants.
The operating costs include nuclear fuel, which needs to be regularly but infrequently fed into the reactor. At current uranium prices, fuel is unlikely to be a significant portion of total costs.
More important is the cost of staff and here the limited evidence is that SMRs will require more people than larger reactors. Ontario predicts that 2,500 people will work on the SMRs at the Darlington site when the 4 reactors are complete. By comparison, Sizewell B, an existing nuclear power station in the UK, employs about 900 workers and has approximately the same annual output as the 4 reactor Canadian site will have.[11]
However if we optimistically assume that the SMRs will cost the same to run as larger nuclear sites how will they compare with solar? The US Energy Information Agency writes that the cost of running a nuclear power plant is around $22 per megawatt hour of output, or 2.2 cents per kilowatt hour. Fuel is about 0.61 cents per kilowatt hour with operations at around 0.95 cents and maintenance at 0.64 cents.
Most estimates for the operating costs of full-size solar parks are around US$15 per kilowatt of capacity per year. A solar park in Ontario is likely to produce at least 900 kWh per kilowatt annually, implying a cost of around 1.67 cents per kilowatt hour for total operating costs. The conclusion has to be that SMRs are therefore very unlikely to be cheaper to run than large solar farms in the same area as the new nuclear site.
Summary
The data provided by the press releases announcing the world's first new generation SMR park give us some information about costs. Of course we cannot know whether these estimates will be correct. But If they are actually achieved, SMRs will be only marginally cheaper than the current generation of large nuclear power stations. Operating costs will be similar to their larger cousins but possibly much more.
Solar and wind parks are likely to be less expensive in both capital and operating terms. Capital costs for solar may be no more than half the figure for the Darlington project and operating costs around three quarters of the level of SMRs.
By itself, this information does not imply that the rush towards SMRs is misplaced. They may offer cheaper grid connections and will be better at providing power directly to 24 hour electricity customers. But the arguments advanced by commentators such as the Tony Blair Institute need to adjusted recognise that there is no evidence today that SMRs will reduce electricity costs compared to continuing rapid investment in wind and solar.
May 11th 2025
[1] https://www.iaea.org/topics/small-modular-reactors
[2] https://institute.global/insights/climate-and-energy/the-climate-paradox-why-we-need-to-reset-action-on-climate-change
[3] https://news.ontario.ca/en/release/1005889/ontario-leads-the-g7-by-building-first-small-modular-reactor
[5] Same as reference 3 above.
[6] https://ieefa.org/sites/default/files/2024-05/SMRs%20Still%20Too%20Expensive%20Too%20Slow%20Too%20Risky_May%202024.pdf
[7] The 2020 figure appears to have been derived from this GE Hitachi web page and adjusted for inflation - https://www.gevernova.com/content/dam/gepower-nuclear/global/en_US/documents/product-fact-sheets/GE%20Hitachi_BWRX-300%20Fact%20Sheet.pdf
[8] Assuming a capacity factor of 90% for the SMR and 11% for UK solar.
[9] https://www.lemonde.fr/les-decodeurs/article/2024/05/09/les-derapages-de-l-epr-de-flamanville-en-graphiques-le-cout-multiplie-par-six-la-duree-du-chantier-par-quatre_5480745_4355771.html
[10] https://www.sciencedirect.com/science/article/abs/pii/S0301421517300538?fr=RR-2&ref=pdf_download&rr=93da6ca1cd7fe1fc
[11]https://www.bbc.com/news/articles/c93qz4dlqlgo#:~:text=Work%20on%20the%20construction%20of,literally%20from%20the%20ground%20up%22.
Last week the UK government effectively nationalised the blast furnaces at Scunthorpe on the north-east coast of England. These furnaces are the last sites in the UK that can manufacture iron from ore as a precursor to the production of virgin steel. The emergency legislation will help to keep open this important source of local employment and industrial activity.
Nevertheless, I argue that it was an expensive and unnecessary move. Instead of making new virgin steel, the UK should concentrate on recycling the large amounts of old scrap steel that are exported from this country for reprocessing around the world. The owners of Scunthorpe already have plans to switch to using steel using electricity and scrap. Of critical importance to any plan, the price of electricity used for electric arc furnaces needs to be roughly the same as in competitor countries, necessitating a substantial subsidy. Without it, UK steel-making cannot hope to be financially self-reliant. Other countries do this and without financial support, the UK cannot hope to be competitive.
Basic numbers
The most recent data from industry body UK Steel gives the following figures for the UK's consumption and production of steel. These figures relate to 2023. In 1970, the peak year for the country's steel production, the number was five times higher.
UK Production of steel - 5.6 million tonnes, of which 4.5 million tonnes came from blast furnaces
UK Demand for steel - 7.6 million tonnes
So about 2m tonnes of steel had to be imported in 2023. This number probably rose in 2024 after the closure of the blast furnaces at Port Talbot but the figures are not publicly available yet.
But at the same time as importing 2m tonnes of finished metal, the UK collected about 10.5 million tonnes of scrap steel, almost three million tonnes more than total steel demand in the country. Some scrap was used in the existing electric arc furnaces here but most was exported; about 8.5m tonnes of scrap was sent abroad for reprocessing elsewhere back into new steel. (Some of this new steel will have eventually come back to the UK). This makes the UK the world's second largest exporter of scrap steel for recycling. Expressed in per capita terms, the country is the top source of used steel.
Put another way, the country's exports of scrap, which can be easily recycled in electric arc furnaces, alone exceeded its total demand for the metal. There is no need for blast furnaces, such as the ones in Scunthorpe, for the UK to build self-sufficiency in steel production. This has been a consistent worry expressed over recent weeks with many expressing a view that the UK needed to retain the capability to make steel from iron ore in blast furnaces. But simply keeping used steel available for recycling in the UK would provide enough of the metal for the country's needs.
It may be worth noting that many other countries restrict or block the export of steel scrap in order to ensure adequate supplies for recycling in local electric arc furnaces.
What is stopping the UK switching from blast furnaces to make the metal, rather than using scrap steel?
· Large electric arc furnaces (EAFs) for recycling steel are expensive to construct. The EAFs to be constructed by Tata Steel at Port Talbot in South Wales are projected to cost around £1.25bn for a projected capacity of 3m tonnes a year (or potentially around 40% of the UK's total steel needs). The government has committed £500m to assist the transition there from blast furnaces to EAFs.
British Steel (owned by Jingye of China) has stated that the cost of creating two new EAFs on the north east coast will also be about £1.25 billion. The projected total capacity doesn't appear to have been published but based on the Tata numbers we can perhaps assume a similar figure of about 3m tonnes a year.
· UK electricity costs are higher than nearby countries. Even after the government intervention to reduce the costs of electricity transmission to steelworks, one recent study suggests that the British steel industry pays £66 a megawatt hour (MWh) compared to £50 in Germany and £43 in France.[1] Because electric arc furnaces use about 0.5 MWh per tonne of steel output, these higher costs can mean a handicap of £11.50 a tonne of steel from an EAF. At current finished steel prices of around £500 a tonne ($660), this imposes a burden of over 2%. In a low margin industry such as steelmaking, this difference is significant.
· Falling UK demand for steel has imposed an additional weight on investment enthusiasm. Investing £1.25bn in a shrinking market looks a dangerous decision to take. On the other hand, some demand increases are likely in future; wind turbine columns alone might add 1m tonnes a year to UK needs.
· EAFs need far fewer employees per tonne of output, making it politically difficult to allow the closure of a major source of local employment in Scunthorpe. And any new EAFs in that part of the UK will take several years before they begin to hire permanent staff.
The advantages of using EAFs rather than keeping the Scunthorpe blast furnaces open
· EAFs use local scrap metal, reducing the amount exported.
· The UK scrap also contains other metals, such as copper, increasing its value and reducing the need to import materials.
· EAFs produce much less local air pollution than the older steel-making method.
· The carbon footprint of EAFs is about one sixth of steel originating in blast furnaces. The figures will depend on the fossil fuel intensity of the electricity used but most sources estimate a footprint of about 0.35 tonnes of CO2 per tonne of steel, compared to about 2 tonnes from the blast furnace route. Replacing the 2023 4.5 million tonnes of steel with EAF output would save about 7.4 million tonnes of CO2 or just under 2% of UK emissions.
· Potentially the economics of using scrap could be better. The open market scrap price is around $350 per tonne, equivalent to £263 today, or just over half the value of a tonne of steel in the UK. The price of raw materials is likely to be more stable, avoiding the need to have to buy much coking coal and iron ore on international markets.[2]
· EAFs can help stabilise the electricity market, using power mostly at times when the wind is blowing and not at times of scarcity. Unlike blast furnaces, EAFs can decide when to operate. While not a trivial exercise, steel-making can adjust its demand to match national supplies of electricity.
In summary, both industrial strategy and carbon reduction aims should push us towards EAFs rather than keeping open the Scunthorpe blast furnaces. It makes very little sense to spend large sums keeping the furnaces open rather than sponsoring the building of new EAFs when the UK has such abundant supplies of metal for recycling and the carbon footprint benefits may be equal to at least one per cent of the UK emissions. This is not to dismiss the profound social consequences of the reduced employment prospects for steelworkers in the Scunthorpe area.
[1] https://www.uksteel.org/electricity-prices
[2] EAFs use some iron ore and some coal but in much smaller quantities than blast furnaces.
On 10th December of last year the UK government announced it had signed contracts for the support of the first two parts of the proposed carbon capture cluster in the north-east of England.[1] The projects to be funded are a new gas-fired power station with CCS, largely owned by BP, and a CO2 transmission network that takes the gas to subsurface storage in the North Sea. BP is also a major shareholder in this planned network. Two days later, the senior civil servant in DESNZ, the department responsible for developing the UK's carbon capture capability, said that the details of the deals would be published 'soon'.[2] He made this comment under questioning from a committee of the UK parliament.
When is 'soon'? On 7th February, almost two months later, I wrote to DESNZ to ask if the terms of the contracts had been put into the public domain. The response came back rapidly; the department says that they will be published 'in due course', with no mention of any specific date.[3] It looks as though we may have to wait a long time to see the details of the schemes, including both the payments that will be made to the power station for capturing the CO2 and the pipeline network for transporting it. At the moment nobody has any idea how much these projects will cost energy bill payers and taxpayers.
Does this matter? Yes: the prospective subsidy for the UK's CCS schemes is now set at almost £22bn and these first examples will set the cost expectations for all future developments. This note briefly looks at the what financial support is likely to have been agreed.
In summary, the subsidy agreed may be equivalent to doubling the cost of generating electricity in a gas-fired power station. The cost of gas with CCS could therefore be three times the price of electricity from a solar farm.
Background: the CCS projects.
The government has approved in principal two 'clusters' for CCS. One is on the north-east coast of England and the other on north-western side, spreading out into North Wales. Industries producing CO2 can apply for subsidies to collect and store the gas. The first contracts to be signed are for two projects in the north-east cluster: a new gas-fired power station and a separate transmission and storage network that takes the CO2 from the power station and future other sites.
· Net Zero Teesside Power (NZT Power)
The proposed power station will be located close to the mouth of the Tees estuary. The storage pipeline, engineered to offer a maximum of 4 million tonnes a year, will go offshore immediately to the depleted Endurance saline aquifer for permanent storage.
The design is for a 742 MW power station. If it operates all the time it will produce about 2.2 million tonnes of CO2 per year, and this figure is stated as the storage target. However more realistic expectations seem to be that the actual amount to be sequestered will be around 1 million tonnes. This suggests that the plant is expected to be operating about 50% of the time, generating an average of about 1-1.5% of current UK electricity needs.
The new power station will use a carbon capture technology in Shell's portfolio. Called CANSOLV, it operates at two existing power stations that use carbon capture. These two plants both burn coal as their fuel. No gas-fired power station uses CANSOLV and indeed NZT will probably be the first such plant worldwide to capture its emissions.
NZT Power is a joint venture between fossil fuel producers BP and Equinor. Construction will start in 2025 and is intended to be complete by 2028.
· Northern Endurance Partnership (NEP)
The transmission and storage network is owned by a consortium of BP, Equinor and TotalEnergies. The pipeline operated by NEP will run across the north east of England, passing close to some of the businesses that are applying for carbon capture subsidy. These entities include two blue hydrogen production plants as well as NZT.
The CO2 will be sent via a 145 km pipeline to permanent storage in the North Sea. The NEP has chosen the Endurance saline aquifer about 1000 metres below the surface.
· Types of remuneration agreed by government
We don't yet know the numbers attached to the subsidies but we have been told the bases for payment.
The transmission and storage network will be allowed to charge a price for each tonne of CO2 stored. It will also benefit from payments for lack of use of its network. In other words, should the early CO2 production projects not start immediately the network is ready, NEP will be paid a fee for under-use. In addition, government is providing support for the costs of insuring against CO2 leakage. It also promises a payment to compensate NEP when the subsidy scheme has discontinued paying the per tonne of CO2 fee because the maximum financial support has been reached.
The power station has a completely separate payment scheme. This involves two mechanisms; one that pays the plant for being available for low carbon generation, even if no electricity is being produced and a second that makes a payment that is intended to cover the higher costs of operating CCS equipped power station. This variable payment will in effect be a top-up of the wholesale market price and will be calculated daily 'benchmarked against a reference unabated plant'. The intention seems to be to pay awell-defined subsidy for each MWh of electricity produced bringing the CCS-equipped plant to financial equivalence with a similar power station with no CO2 collection.
How much will the CO2 collection and sequestration scheme cost?
The government talks of most of the additional bills being added to domestic and business electricity bills. The rest will be provided by general taxation.
CO2 capture in a power station uses substantial energy. This is used both in the action of catching the CO2 but also to generate the heat that drives off the CO2 from the chemicals that have captured it. In the process planned for NZT, a type of chemical called an amine will capture the gas. The amine is then taken to a chamber where it is heated and the CO2 released so that it can be pipelined to storage.
Very roughly, it will take about 1 MWh of energy (heat and electricity) to capture 1 tonne of CO2 at a gas-fired power station. We don't know the exact quantity because CCS is not yet operating on a full-sized plant.
Estimates of the full cost of carbon capture, including the energy use, range between about £110 per tonne of CO2 and much higher numbers. The £110 figure is taken from a written submission by a group at Oxford University to the UK parliament committee enquiry mentioned in the first paragraph of this note.[4] The researchers write that this is 'the industry's most optimistic full chain cost projection'.
Other recent sources suggest higher figures. One research report suggests the cost may be as much as twice this level.[5]These figures will include a return on the large amounts of capital employed in building the capture facility, not just the operating cost.
A typical modern gas-fired power station produces a tonne of CO2 for each three megawatt hours of electricity output. The implication is therefore that carbon capture from the new NZT plant on the north-east coast will add about £37-£75 per MWh to the cost of electricity produced.
The recent announcement of support for the Drax power station in north-east England gives us some help determining how high this figure is. According to Simon Evans of Carbon Brief, estimates made by the UK government suggests an expectation of average wholesale prices of around £75-80 per MWh in future electricity markets.[6] These figures are before the price of carbon is applied.
Other sources have estimated lower figures for CCS but these earlier figures usually do not take into account recent increases in the expected cost of installing CCS equipment. Nor do they account for the inevitable premium arising from having to capture CO2 from the dilute concentrations in a gas-fired power station exhaust and transporting the gas a long distance to an offshore permanent storage site.
Typically, gas power stations emit an exhaust stream which is only about 3.5% CO2, a number far lower than most chemical processes and also well below the concentrations from a coal-fired power station. Capturing CO2 from a gas-fired power station is the most expensive way of reducing emissions from a static source.
What are the implications for the cost of power from the NZT plant?
Assuming that the proposed NZT power station typically delivers electricity at an average price of £75 per MWh, the CCS will add between about 50% and about 100% to the cost of the power. The total bill to customers will range from about £112 to approximately £150 per MWh.
These figures compared to costs of around £50 for onshore wind and solar.[7] So renewables are less than half the cost of gas with CCS. I am being probably too suspicious but perhaps this is the reason that the subsidy that BP and its partners have been awarded has not been made public.
[1] https://www.gov.uk/government/news/contracts-signed-for-uks-first-carbon-capture-projects-in-teesside
[2] https://committees.parliament.uk/work/8576/carbon-capture-usage-and-storage/publications/oral-evidence/
[3] Personal communication from press office at DESNZ.
[4] https://committees.parliament.uk/writtenevidence/131665/pdf/
[5] Cost numbers obtained from 'Curb Your Enthusiasm', a report published by Carbon Tracker. https://carbontracker.org/reports/curb-your-enthusiasm/.
[6] Reference price estimate is taken from a BlueSky post by Simon Evans of Carbon Brief at https://bsky.app/profile/drsimevans.carbonbrief.org/post/3lhsuawsv4s26
[7] https://assets.publishing.service.gov.uk/media/6556027d046ed400148b99fe/electricity-generation-costs-2023.pdf. The figures given in this report are in 2021 prices and I have inflated them to current levels.
The purpose of this note is to point out that the CO2 that will need to be captured to make synthetic fuels is only slightly less than the carbon dioxide emitted by burning the equivalent amounts of fossil oil or gas. The crucial implication is that it might make sense not to focus on synthetic alternatives but to develop massive carbon capture infrastructure instead that makes burning fossil fuels carbon neutral. At present prices, it will be far less expensive to burn oil and gas and then collect an equivalent amount of CO2 than it will be to manufacture synthetic fuels. (Many of the numbers in this article are sourced from an industry research paper, referenced at the foot of the page.)
***
Many hard-to-abate sectors, such as aviation and long distance shipping, will continue to need liquid fuels indefinitely. The most commonly accepted route to decarbonisation is to substitute liquid fossil fuels, such as kerosene for aircraft and heavy fuel oil for ships, with synthetic equivalents compounds made from green hydrogen and carbon dioxide. These alternatives can be close to carbon neutral because the carbon dioxide emitted when the synthetic fuel is burnt will match the CO2 required to be captured in order to make the fuel in the first place.
Early sustainable fuels are made today using the carbon in waste organic matter ('biomass') but the volumes available globally are a tiny fraction of today's needs for energy. The carbon atoms necessary for ultra-low fuels will eventually have to come from CO2 largely captured from the air. The probability is that more than 90% of green oils and gases will be using carbon taken from the atmosphere.
Many aviation and shipping operators are already pursuing synthetic alternatives. Parts of the shipping industry in particular are shifting to building new ships that can use methanol (chemical formula CH3OH) made directly from hydrogen and CO2. These ships are termed 'dual fuel' because they retain the capacity to use conventional fossil fuels alongside methanol.
There is an another very different route forward. Instead of using low carbon fuels made from zero emission hydrogen and carbon from biomass or the air, industries could continue to use liquid fossil fuels combined with separate capture and storage of CO2. A ship burning heavy fuel oil emits about 3.15 tonnes of CO2 for each tonne burned. If the ship owner captured and permanently stored 3.15 tonnes, perhaps at a specialist direct air capture plant thousands of kilometres away, then the ship would be approximately 'carbon neutral'.
Of course the immediate reaction to this idea is one of deep scepticism. Any scheme which promises to match the emissions from burning fossil fuels with equivalent sequestration of CO2 will be highly vulnerable to being abused. We cannot be sure that the promised CO2 storage will be permanent, or that it wouldn't have happened anyway. Ensuring that carbon neutrality arises from truly additional capture of CO2 is a very difficult challenge.
Let's put aside these obvious concerns about whether the new carbon dioxide storage genuinely balances particular emissions. Instead, we can ask first whether this alternative to synthetic fuels is likely to be cheaper and easier to develop.
Comparing route 1 (manufacturing synthetic fuels using zero carbon molecules) and route 2 (burning fossil fuels and then capturing and equivalent amount of CO2).
· Route one
This example looks at synthetic methanol and compares it to heavy fuel oil for shipping.
The chemical formula of the methanol molecule is CH3OH, meaning it has one atom of carbon, four of hydrogen and one of oxygen. Hydrogen is light, with a molecular weight of one, while carbon and oxygen have weights of 12 and 16 respectively.
So each molecule of methanol has a molecular weight of 32. A tonne of methanol contains 12/32 multiplied by 1000 kg of carbon or about 375 kg . To obtain this much carbon will require the capture of 1.375 tonnes of CO2 as the raw material. This assumes 100% efficiency and a more reasonable assumption might be that 1.4 tonnes of carbon dioxide will need to be extracted from the air to make a tonne of synthetic methanol.
Methanol contains about half as much combustion energy as heavy fuel oil. So every tonne of conventional fuel will need to be replaced by two tonnes of methanol, implying a requirement to capture about 2.8 tonnes of CO2 to make enough methanol to replace a tonne of today's fuel.
This number compares to the 3.15 tonnes arising from the combustion of heavy fuel oil. This means that synthetic methanol has a carbon footprint of around 90% of conventional fuels for shipping. Of course the 2.8 tonnes from methanol has arisen from an earlier carbon capture process.
The other key ingredient for methanol is hydrogen. Each tonne of the fuel requires about 200 kg of green H2. (This is needed both to be incorporated into the methanol and also to react with the spare oxygen molecule in CO2 to make water - H20 - as part of the chemical reaction). To make two tonnes needs about 400 kg of hydrogen.
The cost of synthetic methanol will probably be dominated by the manufacturing of hydrogen. Extracting CO2 from the air will be the other main burden.
Route 2
As described above, Route 1 extracts CO2 from air, reacts it with hydrogen and creates methanol. The possible Route 2 burns fossil fuel as today, and then captures and permanently stores the amount of CO2 that results from the combustion.
Comparing the economics of each of the two routes
Route one
The key cost is likely to be price of the hydrogen required. As written above, two tonnes of methanol will use about 400 kg of H2. We see a very wide variety of different estimates of the likely price.
· At £1.50 a kg, the price often said to bring comparability with oil and gas, the cost of the H2 necessary to make the two tonnes of methanol would be $600 (before transport).
· Current costs appear to be far higher although details are scarce, partly because of the relatively small number of green hydrogen production plants currently operating. A reasonable estimate today might be $5 a kg. At this price, the green H2 necessary to make the synthetic methanol to replace one tonne of fuel oil would be $2,000.
· The costs of 2.8 tonnes of carbon dioxide captured from the air (often known as DAC) is also very difficult to estimate. Costs as low as $100 a tonne are seen in some estimates for 2030 or before. But prices today may be at least five times this level. (These figures do not include an estimate for the - relatively small - costs of temporary storage). Route one needs about 2.8 tonnes of captured CO2 for methanol that equates to a tonne of fuel oil. Costs are therefore between $280 and approximately five times this price, or around $1400.
· In addition, there will be a small cost for the pure water for the manufacture of the methanol and, more importantly, for the capital and operating costs of the methanol production plant. It's little more than a guess, but these may add $100-$200 for each tonne produced, or $200-$400 for the methanol to equate to a tonne of fuel oil.
At the very lowest end, each two tonnes of synthetic methanol will therefore cost
Lowest
· H2 $600
· CO2 $280
· Processing, including water $200
Total before transport $1080
At the upper point, each 2 tonnes of methanol will cost much more
Higher end of estimates
· H2 $2,000
· CO2 $1,400
· Processing, including water $400
Total before transport $3,800
Route two
This route requires the purchase of fuel oil and paying for the capture of carbon, plus its storage.
· The price of fuel oil varies around the world but averages (January 2025) about $600 a tonne.
· The estimates for Route one above suggest a range of between $100 and $500 for the cost of direct air capture of CO2. In addition, in route two, a guess might be that CO2 transport and permanent storage costs add another $60 per tonne. Route 2 produces 3.15 tonnes of CO2 per tonne of fuel oil burnt.
At the lower boundary, a tonne of heavy fuel, accompanied by the capture and storage of the amount of CO2 that will be created when that oil is burnt, will cost as follows:
Lowest
· Tonne of heavy fuel oil $600
· CO2 capture $315
· CO2 storage $189
Total $1,104
At the higher end, these figures will be approximately as follows:
Higher end of estimates
· Tonne of heavy fuel oil $600
· CO2 capture $1,575
· CO2 storage $189
Total $2,364
What are the implications of these numbers?
The core finding from this analysis is that it will probably be cheaper to burn fossil fuels and then capture an equivalent amount of CO2 than it will be to manufacture low carbon synthetic fuels, at least until the price of hydrogen has been pulled down from today's levels.
The 2 tonnes of synthetic methanol needed to replace a tonne of shipping fuel will cost about $1,080 at the very low hydrogen cost of $1.50 per kg. The cost of simply burning oil and then capturing sufficient CO2 from the atmosphere will be slightly higher at around $1.104.
But unless hydrogen falls in price to this level, synthetic fuels will be much more expensive than fossil fuel use plus carbon capture. Although green hydrogen at $1.50 seems possible in parts of the world with the lowest electricity costs, this target will be difficult to meet in most parts of the developed world.
The estimates above suggest at the upper end of the range for CO2 capture and hydrogen manufacture that synthetic methanol might cost as much as $3,800 for a quantity (two tonnes) that matches the energy value of a tonne of heavy fuel oil. At the higher end of the possible cost range, the cost of buying oil and sequestering an appropriate amount of carbon could cost around £2,364, just over 62% of the cost of the synthetic alternative.
Put at its simplest, the commercial future of synthetic fuels depends crucially on the relationship between the cost of green hydrogen and the fossil alternative. That's because, at least in the case of global shipping, the amount of CO2 that will need to be captured is - very approximately - the same whether new renewable fuels are being made or whether old fuels are used and the concomitant amount of CO2 stored elsewhere. This is probably true for all hydrocarbon fuels.
At the moment, the evidence strongly suggests that it is far cheaper to build a huge carbon storage industry and continue to burn oil and gas than it is to make replacements for fossil fuels from hydrogen and captured carbon dioxide. The core reason is that per unit of energy, current fossil fuel prices are far lower than green hydrogen made from water electrolysis. This isn't a comfortable conclusion but needs much greater open discussion.
Source for some of the numbers in the article https://www.digitalrefining.com/article/1002891/methanol-from-co2-a-technology-and-outlook-overview#:~:text=Green%2Frenewable%20methanol%20synthesis&text=In%20the%20presence%20of%20catalysts,gases%20and%20purified%20through%20distillation.
The energy transition is being held up by the slow rate of growth in electricity demand. Two examples illustrated this problem today (December 19th 2024).
· Aurora, the Oxford energy consultancy, said that periods of negative price in the UK multiplied six fold between 2022 and 2024. Aurora points out that this causes concern among investors about the future profitability of new renewable electricity projects, and therefore slows the growth in renewables.
· Better Energy, a large solar developer in Denmark, went into restructuring, a route that seems roughly equivalent to the Chapter 11 process in the US. In its press release Better Energy wrote 'The green energy transition is in crisis, as the shift from fossil fuels to electrification is progressing too slowly. This creates uncertainty about the pace of the transition, makes investors uncertain and thus changes investment conditions'. 'It became increasingly clear that the roll-out of green electricity production risks out-running the market'.
This short note estimates the increased electricity use arising in the UK from the installation of heat pumps and the purchase of electric vehicles and compares these numbers to the overall change in electricity demand.
First, what is happening to electricity demand across the UK? Government statistics show that between 2010 and 2023, total power demand fell by 18% or 68 terawatt hours (TWh).. Deindustrialisation and greater efficiency in home appliances and lighting are principal causes. For example, domestic demand peaked at 125 TWh in 2005, falling to about 92 TWh in 2023.
The decline in total electricity consumption appears to be continuing with a decrease of 1.1% or 3.5 TWh between 2022 and 2023. Growth in data centres and AI servers may diminish the rate of decline but the UK's high electricity prices do not make the country a logical location for applications that require large amounts of power.
As a second question, how does this yearly fall compare to the increased use of electricity from the growth of electric cars and heat pumps, the two principal changes currently tending to push up requirements for electricity?
Electric vehicles
This year will see sales of about 360,000 pure EVs in the UK. British cars do about 15,000 km a year, or just under 10,000 miles. Typically, an EV will use about 1 kWh per 6 km travelled. So each new car sold adds about 2,500 kWh, or 2.5 MWh, to yearly electricity consumption.
360,000 new EVs (and assuming no retirements from the fleet) will therefore add 0.90 TWh to UK electricity need.
In addition about 170,000 plug-in hybrids will be sold. If we assume that half their travel is powered by electricity, this will add about 0.21 TWh to UK demand.
Some other electric vehicles, including buses and light vans, are not included in these figures. At a guess, this might add a further 0.20 TWh to electricity need.
Heat pumps
Heat pumps are growing rapidly in the UK and installations will probably reach about 50,000 in 2024. (Of course this number is very small to the installation rates in almost all other European countries). I estimate that each new heat pump will add 5,000 kWh to demand every year, meaning an increment to national electricity needs of about 0.25 TWh from these new heating systems.
The balance
New purchases of heat pumps and EVs will add just over 1.5 TWh to total electricity demand in the UK in 2024. This is substantially less than half the decline of 3.5 TWh in total power use between 2022 and 2023. And even this comparison is flattering because 2023 sales of EVs and heat pumps will have helped push up demand for electricity in that year.
Very roughly, installation rates of new electricity consuming equipment will have to triple to outweigh the underlying fall in power use. As Better Energy said this morning 'The main challenge is no longer the production of more renewable energy, but increasingly declining demand'. In an unavoidable conclusion, better energy efficiency is the enemy of the energy transition.
A yearly opinion survey carried out in many countries around the world looks at attitudes to climate change and to emissions reductions.[1] Paid for by the French utility EdF, the data collection is carried out by Ipsos. In the edition that collates the results from the 2022 survey, twenty researchers - mostly French - analysed the results and provided crisp commentary.
One thing immediately stands out. Between the surveys of 2019 and 2022, most countries saw a small but definite rise in broadly defined climate scepticism. Although a large majority around the world continues to sees climate change as being caused by human activities, increasing numbers of respondents say that climate change is caused by natural causes, or they are still not sure what is causing it, or whether it exists at all.
Figure 1
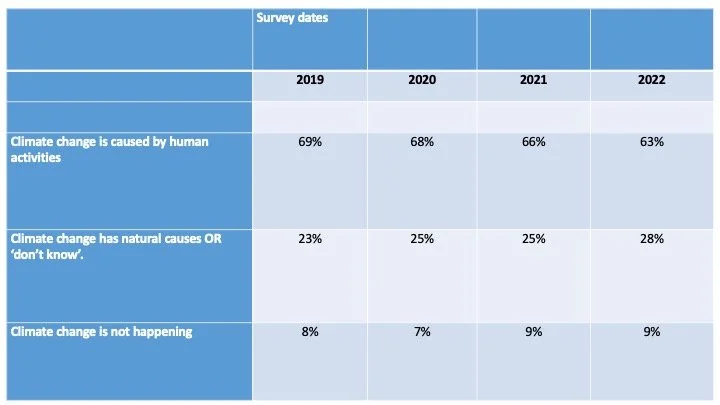
Source: EdF
In the period between the 2019 and 2022 surveys, the percentage of those polled who do not think that human actions, such as burning fossil fuels, are causing climate change has risen from 31% to 37%. The numbers who ascribe it to human activities fell from 69% to 63%.
This pattern applies across the world. In France, for example, the percentage saying that human actions are not causing climate change rose from 29% to 37%. In India, the figure rose from 29% to 40%.
The result is surprising; the scientific consensus on the cause of rising temperatures and extreme weather has become almost unanimous but the numbers rejecting this judgment around the world have grown sharply in the last few years.
Does this matter? Yes. A shift to a belief that mankind is not responsible for climate change makes it easier to believe that little can be done to slow and eventually reverse the increase in temperatures. Unpopular policies to cut carbon emissions become less politically acceptable.
Is the UK seeing the same pattern?
In short, the answer is yes. The pollsters YouGov run a survey approximately every two months that asks people the following question with four potential responses:
On the subject of climate change do you think ……
· The world's climate is changing as a result of human activity
· The world's climate is changing but NOT as a result of human activity (capitals used in YouGov survey)
· The world's climate is NOT changing (capitals used in YouGov survey)
· Not sure.
The survey has been run since July 2019 and the most recent one was completed a few weeks ago in September. So the data is more up-to-date than the EdF numbers.
The Ipsos worldwide survey has a sample size of 24,000 respondents. YouGov's UK survey typically has around 1,700 respondents and so I have smoothed the British data by creating a rolling one year average of all the 6 surveys in the preceding 12 months. This means that the first data point covers the six surveys to May 2020. The final data point averages the results for the same number of surveys to September 2024.
Figure 2 shows the percentage believing that climate change is a result of human activities. The results show a rise to about 74% in the six surveys to February 2021 and then a fall to around 69% in the six surveys up to September 2024.
Figure 2
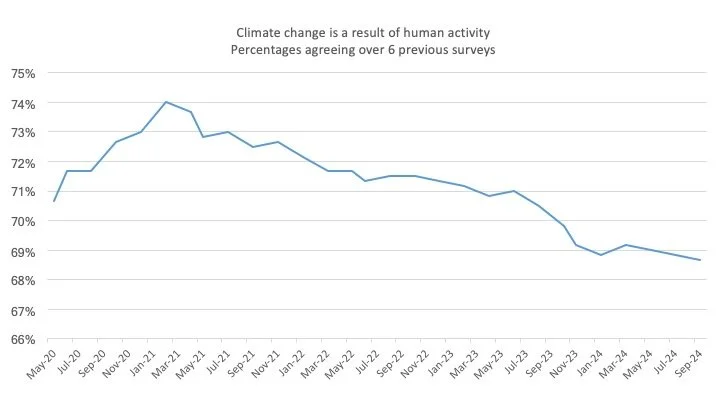
Source: YouGov.
The percentage of UK respondents seeing climate change arising from mankind's activities has therefore fallen around 5% between 2021 and 2024. Therefore the share of the population either seeing climate change as of natural origin, not being sure of its cause or denying the existence of any climate change has risen from 26% to 31%.
The most importance cause of this rise is the number of respondents saying that climate change exists but has natural causes. Although there has been a slight fall since March 2024, the percentage has increased from about 12% in early 2021 to around 16% now.
Figure 3
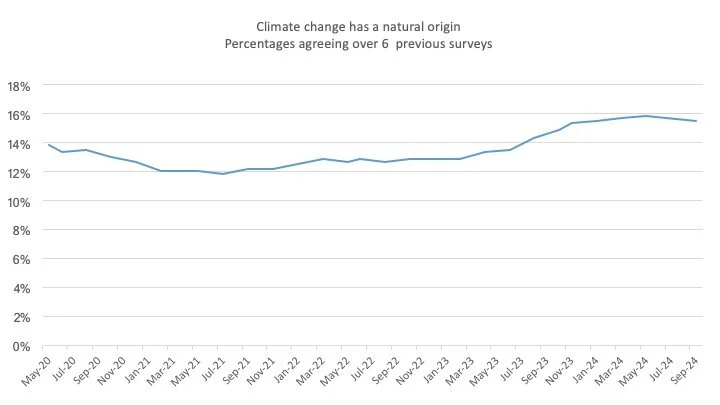
Source: YouGov
The percentage recorded as 'Not sure' has barely shifted from 12% of the survey responses. Those stating that climate change is not happening have risen slightly in number to around 4% from a low point of 2% in early 2021. Taken together these three responses add up to the 31% of people not believing in the human origin of climate change in the average of the six surveys to September 2024.
The one year rolling average for the UK numbers shows somewhat lower levels of scepticism than the global average. (A 69%/31% split compared to the 63%/37% split in the EdF world surveys). But at around 5/6%, the decline in the percentage of respondents believing that human actions are causing climate change is similar in the UK and the global average.
Which social groups are driving this change in opinion?
The EdF global survey shows how differences in social status, education levels and political attitudes affect the level and the degree of growth in scepticism about the human cause of climate change. In general, higher income is not strongly correlated with attitudes to climate and age is a very poor predictor of opinion; those over 65 have exactly the same propensity to believe global warming is driven by the modern economy as those between 25 and 49.
Levels of income and education are more correlated with views in the world surveys. Among the better educated, climate scepticism is 10% higher than among the lesser qualified, for example. Unsurprisingly, the most powerful correlation is between the degree of concern with climate change and the views about its origin. The least worried decile has only 19% of its respondents saying climate change was caused by human action whereas the most concerned decile has 80% of respondents believing in this cause.
In the UK, in some ways the patterns are different. YouGov splits respondents by region, sex, political views, age, social status and how the person voted in the Brexit referendum.
The following table lays out by what percentage the belief in the human origin of climate change the individual groups fell in the period between the year to February 2021 and the year to September 2024.
Figure 4

Source: YouGov
This table makes clear that the decline in the belief in the scientific consensus on climate change is particularly concentrated among older Conservative voters who cast their ballot in 2016 to leave the EU. These groups were already more sceptical and so the differences, for example, between Conservative and Labour voters, for example, have widened.
On average, non-believers in climate change from human actions fell by 5% between the year to February 2021 and the year to September 2024. However Leave voters fully believing in climate change reduced by 9% from 64% to 55% and Conservative voters (many of whom will also have been Leave supporters) saw an equivalent decline. Leave voters now barely include a majority who blame human actions for climate change.
By contrast, Remainer voters barely changed their core opinion on climate change and 85% still see the human origin of global warming. The gap between this percentage and the percentage of Leavers with the same opinion has risen from 22% to 30%.
Wealthier people in classes ABC1 do have a lower degree of climate scepticism but the gap between this group and those in the C2DE group has not widened. Similarly, males are consistently less convinced about human origin of global warming than females but both groups saw a reduction of about 5% in the percentage declaring this opinion.
Conclusion
Despite the increasing evidence of dangerous climate change, the percentage of global, and UK, respondents thinking this arises from mankind's actions has fallen substantially in recent years. In the UK, the change in attitude is principally found among survey respondents of the political right, particularly those older people who voted to leave the European Union.
Thames Water
I spoke yesterday (Wednesday April 3rd) to Ruth Williams of Utility Week about the probable outcomes of the current debacle at Thames Water. I hypothesised that the financial challenges facing the company were so severe that it would inevitably end up in public ownership. The resulting article is here.
I'll attempt to provide the detailed numbers in this note to justify this view. But first I'll try to give some background.
The context.
Yesterday's Utility Week conversation follows an interview last year when Ruth talked to me about the first attempt by private equity to gain control of a UK water company. This was in 2001/2 and involved Southern Water. I was then an independent member of the UK's Competition Commission, now part of the Competition and Markets Authority. The Competition Commission was charged with examining water industry takeovers to ensure that Ofwat's ability to regulate the industry was not impacted.
The Commission's view was that the transaction should be permitted. I strongly disagreed. I was obliged by the Commission to focus my statement of dissent on technical matters that revolved around the loss of a separate water company as a result of the proposed deal.
If the transaction took place, Ofwat would then have a slightly reduced ability to compare the relative performances of the 22 water suppliers in the UK when setting prices. The regulatory framework obliged Ofwat to penalise relatively poorly performing companies by obliging them to reduce their prices in relation to those water businesses doing well on measures such as leakage rates, investment levels and water quality. This is the focus of the first pages of my dissent.
But my material on the loss of an independent competitor was a façade. My real concern, expressed forcefully but completely ineffectually within the Commission, was that the highly leveraged financial structure of the proposed takeover would make regulation impossible. I was allowed to mention this concern but only in an appendix to my dissent. Twenty years ago, the Commission had a view that the methods of financing of takeovers would have no impact on the acceptability of a merger.
This appendix was then redacted for 20 years before FOI requests obliged the Competition and Markets Authority to make the full version available here:
The Appendix can be found at page 11 to 18 of the full note.
It is not a particularly clear summary of my thinking but paragraph 6 makes the core point: regulators cannot regulate highly leveraged businesses if price controls would force them into bankruptcy.
Put simply, my question is this: how can the regulator use price reductions to force companies to generate efficiency gains if by so doing he makes these companies unable to finance the operation of their business? As I say below, a highly geared and sophisticated capital structure is likely to reward shareholders handsomely if the business does well. If it does badly, the most likely outcome is a renegotiation of the price regime. English and Welsh water businesses will need new capital for decades to come. If the regulator does not revise his price caps, capital investment programmes will suffer. In my opinion, he therefore has little choice but to give in to the demands of water businesses that need to deliver high levels of regular financial return to outside investors, banks and bond holders.
This is exactly what we are seeing today. Highly indebted Thames Water teeters on the edge and demands price rises of 40% in real terms (said to be 56% in nominal money) before 2030. Faced with this request, the options facing Ofwat are all deeply unattractive.
The current position
First of all, I need to say that I have rounded all the following numbers to aid comprehensibility. I don't think there's any detriment to the arguments. Most of these figures come from Thames' latest half year report, multiplied to cover a full year. This report is available here.
1, Water companies, as with all 'grid' operators such as gas and electricity transmission companies and communications networks, have very high ratios of capital stock to yearly revenues.
o Thames Water has annual revenues of about £2.5bn a year. The capital employed in the business is around £19bn, or almost eight times as much.
2, Some water companies have financed their capital stock using money borrowed from outside lenders.
o Thames has borrowings of around £16.4bn. (It states it has a gearing ratio of under 80% (page 5) which is slightly inconsistent with this number and my assertion quoted in the previous paragraph that it has £19bn of capital employed).
3, Although water companies make good margins on sales, the free cash flow after paying interest on debt may be small compared to the continuing investment needs of the business.
o Thames Water is currently investing about £2.1bn a year. This compares to free cash flow of around £1.2bn a year. (page 5) So, even before considering the debt that is coming to maturity this year and for increasing capital investment needs, Thames has a requirement for nearly £1bn of extra outside money.
4, Water companies have large stocks of invested capital, now often financed with external debt. This debt all eventually comes due for repayment.
o Over the next four and a half years, about £5.4bn of Thames Water debt will come due. (page 10). This will average about £1.2bn a year. Maturing debt is therefore eats up approximately all free cash flow at current customer prices. And this is before any capital investment.
o Total fundraising needs will include both cover maturing debt (£1.2bn a year) as well as the £0.9bn difference between continuing capital investment (£2.1bn) and the free cash flow available to finance this investment (£1.2bn).
5, Under-investment in the past decades will imply a sharp rise in the capital spending over the next few years in many water company regions.
o Thames Water is proposing new investment at a much higher level than currently. It suggests a figure of around £18.7bn over the next five year regulatory period (2025-2030) to begin dealing with the enormous problems of waste water processing. This is equivalent to £3.7bn a year or nearly 50% more than total annual revenue. To repeat: Thames wants to invest 150% of its total income, before considering the costs of running its business.
o Add maturing debt and total fund raising will therefore need to be about £4.9bn a year, or about 4 times current annual free cash flow.
6, Interest payments on water company debt will rise from the low levels of a few years ago to reflect higher interest rates.
o Thames Water interest payments have been running at about £360m a year. (I have estimated this figure by doubling the half year number on p9). This seems to exclude what is called the 'accretion' of liabilities due on index-linked debt. This would substantially increase the £360m cost but I am unable to estimate by how much.
o New debt raised at fixed rates, rather than the index-linked instruments that provide about 60% of Thames's current indebtedness, would cost substantially more. Government 10 year debt currently trades at a yield of around 4%, and I guess Thames would have to pay around 6.5% for a similar maturity. I estimate total fundraising needs will be £1.2bn (maturing debt in point 4) and new investment £3.7bn (point 5) less free cash flow of £1.2bn (point 4). £1.2bn plus £3.7bn less £1.2bn equals £3.7bn. At 6.5% this would cost extra £240m per year less the cost of perhaps £80m no longer payable on the matured debt. This yields a net figures of an extra £160m a year on top of the current £360m.
o The implication of this is that each year that passes will add £160m to Thames' interest bill (or index linked equivalent). This alone would absorb about 60% of free cash flow by 2030.
7, We can assume Thames will be allowed to raise its prices, which will help produce more free cash flow to increase its investment. It is asking for 40% in real terms before 2030. In the highly unlikely event that this increase flowed directly into cash, it would increase the amount available for new investment by around a billion a year. This does not come close to covering the incremental cash needs specified in point 5.
8, The stream of numbers in this note can be compressed into two assertions:
o Without very substantial external fundraising Thames Water cannot meet its investment requirements, even if it is allowed to charge very much higher prices.
o The lack of any sign that Thames will be net cash positive in the next decade makes any form debt financing extremely difficult. Raising new shareholder equity is vanishingly unlikely. So there is virtually no chance of private money continuing to fund even the continuing operations of the company, much less its enhanced investment proposals.
This means that, possibly disguised in some form of 'special administration', Thames will inevitably end up in the hands of a state entity. This will cut the interest rates it will pay but it will still require large injections of new cash if it is to improve its dire record in river pollution.
Chris Goodall
chris@carboncommentary.com
+44 (0) 7767 386696
4th April 2024.
Please copy any part of this note if it would be helpful. I'd be grateful for attribution.
This week the UK government welcomed the first transatlantic flight by a commercial airliner using 100% Sustainable Aviation Fuel (SAF). Prime Minister Sunak said 'SAF is primarily made of waste oils and fats. … SAF will be key to decarbonizing aviation. .. It could create a UK industry with an annual turnover of almost £2.5 billion, which could support over 5000 UK jobs'.[1]
Unfortunately, this isn't correct. Aviation fuel made from waste oil and fats is not zero carbon. Perhaps more importantly, the quantities available for use in the UK and elsewhere are not sufficient to 'decarbonize aviation'. And published official reports show that the government knows this. The actual share of aviation needs that can be met by these two sources is almost certainly less than 2%, even if these raw materials are entirely used for this purpose, rather than existing uses. Mr Sunak estimates the potential industry value at £2.5 billion but even if all the UK's waste oil was used for aviation, the size would be about a tenth of this number.
How much waste cooking oil is potentially available in the UK?
In 2013, consultants Ecofys produced a report, then published by the Department for Transport, that estimated that the total volume of used cooking oil (usually called UCO) produced in the UK was about 250 million litres.[2] This figure was taken from estimates produced by the UK Sustainable Biofuels Association and submitted to the House of Commons.[3]
Most of this UCO, then and now, is used to make biodiesel for road use. And not all is collected for reuse. But let's assume that all the 250 million litres would be available for aviation. Put through the most efficient process, this would turn into about 160,000 tonnes of aviation fuel.
The total current demand at UK airports runs at about 12.2 million tonnes. So UK-sourced UCO could produce about 1.3% of the country's needs. But, to stress the point, this is assuming that every litre produced was efficiently turned into aviation fuel with no losses. Every single takeaway in the country, every restaurant and catering establishment would have to devote all its UCO to one particular use. Biodiesel and other uses have no access to the UCO even though at the moment, for example, McDonalds uses its own waste oil for biodiesel for its distribution fleet.
What do other government reports say about the maximum availability of UCO?
In 2017, the government's business and energy department, then called BEIS, asked Ricardo to estimate the real availability of all forms of waste biomass in 2030.[4] (UCO is included as waste biomass because cooking oil is made from oil seeds such as rapeseed).
The consultants reported that the energy value of all UCO available for use was 7 Petajoules (PJ). This was described as 'the accessible resource in 2030, if no barriers to supply are overcome'. If all these barriers were surmounted, the number rises to 9 PJ.
In an efficient process, 90% of the energy value of UCO can be converted to aviation fuel. That means that the maximum energy available would be 8.1 PJ, equivalent to 2.25 terawatt hours (TWh). The energy value of all the aviation fuel used in the UK is about 145 TWh, implying that UCO could provide about 1.45% of the total requirement if all is devoted to aviation fuel. That's slightly more than the Ecofys figure of about 1.3%.
What might be the actual amount that the aviation industry could use?
In a consultation document published earlier this year, the Department for Transport made its own estimates of the volume of UCO that could be available for aviation purposes in 2030.[5] It used further work by Ricardo and a body entitled the Aviation Impact Accelerator, a team based at Cambridge University. Most of the external team members of this second body are part of the aviation industry, including Boeing, Rolls Royce and Heathrow Airport. It won't be a surprise to learn that the Accelerator produces some estimates for availability which are an order of magnitude greater than the figures from the specialised consultants.
The 2023 forecasts developed by Ricardo assume that the UK can devote 3% of all available domestically produced UCO for aviation fuels and also purchase 1% of all internationally produced used oil. These assumptions therefore result in much lower assumed availability. Rather than estimating a total energy value of 2.25 Terawatt hours, it suggests a figure of less than a tenth of this level.[6] This figure is then assumed to fall as the availability of internationally sourced UCO declines. Other countries will need that oil for their own fuels.
These Ricardo figures, published by the government as the lower bound of its forecasts, would allow only about 0.1% of all aviation needs to be fulfilled by UCO (from the UK and elsewhere) in 2030.
The estimates from the Aviation Impact Accelerator are far more optimistic, largely because it assumes that the volumes of used cooking oil available in the UK will grow. (There is no justification presented for this opinion). This industry body uses the Ricardo UK figures from 2017 for total availability (2.25 TWh for the energy value of UCO produced in the UK) and then almost doubles this figure by 2040. But even under these unrealistic assumptions, the total percentage of all aviation fuel produced in 2030 is no more than around 2% of current needs.[7]
To summarise, if ALL the UK's UCO was used to make aviation fuel, meaning that other major uses, such as biodiesel were stripped of their share, government data suggests that no more than 1.45% of energy needs could be met. Even adding in substantial growth (which is highly implausible) and some imports only increases that figure to around 2% in the Aviation Impact Accelerator figures.
Would the use of other waste oils change this position?
The UK Prime Minister also mentioned waste oils in his statement. The principal source for aviation fuel today is animal fats derived from slaughterhouses. This is sometimes called 'tallow'. The volumes are far smaller than for UCO. As importantly, tallow loses more energy in the conversion process to aviation kerosene than does UCO.
The Ricardo 2017 analysis suggests that the total availability of all tallow in the UK is equivalent to about 4 PJ, or 1.1 TWh. After conversion to jet fuel, the energy value might be around 0.4 TWh, or around a quarter percent of the UK's needs. For reasons which are not explained, the industry-led Aviation Impact Accelerator sees the amount of tallow rising over 50% between 2025 and 2030, even though the amount of meat being eaten in the UK is stable or even falling. The more pessimistic assumptions by Ricardo in its 2023 projections suggest that considerably less than 0.1% of aviation demand can be met by tallow.
What are the implications of this analysis?
For aviation to be fully decarbonised the world will need a mixture of battery aircraft for short trips, some use of hydrogen in medium-sized aircraft and a very large scale replacement for aviation kerosene for long distance travel. Although using UCO is appealing because of the ease of conversion to fuel, the volumes are tiny in the context of the global need. We will need alternatives that offer orders of magnitude more output for full decarbonisation of aviation, even though they are far more complex and costly than UCO. SAF from waste oils is a dead-end.
What are the realistic options for the future? Government reports in the UK focus on forestry residues and municipal solid waste. In the case of wood products, the concern is the risk of deforestation, the lack of available supply and the technological complexity of turning lignocellulosic materials into kerosene. No-one is doing it at scale yet. Municipal waste suffers in addition from a small supply that is likely to decline as recycling plastics becomes more common.
So the answer has to be synthetic fuels, made from hydrogen and direct air captured CO2. This is an early stage industry but is the only conceivable way of meeting aviation's needs with a low carbon impact. Follow Infinium and Norsk e-Fuel as good examples.
Appendix
The International Energy Agency's views
It isn't just the UK which doesn't have enough waste oils. Here's what the IEA wrote in December of last year.
Used cooking oil and animal fats are unlikely to provide relief (to biofuel producers), as they are in even higher demand because they offer lower GHG emissions intensity and meet EU feedstock requirements. In fact, the use of used cooking oil and animal fats nearly exhausts 100% of estimated supplies over the forecast period. Even when a broader range of wastes (such as palm oil mill effluent, tall oil and other agribusiness waste oils) is considered, demand still swells to nearly 65% of global supply.
(From 'Is the biofuel industry approaching a feedstock crunch', IEA December 2022.)
And we almost certainly need to fly a lot less. Not least because even the best SAF still releases water vapour when burnt, adding to the global heating caused by contrails.
[1] https://www.livemint.com/news/world/sustainability-landmark-virgin-airlines-takes-off-first-saf-based-flight-rishi-sunak-calls-it-very-exciting-11701242225845.html
[2] https://assets.publishing.service.gov.uk/media/5a74ebade5274a3cb286840c/ecofys-trends-in-the-uco-market-v1.2.pdf
[3] https://publications.parliament.uk/pa/cm201012/cmselect/cmenvaud/1025/1025vw08.htm
[4]https://assets.publishing.service.gov.uk/media/5a7f9007e5274a2e87db69a8/Biomass_feedstock_availability_final_report_for_publication.pdf
[5] https://assets.publishing.service.gov.uk/government/uploads/system/uploads/attachment_data/file/1147351/uk-sustainable-aviation-fuel-mandate-consultation-stage-cost-benefit-analysis.pdf
[6] The exact figures are not given in the report and I have estimated this number from Figure 5.
[7] Once again, I should stress that the government report does not provide the precise figures and I am estimating the percentage from Figure 5.
Almost every week a new report quantifies the investment needs for part of British infrastructure. Without unfailingly consistency, the researchers specify requirements for large numbers of billions of pounds to modernise energy, transport, water supply or similar sectors. Strikingly, these figures are never put into context. We are not told whether the additional capital investment represents a large or a tiny fraction of GNP, nor how they compare to other countries. It's time to change this.
This article is an attempt to pull together some of the estimates contained in the recent analysis from the UK's National Infrastructure Commission and compares these figures with the total investment volumes in the British economy, with international averages and with comparable figures, particularly as regards energy, that have been produced by other sources. It concludes by suggesting that, if carried through, new capital going into energy will require allocation of at least 1.5% of GDP. But other sectors will also need major injections and the rebuilding of the British economy will absorb at least 5% of national income over the next decades. This is a major - and unremarked - shift in the structure of the economy but the growing evidence of inadequate capital spending across the UK makes the investment increasingly urgent.
The data
The UK currently puts about 18.4% of its national income into capital investment across the economy.[1] This includes such things as the purchase of machine tools or robots for a factory, the construction of new houses or transmission masts for mobile phones.
18.4% is low compared to most countries. The average in the EU is 21.6%, about 17% higher than the UK.
UK GDP was around £2,500 billion in 2022.[2] Investment therefore ran at about £460 billion in that year.
Most of that money was spent by the private sector. Government investment was approximately 2.8% of GDP in 2019. If this share has remained the same, it represents be around £70 billion in 2022. The OECD average for public investment as a percentage of GDP averages around 3.2%.[3]
· The estimates of how much extra investment the UK needs for infrastructure: National Infrastructure Commission (NIC) study, October 2023[4]
This study suggests the following requirements for the UK energy system on its trajectory to full decarbonisation by 2050. (A summary table is below).
o £20-£35 billion a year of private investment between 2025 and 2050 for decarbonisation and increased electricity supply. This seems to cover power generation, transmission and distribution as well as a carbon capture network and hydrogen production, storage and transmission.[5]
o £5.1 billion of public funding between 2024 and 2030 (7 years) on the Social Housing Decarbonisation Fund to improve insulation standards. This equivalent to about £0.7bn a year.
o £8.8 billion of private investment, although mandated by government, to install insulation improvements in low income households between 2024 and 2035 (12 years). This amounts to about £0.7bn per year.
o £28.9 billion of public investment in improving the energy efficiency of public buildings, spread over the 2024 - 2050 period, but with 75% (£21.6bn) spent prior to 2035 (12 years). Between 2024 and 2035, this is £1.8 billion a year.
o £33.8 billion of public funding between 2024 and 2050 to deliver low carbon heat for social housing of which 35% is spent before 2035 (12 years). This amount would provide about £1.0 billion a year.
o £41.7 billion of public investment to help subsidise lower income households decarbonise their heat supply, principally by installing heat pumps. 35% should be provided by 2035, implying expenditure of about £1.2 billion a year.
o Public subsidy of £7,000 per new heat pump installed between 2024 and 2035. The National Infrastructure Commission targets 7 million installations before the end of the period, implying a total subsidy of about £4.1 billion a year.
o The NIC also recommends a scheme offering the buyers of heat pumps a zero interest loan. The cost of this is not calculated in the report so I use the following assumptions: 5% cost of interest subsidy, an average debt of £3,500, 7 million installations by 2035. This costs the government about £1.2bn a year.
o To get to 300,000 public EV chargers by 2030, the UK will need about 35,000 new chargers a year. Making the crude assumption that 20% will need to be rapid chargers (50 kW or more at £30,000 installed cost) and the rest slower (7 kW+, averaging £8,000), very approximately the cost will be £0.45 billion a year.
The table below summarises these cost estimates.
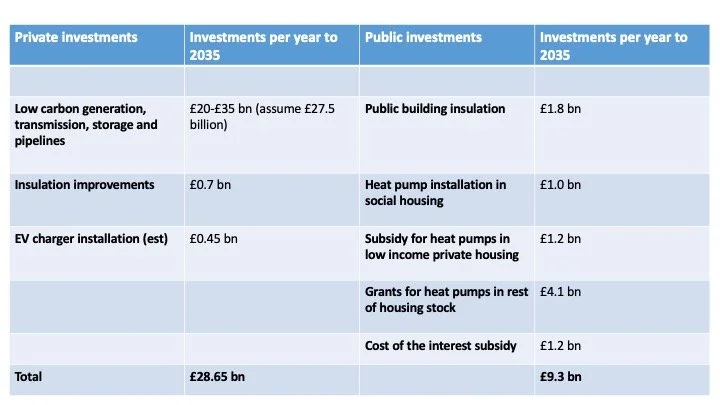
Source; analysis and estimation partly using NIC data
Combining both public and private investment, the NIC is suggesting a figure of around £38 billion a year between now and 2035 to transform the energy system. This is approximately 1.5% of national GDP. If achieved, the UK would still sit well below the average investment ratio of EU economies. Public investment, now running at around £70 billion, would rise about 13%, or approximately to the same level as the average for the OECD.
· Other assessments of how much will be needed in investments in the energy system
Are the NIC assessments reasonable and well-supported? The data in the report is extremely sparse, particularly on the estimates of £20-£35 billion a year for the transformation of energy supply and storage. For example, there's absolutely no analysis of the amount of battery storage required or its price. Important questions like the direction of the cost of offshore wind are ignored. So we have considerable reason to be doubtful of the quality of the numbers provided.
One potential check is to make estimates of the money required just for the construction of electricity generation and the improvement of electricity networks. The government targets 50 gigawatts of offshore wind by 2030 and 70 gigawatts of solar by 2035. (Each of these two types of generation have about 14 gigawatts of UK capacity today).
o The cost of offshore wind. About 5 gigawatts a year are targeted between now and 2030. The cost of offshore wind is about £3m a megawatt at present, implying a total cost of around £15 billion a year. Any onshore wind would be additional.
o Solar will need to rise by about 3 gigawatts a year. It costs about £700,000 a megawatt in late 2023 if installed on open land. That is about £2 billion a year.
o National Grid estimates that the amount of capital investment required to connect the new wind farms to the high voltage network will be about $21.7 billion before 2030, or £3bn a year.
These three items add up to £20 billion a year. In addition, there will need to be extensive battery farms, hydrogen production, new distribution infrastructure on the lower voltage grid and many other improvements. These will almost certainly take investment needs up to £35 billion or beyond. So the NIC estimates are probably too low.
· The other sectors covered by the NIC
Transport and environmental resiliency are the other main sectors covered by the NIC 2023. It estimates that transport improvements will demand £28 billion a year between now and 2050. Much of this cash will need to be spent on the obviously necessary improvements to public transport, particularly in cities.
Environmental resilience, particularly against flood and drought will require £8-12 billion a year from the private sector and another £1-1.5 billion from public funds.
In total, the NIC's report suggests a need for around £39 billion of private investment each year and approximately the same amount from government. In total, this is over 3% of national income and, if carried through, would take the UK up to around the EU average for investment as a share of GDP. This looks possible. However inside this total the NIC is proposing an increase in public investment of more than 50% in the next few years, which seems a more challenging task.
· Capital needs not covered by the NIC
In addition, we know that several other sectors, such as water supply and treatment, that are not covered by the NIC will also need major additional tranches of new capital. For example, the water companies have bid for the right to invest £96bn over the five year period of 2025-2030, almost double what they are currently investing.[6] The request is therefore for an investment of £19 billion a year, or almost 0.8% of GDP.
Add in other sectors requiring more capital, such health care provision, and the percentage of UK GDP devoted to investment will probably need to rise by at least an additional 5%, adding nearly a quarter to total capital spending. This will be an unprecedented change in the economy, temporarily reducing the amount of money available for immediate personal consumption.
[1] Source: World Bank, https://databank.worldbank.org/source/world-development-indicators/Series/NE.GDI.TOTL.ZS
[2] Source: House of Commons Library, https://commonslibrary.parliament.uk/research-briefings/sn02783/#:~:text=In%20the%20latest%20calendar%20quarter,£2%2C506%20billion%20in%202022.
[3] Office for Budgetary Responsibility; https://obr.uk/box/international-comparisons-of-government-investment/
[4] https://nic.org.uk/app/uploads/Final-NIA-2-Full-Document.pdf
[5] Data is from page 16 of the report.
[6] https://www.water.org.uk/news-views-publications/news/water-companies-propose-largest-ever-investment
Wholesale electricity prices are lower when the wind is blowing hard. This is true across the year. If the UK installs more turbines, there will be more wind power at all times, tending to further pull down the cost of electricity for all.
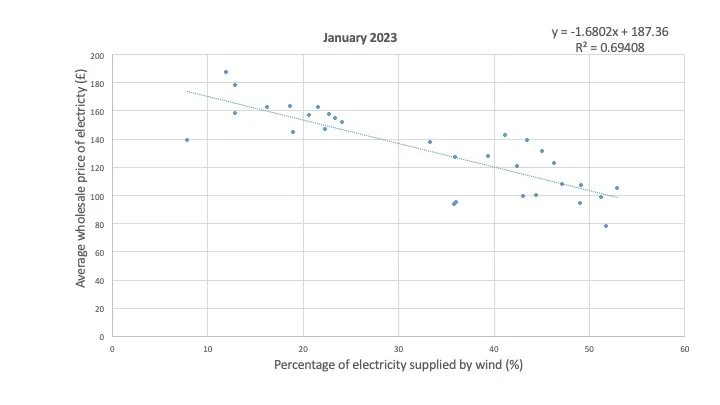
How much might electricity consumers benefit if the country added more wind capacity? I looked at the data for the last 12 months and found that just by adding the turbines that are already planned the UK might save over £3bn a year in electricity costs. This calculation is based on the assumption that the relationship over the last year between wind output and wholesale prices persists into the future. Increasing wind capacity still further could add to these savings.
Put another way, the UK government's net zero rollback, and its reluctance to liberate onshore wind, will cost people money.
The analysis
Across the year, the correlation between wind speeds and power prices is reasonably robust. Why is this the case? If wind power is abundant only the most efficient gas power plants need to operate and they bid into the hourly power auctions at a lower price than the older and less efficient stations. And windy conditions in the UK usually mean that it's windy elsewhere in Europe, which also helps reduce the prices of electricity coming into the country through undersea connectors.
To give one example, the average price on the Nordpool 'day ahead' exchange was £81.6 per megawatt hour on December 30 2022 when wind provided the largest percentage of UK electricity of any day in the last year.[1] One day later and the price was £130.6 as a result of wind cutting its contribution to little more than half the level of the previous 24 hours.
Wind provided about 26.8% of all UK electricity in 2022.[2] The new turbines already planned would increase that by about 24%.[3] If the wind farms match the productivity of existing turbines, that means the amount of electricity generated will be about 24% higher than today. This will push prices down. My analysis suggests that if the last year's patterns were repeated the average price of the electricity sold on the wholesale market might fall by 10.5% when these wind farms are complete. Further increases in wind capacity would proportionately increase this saving.
Much of the UK's electricity consumption is bought and sold on the wholesale market. My analysis uses data from the Nordpool 'day ahead' exchange. But large amounts of power are bought and sold via other mechanisms, such as direct power purchase agreements or longer term contracts. Of course the wholesale price of power does not directly affect these agreements. But in the course of time lower 'day ahead' wholesale prices will change the price in all contractual agreements.
If all electricity prices fell by the 10.5% estimated in the previous paragraph as the consequence of the planned wind expansion, the eventual reduction could cut the total cost of electricity by about £3.3bn a year. Of course we cannot be sure that the correlation between wind availability and power prices will continue to hold but it is a plausible possibility.
My purpose in calculating these numbers was to quantify the possible beneficial impact from increasing the amount of wind power available on the UK grid. This is a social and a shared value resulting from the private investment in new wind turbines. In addition, there is a gain from the reduction in carbon emissions.
We should put these possible savings in context. The 6.7 gigawatt already-planned expansion in UK wind power will cost private capital about £10 billion, assuming a 50:50 mixture of £1m per megawatt for onshore and £2m for offshore wind. The £3.3 bn saving in wholesale prices as a result of this investment is a profoundly attractive social return (in addition to the private profit return arising from the £10bn spent on expanding wind availability.
Apppendix
These are outline details of the method I used.
· For each day in the year to the end of September 2023, I noted down the average daily price of electricity on the Nordpool 'day ahead' wholesale market, expressed in £ per megawatt hour. (To avoid any accusations that I broke Nordpool's rules by using automatic copying of its data, I took down each number manually).
· For each of these days, I also noted the percentage of the UK's electricity that was generated by wind. I used the numbers from the Gridwatch web site, copying each figure from the charts on its main page. (These numbers exclude the electricity generated by smaller wind farms not connected to the high voltage National Grid network).
· I then divided the year into months because electricity consumption and production patterns vary through the year. And, particularly in the last year, rapidly varying gas costs have strongly affected the price at which CCGT suppliers are willing to supply power into the UK at different times.
· For each month in the year, I constructed a chart that plots the percentage of power output provided by wind and the average price for each day on an x-y chart. The wind percentage sets the position on the x axis, the average price on the y axis.
· I then asked Excel to calculate the line of the trend for each month.[4] The equation for the trend line predicts the value of y (the price) dependent on the percentage of electricity provided by wind and a base number that estimates the price if there had been no wind during that day. For example, the equation for January 2023 is y = -£1.6802x + £187.36. This indicates that if there had been no wind on a day during that month the price would have been expected to be £187.36 per megawatt hour. Each one percentage point increase in the percentage of power provided by wind typically reduced the wholesale price by £1.6802.
· The January 2023 chart is shown again below.

The value called R2 on this chart is a measure of the closeness of the correlation between the two variables. A perfect correlation, in which y values are 100% determined by changes in the x number produces an R2 figure of 1. A complete absence of correlation results in an R2 of 0. The actual figure of 0.69 for January suggests a moderately strong but not complete link. The average across all months was lower at 0.47, implying that factors other than wind also had substantial effects on the electricity price.
I then took the average wind percentage for each month (it was 33% in January) and increased this figure by 24%. Why 24%? Because current total wind capacity is about 26.9 gigawatts and an additional 6.7 gigawatts are now planned to be installed, or 24% of today's total.
I used the trend line for each month to estimate how much of a reduction in the wholesale price would be obtained by increasing the percentage of electricity that is delivered by wind by 24%. This pushes up January 2023 from 33% to just under 41% of total supply. Using this trend line, the average wholesale price would fall from about £131.9 to about £118.6, a saving of approximately 10%.
The implication of this number is that the total cost of the electricity supplied in the specific month of January 2023 would have been 10% lower if all the planned extra 6.7 gigawatts had already been installed. The percentage across all the twelve months ranged from 1.1% in May 2023 to 22.2% in the extraordinary month of December 2022 when gas prices reached historic highs. The average across all 12 months was similar to January's figure at around 10.5%.
I continued this exercise by calculating how much might have been saved in terms of £ across the year if the extra wind capacity had already been in place. National Grid provides each month a figure for the amount of electricity that flows across its network.[5] We can use this estimate as a way of calculating the savings from having more wind power in the UK by multiplying the amount of electricity used by the prospective savings in £ per megawatt hour. January's figures would have resulted in a total saving of over £100 million.
The total cost reductions from having 24% more wind across the 12 month period might have amounted to over £3.3billion, or about £50 per head of UK population. However this figure would have been concentrated in the months of October 2022 to January 2023. The savings in May 2023 could have been as low as £18m, compared to the £billion plus in December 2022. This a reflection of the very low correlation of wind power and wholesale prices in May 2023 compared to the other months.
The May 2023 (lowest R2) and December 2022 (highest R2) charts are shown below. May was a period of relatively low gas prices by recent standards while December's were astronomically high. It looks as though wind power has more effect on the wholesale price of electricity when gas prices are elevated. This may mean that if gas prices revert to historical averages the deflationary impact of wind will be reduced.
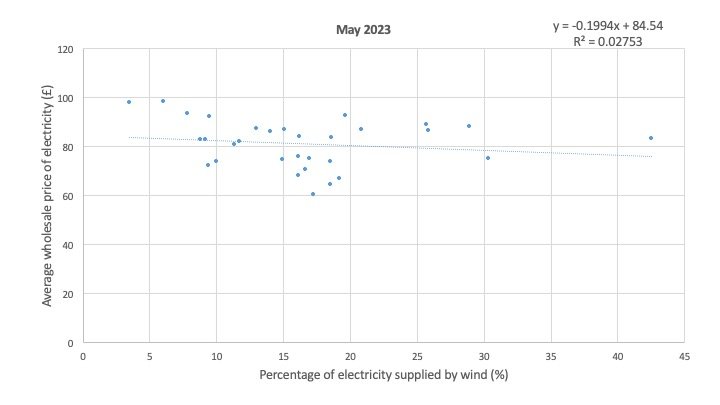
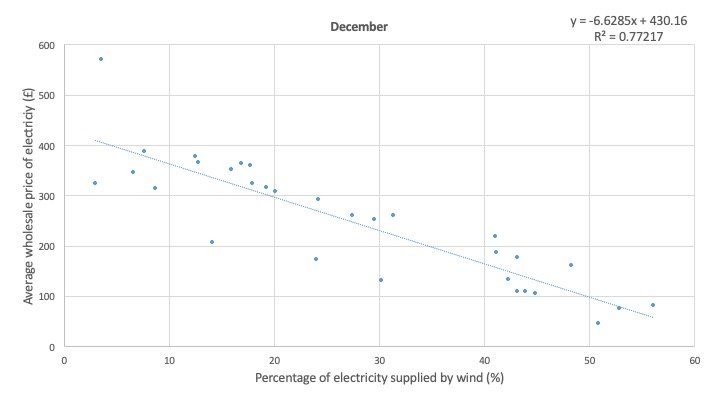
Next steps and issues with the analysis
Solar power should be added to the analysis because it also tends to push down the wholesale price of power, particularly on sunny summer afternoons.
It would be better to split each month into weekdays and weekends to ensure that the different demand patterns are properly reflected in the analysis.
I should normalise the data to take out the effects of changing gas prices on the wholesale price of power.
The core hypothesis in this analysis is that wind power, which has no measurable cost to produce, deflates the overall market price when it floods on to the networks. This is highly plausible, but we cannot be sure that further increases in wind power will continue to deflate wholesale prices.
At some points during very windy weather the UK already has enough renewable electricity to need no fossil fuel power. Gas is still being consumed in order to have a dispatchable power source that can be quickly varied. If we add a lot of new wind power, some of this electricity will have to be curtailed implying it will have no effect on wholesale prices.
It could be that the deflationary impact of high winds arises largely because the continental European price of power is being driven at the same time, flooding the UK interconnectors with cheap electricity. If the UK increases its wind capacity this will leave European prices unaffected. In other words, the increase in UK turbines may have less effect on power prices than I am calculating.
On the other hand, the most obvious downward effect of high winds on the UK power market occurs when wind supplies more than 45% of electricity needs. Any increase in wind capacity will make those events more frequent and so tend to exaggerate the impact on wholesale prices.
[1] The day ahead contract is the price agreed between buyers and sellers for the delivery of electricity in one hour periods on the following day. This market operates for seven days a week.
[2] Source: National Grid, https://www.nationalgrideso.com/electricity-explained/electricity-and-me/great-britains-monthly-electricity-stats
[3] I'm not sure whether or not this figure includes the wind farms that are currently on hold because the developers are unsure whether to proceed after facing much higher costs. I'm assuming that the wind farms waiting to be built are equally productive as the existing stock of onshore and offshore turbines. This is probably a pessimistic assumption since turbines are becoming larger and generate more electricity.
[4] Using linear regression.
[5] This is not a perfect proxy for the actual amount of electricity produced. Some electricity, such as that delivered by solar farms and small wind farms, does not travel on the National Grid high voltage network but stays on the local lower voltage distribution systems.
Most of the largest European steelmakers are planning for the conversion to the use of hydrogen rather than coal. This article looks at the efforts of Salzgitter, the second largest German manufacturer, to decarbonise its production capacity. The rapidly developing plans involve the construction of 'direct reduction' furnaces, electric arc furnaces, the supply of hydrogen and the purchase of higher quality iron ore from Canada.
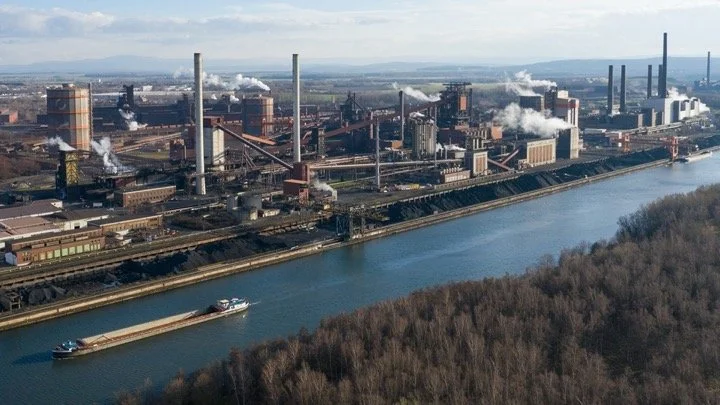
By 2025 Salzgitter intends to have an output of 1.9 million tonnes of steel made using hydrogen. Its total production at the moment is about 7 million tonnes. (World production of steel, mostly in China is just under 2 billion tonnes). Salzgitter's full conversion to hydrogen and electric arc furnaces is planned by the mid 2030s.
Direct reduction using hydrogen
Most new steel ('primary' steel, not scrap metal recycled in an electric arc furnace) is made in blast furnaces in which iron ore is mixed with coking coal. The coal both heats the ore and strips it off the oxygen in the ore, leaving raw iron. About two tonne of CO2 emissions result from each tonne of new iron produced, meaning that steel contributes about 8% of total global emissions.
Hydrogen can replace coal, dramatically reducing CO2 output from steel production. The process is called 'direct reduction' of iron or DRI. We know DRI is highly likely to work because a very similar process is used in some parts of the world, including India and Iran, that uses syngas (H2 and carbon monoxide) made from natural gas. Almost 40 projects in Europe are now planning to shift to pure hydrogen DRI, which will emit only water. (By the way, there's been very little progress in the UK compared to the rest of Europe). A DRI plant produces a form of iron, which is then converted to steel in an electric arc furnace.
Salzgitter
Salzgitter makes steel in the town of the same name in Lower Saxony in central Germany, close to Hanover. The business is sited there because of the existence of a local iron ore seam that is no longer mined. The huge furnaces on the site are responsible for about 1% of Germany's total emissions.
The steel producer began work on low carbon steel making in 2015, testing out hydrogen production made with local renewable electricity. One critical step it took in mid 2022 was to commit over €700 million to the first phase of its full decarbonisation. This commitment was made on the basis that German governmental support would also be forthcoming. The company's contribution was eventually upped to over €1 billion.
Recent events
The last few weeks and months have seen an extraordinary flurry of announcements from Salzgitter covering funding, electricity and hydrogen supply and iron ore provision. The planning and preparation for the conversion to DRI have taken sudden leaps forward.
· Funding. The German government and the state government of Lower Saxony promised around a billion Euros for the first phase of the project on 18th April 2023. The intention is to convert about 1.9 million tonnes of production capacity to hydrogen DRI by the end of 2025. The total cost for this part of the decarbonisation is expected to be almost 2 billion Euros, or about a billion Euros per million tonnes of yearly steel output. (This is roughly equivalent to the expected investment cost per tonne of steel at H2 Green Steel, the new company using hydrogen in northern Sweden). For this money, the owners will get two direct reduction and three new electric arc furnaces.
· On 20th April Salzgitter and Iberdrola Deutschland announced that the steel company would take the output of 114 MW of Iberdrola's new offshore wind farm 'Baltic Eagle' that is schedule to go online at the end of 2024. The output from these turbines will provide approximately half a terawatt hour of output, which is probably about 7% of the Salzgitter's first phase needs.
· Salzgitter and gas distribution company VNG said on 17th April that they were jointly investigating the connection of Salzgitter into the planned European hydrogen grid that will allow production in low cost locations to be brought in a pipeline to the DRI plant.
· In February, the steel company and Canadian iron ore producer Baffinland announced plans to work together to deliver iron ore to the DRI plant. DRI requires ore with higher concentrations of iron than are typically currently used in most world steel making. Baffinland, partly owned by competitor steel company ArcelorMittal, has ore that reaches over 66% iron content. The announcement of the cooperation with Baffinland comes after an investigation with the world's largest ore producer, Rio Tinto, in 2022 that perhaps has concluded that most of its output does not meet the quality required for DRI.
· In early 2022, Salzgitter and German utility company Uniper agreed to supply hydrogen from a proposed new hub at the port of Wilhelmshaven. This will both use electrolysers to make H2 from offshore wind but also convert ammonia shipped into Germany back into hydrogen. Uniper is also planning a hydrogen-making plant in the port of Rotterdam district using offshore wind electricity that will connect into the European gas grid to supply Salzgitter.
The last few weeks have seen much commentary on the withering of 'hydrogen hype' as the difficult realities of conversion become clearer across multiple industries. Salzgitter's growing commitment to full decarbonisation and the development of a full supply chain for iron ore and hydrogen suggests that at least the steel industry is moving ahead rapidly, probably made more confident by the EU's Carbon Border Adjustment Mechanism.
Steel is likely to be most important single user of H2, with a probable demand of at least 150 million tonnes a year after full decarbonisation. (Most forecasts see a total need for hydrogen of around 500 million tonnes in 2050, although the total amount used for electricity 'storage' is still very unclear).
One concern must persist. Salzgitter is not in the best location for either iron ore or cheap hydrogen. My guess is that, as H2 Green Steel In Sweden says, it will be far better to be in an area with either very cheap renewable electricity - which Germany is not - and close to high quality ore. Once again, German locations fall short. Salzgitter's inland location creates a further disadvantage.
In any event, government support for the transition is probably vital. The German state and Lower Saxony are putting up about 50% of the required capital investment and most other steel producing countries look as though they expect to fund similar amounts across Europe. Those of us who live in Britain should be deeply concerned at the apparent block on grants to UK steel producers to ease the transition to hydrogen.

A ghostly image of Margherita Sarfatti (1880-1961), a remarkably interesting Italian intellectual, known mostly because she was the lover of the Duce, Benito Mussolini, at the beginning of his career. She might have been much more than just a lover, and she may have played an important part both in Mussolini's successes and in his eventual downfall. Margherita Sarfatti makes a cameo appearance in my novel "The Etruscan Quest" and, here, I expand my interpretation of her role in history by proposing that she may have been one of the causes, perhaps the main one, of the doom of her former lover. Of course, I cannot prove this interpretation, but I can at least say that it cannot be disproven, either. As for many things in history, truth is now with the ghosts who lived the events that we read about. So, why not try to ask them?
Ah.... sorry, Ugo, I didn't want to scare you.
No... no, I am not scared. Just a little surprised. Who are you?
Don't you recognize me? I know that I am all white and a little transparent, but maybe you can.
Hmmm.... not sure. Did we ever meet before?
In a way, yes. I am a character in your novel, "The Etruscan Quest" Actually, not just a character. But I do appear in your story.
Now that I look at you, well, maybe yes. You look like... a lot like.... a portrait I saw. Are you Margherita Sarfatti?
Yes! That was very good, Ugo!
Well, as I said, I am surprised, but I do recognize you. It is a pleasure to meet you, Donna Margherita.
You don't have to call me 'Donna Margherita.' Just Margherita is fine. Where I am now, certain things are not important.
I imagine not. But I hope you were not displeased by what I wrote about you in my book.
Not displeased, Ugo. I liked what you wrote. So, I thought I could pay you a visit.
Ah... thanks, Margherita. It was a pleasure to write about you. Although, of course, it was just a cameo role in my novel.
I know. Yes, but it was nice of you. You wrote good things about me. Though, I think you were missing something.
Mmm.... maybe I understand. But I didn't know if I had the right answer to the questions I had.
Well, now you can ask me. Wouldn't you?
Yes, it is a remarkable chance. Even though I guess you are just a mental projection of mine.
Maybe. Or maybe I am a real ghost; how can you tell?
Whatever you are, Margherita, there is this nagging question that I have had in mind for a long time. And I think I can ask you about it. What happened to Mussolini that made him change so much in the 1930s? I mean, from a shrewd leader to a stumbling boor? How did he get involved in this mad idea of rebuilding the Roman Empire?
And, Ugo, if you are asking me, I think you believe I have the answer, right?
Well, yes. After all, you were placed in a position where you could know things nobody else knew. The lover of the Duce; you had access to the highest ranks of the government. And you were even received by President Roosevelt in 1934.....
But if I am just a projection of your mind.....
You are teasing me, Margherita.
Ah, sorry, Ugo. Well, after all, it doesn't matter if I am a ghost or just part of your mind. You never know what the boundaries of one's mind are. And in Hades, we may know things that living people can't know. So, let me see if I can answer your question. For that, I have to start from the beginning. And, please understand that this story is still painful for me. So far, I never told it completely to anyone.
It is an honor, Margherita. I appreciate it.
Thanks, Ugo. I know that you do. So, you know that I was Mussolini's mistress for more than 20 years; from when he was an unknown journalist up to when he became the "Duce degli Italiani". He changed so much in those 20 years. And then he dumped me for a younger woman. I think it was in 1932 that he met her, Claretta Petacci was her name. See? Even as a ghost, you can be upset. That is why ghosts are said to howl in desolate places, clank chains, and things like that. I am not doing anything like that, but if I remember this story.... well. Think about how many things I did for Benito. I found money for him, invented slogans for him, taught him how to deal with powerful people, even table manners. And do you know who invented the term "Duce"?
But wasn't it invented by Gabriele D'Annunzio?
Yes, D'Annunzio used it. But the idea that Benito should use it as a title was mine. And it was so successful! Incredibly so. By the 1930s, everyone was using it in Italy. And that was bad for several reasons. Anyhow, let me go back to your question. Yes, Mussolini was a shrew leader when he became Prime Minister in 1922. Everything he touched seemed to be a success. And then, everything changed. But to explain how it happened, I must tell you a few things about earlier times. First of all, do you know that Mussolini was a shill for the British Secret Service?
It is known. Historians agree that he was paid by the British as a propagandist to push Italy into the war against the Central Empires.
Yes, he did. And have you ever wondered why the British came to choose him?
Good point, Margherita. I hadn't thought about this.
Well, you should have. The story is that in 1912 I met Benito for the first time when he was the director of the "Popolo d'Italia." He was a fascinating man; he had an inner force; unusual. I have to tell you that I fell in love with him. Desperately in love, it happens. But I also thought that all that force could be directed to something useful. So, in 1914, when the Services contacted me....
The British Secret Service? But why you, Margherita?
Shouldn't it be obvious? Don't you know that I can speak five languages?
Yes, I knew that, but....
My family. They were international bankers, industrialists, traders... We had connections everywhere. And you also know that we were a Jewish family.
I knew that, too.
Well, so, no surprise that I had many connections. In business, and also in politics. So, you could say that I was a shill for the British, too. But don't misunderstand me. I am Italian; I did what I did because I thought that it could help Italy -- but also Britain. Britain and Italy were sister countries at that time. I saw nothing wrong with helping the British get a little help from Italy in their fight against Germany. And so I told them of this young journalist, a smart man, a person who could help them.
I see.... this is not written in the history books.
Of course not. But if you ask yourself the right questions, you can find good answers. Benito spoke no English; he wasn't known at all outside Italy. He was, by all means, a small player in the great game. There had to be a good reason why the Services looked for him.
And that was you, Margherita. I am amazed, but it sounds true.
Indeed, Ugo, indeed. Benito accepted to work for the British. He did that for the money, but it was also a shrewd decision for him. He knew that he could use the support of the Services to make a political career in Italy. Shrewd and lucky at the same time. You know that he was drafted into the army in 1915, right?
I know, yes. He wrote a diary of his experience in the war.
The army treated him as a useful asset -- they didn't want him to die. So, they sent him to a quiet area of the front. But it was still dangerous, and he was lucky enough that he was wounded by an Italian gun that exploded near him. It gave him the fame of a war hero. Shrewd and lucky, as I said.
Yes. Lucky, but only up to a certain point.
Ah, in life, it is not such a good thing to be lucky. If you are, you arrive to think that you deserve to be lucky.... and that's what happened to Benito. But let me go in order. You know what happened after the war was over, right?
Of course I know. The years of civil strife, then the March on Rome. Mussolini taking power....
Yes. And the Services played a role in that, too. Obviously, they didn't want Italy to fall into the hands of the Bolsheviks, and they didn't want it to collapse again into statelets. We arrived close to that. So, they helped Benito to take over. It was part of my task, too. You know, my family was rich, but still I needed money. And the Services were not stingy. They understood that Benito badly needed me to set up his plan.
You won't find that written in the history books.
No, of course not. But there are many things not written in history books that are true, nevertheless. But let me continue. The March on Rome was a success; the King of Italy made Benito Prime Minister, then he gradually gained more and more power. Things were going well. Italy was recovering from the disaster of the Great War, the economy was expanding, the civil strife had disappeared, and many good things were done by the Fascist government. Yes, they had not been light-handed when they took power, but it could have been much worse. I had no official position in the government, but as the Duce's lover, I had a lot of influence in many things. And I could indulge in my passion: art. I was collecting artwork, setting up a coterie of top-level artists; I could say that life for me was fine in the best of words, or almost so. And I was still in love with Benito. Yet, I could see that something was not so well. Dark clouds at the horizon, if I am to use the imagery I read in your novel.
Oh... sure, in my novel, there is a discussion on the haruspices being able to interpret the signs in the sky.
Yes. I could say that I was seeing ominous signs in the sky. At some point, I started thinking that there was something wrong with the whole story. Simply said, Benito was gathering too much power. There was this idea that "Mussolini is Always Right" -- it started as a joke, but then people started believing in it for real. And then there were the elections of 1929, where there was only one party you could vote for, and there was a "yes" already printed on the ballot. No wonder the Fascists won with more than 99% of the votes. But that wasn't the way to go. It was a dangerous road, too much power in the hands of a single person. I tried to tell Benito, but he won't listen to me. By this time, he was already changing. He had always been.... how to say, "strong-willed," maybe. By then, he was simply stubborn and believing only in himself.
The way he is often described....
He had not always been like that, Ugo. But yes, things were going down a slippery road. In parallel, there was that odious man, Adolf Hitler, who was taking power in Germany. And the British were starting to understand that, with Mussolini, they had created a golem that they couldn't control anymore. Do you know the story of the Golem, right?
Of course. The monster created by the Rabbi of Prague.
So it is. When people have power, they tend to create monsters that they can't control. Maybe I had that power when I created the Duce...
Margherita, I do think you did that with good intentions....
.... and the road to hell is paved with good intentions. Anyway, let me continue with the story. In 1932, I turned 50, and I discovered that I had become too old for Benito. He was three years younger than me. He met that woman, Clara Petacci, and he wasn't interested in me any longer. But that wasn't the worst thing. I was losing him -- sometimes he was still listening to me, but mostly he would just do what he wanted. Any idiocy that came to his mind was immediately hailed by his coterie as a great strategic insight. And he was fascinated by that other golem in Germany, Hitler. At that time, I met my contacts in the Services, and they told me about their plan. Just like the Rabbi of Prague destroyed his golem, the British had concocted a plan to destroy the golem called Benito Mussolini.
Ah... Margherita, that sounds fascinating. And what was the plan?
It was simple, but well thought out. These people, you could say that they were evil, but you can't say they are not smart. So, they started with the fact that Italy had a small colony in the Horn of Africa, Somalia; they had conquered it in the 19th century. But the region also had a British colony and a French one. And the only African land that was not in European hands, Ethiopia, was right there, at the border with Somalia. It was still ruled by the king of kings, the Negus Neghesti. Italy had tried, once, to expand in Ethiopia, but they had been defeated at the battle of Adua, back in 1886.
I know this story. I guess the Italians wanted revenge for that defeat, right?
Yes, there was this idea of getting revenge, but it wasn't considered an important thing. Ethiopia had never been part of the propaganda baggage of the Fascist party. Benito barely knew it existed, and he had never mentioned the story of Adua in his writings. It was something dormant. I would call it a dormant evil. But the British had focused on that. I think they specialize in evil. See, the idea was to convince Benito to seek revenge for the defeat of Adua.
And how would that be useful to them?
Simple, as I said. The idea was to push the Duce to attack Ethiopia. And for that, he would have had to assemble a large force: men, equipment, and resources committed to a remote land. Then, of course, the Ethiopians would resist, and Italy would be forced to commit even more resources to the task. And, while the fight was going on, the British would intervene with a naval blockade. They could do that easily; the British rule the waves, don't they? No way for the Italian navy to contest that. And, without the possibility of resupplying the army in Ethiopia, the Italians would have had to surrender. Maybe the British would have graciously intervened to save the poor Italians from being exterminated by the angry Ethiopians. And that was the basic idea: the Duce would lose face; then, he would have had to resign. Job done.
The Perfidious Albion; as they say about Britain.
Indeed, perfidious. But that's the way they operate. There is a reason why Britain has been ruling the waves for so long. There are things I know that you can know only from this side.... But I think it is better if I don't tell you. Anyway, let me continue with this story. I thought the plan was elegant. It implied some bloodshed, of course, but it might have prevented a much worse disaster later on. So, I enthusiastically accepted to cooperate. And you may ask now who had this idea of the new Roman Empire that would be created by the conquest of Ethiopia.
I can guess that, Margherita.....
Yes. I concocted this absurd idea that Italy could rebuild the Roman Empire by conquering a country that had never been part of the Roman Empire. I thought of it mostly as a joke, but people believed it! It was all over the place. Everyone was saying that, and everyone was convinced of that. You have that thing you call "Ngrams," don't you?
We have that. I am surprised that you know about that, Margherita.
Why surprised? We ghost know a lot of things. But never mind that. You can use Ngrams to see how certain ideas penetrate the public consciousness. And if you look up the word "Ethiopia," you'll see how it picked up interest all of a sudden around 1932. At my time, I didn't need Ngrams. I was one of the sources of this propaganda operation and I could see how things were moving. I had the Italian secret service passing to me their reports. They were going to the Duce, too, but he wouldn't read them, and if he did, he didn't care so much. But I did. The idea of attacking Ethiopia truly exploded with the public. You have a term for this kind of thing, right?
Yes, we call them "psyops."
That is a nice term. We didn't have it, but we knew how to set certain things in motion. I was not the only one working at that, of course. The British government did a good job by signing a memorandum of understanding with the Italians, where they said that if Italy attacked Ethiopia, Britain wouldn't move a finger to help the Ethiopians. The Perfidious Albion, indeed. Anyway, I do think I played a role in convincing Benito that conquering Ethiopia was a good idea. I even hinted that he could become the new Roman Emperor. 'Benito Caesar,' or something like that. And I think he believed me! How silly men can be! I wrote a lot of propaganda to favor the intervention; you can still find what I wrote. You have this thing you call "The Web."
Yes, Margherita. I read something you wrote about Ethiopia. I commented by saying that it was the best piece of propaganda ever written.
That was kind of you.
No.... you were really great. Although I would say....
.... a little evil, maybe?
I wouldn't say exactly that, but....
Ah... Ugo, I am ashamed of some of the things I wrote. But I did believe that I was acting for a good purpose. Anyway, I was heavily engaged in this propaganda operation. In a sense, it was fun: these things get you engrossed. I even went to meet President Roosevelt in 1934. You may have wondered how it was that he received me as if I were a head of state, even though I had no official role in the Italian Government. It was because of the plan. In 1934, it was in full swing, and Roosevelt wanted to know about it from me. Not that I was the only source of information for him. But he asked me a lot of things, and I understood that there were things that I had not been told about the plan. Much darker things than what I knew. But Roosevelt didn't tell me much. I was dismissed, and I went back to Italy. I went to see Benito, and he was suspicious about me, about the British, about the Americans, about everyone. It was a critical moment...
Maybe you could have told him about the plan?
Sure: the perfect way to have me shot by a firing squad as a traitoress. But I could have done that if I thought he would have believed me. But, no. He has already arrived at the stage where he would believe only the things he wanted to believe. I found that my propaganda operation had gone so well that it had affected him, too. He was convinced that Italy could become an Empire again by conquering Ethiopia. Fully convinced. He had swallowed that, as they say in Britain, "lock, stock, and barrel." In a sense, it was a success for me. But it was one of those successes that count as defeats. That day, I saw myself as a relic. Whatever I had done was done; from then on, there was nothing anymore I could do. I remember I left Benito's Palace, "Palazzo Venezia," thinking I would never set foot there again. And I didn't. I came to know that he had instructed the guards at the entrance to deny me entrance if I were to appear.
Again, Margherita, a fascinating story. But the plan didn't work as it was supposed to work, right?
No, it worked exactly the way it was supposed to work. Just not the way I was told it would. In 1935, Italy attacked Ethiopia, and the war started. I was expecting -- hoping -- that the British navy would start the blockade, but I knew that the plan was more devilish than that. The British did nothing to help the Ethiopians, but they enacted economic sanctions against Italy. It had no effect on the war, but it was as if they wanted Italians to get mad at them. And they succeeded at that: The Italians were raving mad at the British. You should have been there to understand.
I read something about that, yes.
Then, Ethiopia surrendered in 1936, and the king of Italy became "Emperor of Ethiopia," and no one found that silly. It was an incredible success for Benito. He was loved, adored, nearly worshipped. People really believed that Italy had become an Empire again. And that Italians were going to trash those decadent plutocracies of Northern Europe, including their Jewish masters.
It was hard on you, right?
Yes, even though I had converted to Christianity, I was still considered a Jew. Even by Benito himself. You know what he wrote about me? That I was smelling bad because I was a Jewess.... that kind of man, he was.
I am sorry about that, Margherita.
You don't have to be sorry, Ugo. It is the way things went. Anyway, the naval blockade of Ethiopia was still part of the plan; it was just postponed. It was enacted in 1941, after Italy declared war on France and Britain. And things went as planned. Italy had 250,000 troops in Ethiopia, they couldn't be resupplied from the mainland. They soon surrendered; what else could they have done? An easy victory for the British, and a terrible loss for Italy. Those troops could have changed how the war went if they had been available in Europe.
So, it was a plan.... I hadn't thought about that, but it makes a lot of sense. It was a truly devilish plan by the Perfidious Albion.
Yes, you see, they didn't just want to get rid of Mussolini. They wanted to destroy him and make sure that Italy was thoroughly destroyed, too. No more a threat to the British Empire. It worked incredibly well. Of course, it was possible only because Benito was so dumb. But it was not just him. You see, propaganda is a beast that's nearly impossible to control. You sell dreams to people, and people become enamored with their dreams. And every attempt to wake them up fails or, worse, makes them angry at you.
I know. You risked your life in 1938.
Yes, it was very hard for me. With the racial laws, I was targeted directly as a Jew. Fortunately, I could run away from Italy fast enough. And you may wonder how I could do that.
Your friends in the British Secret Service, right?
Yes. They helped me run away to France and from there to Argentina. They gave me a pension, and the agreement was that I shouldn't tell anything to anyone about the plan. The Italians agreed that that was the best way to get rid of me. Better than a bullet into my head -- it could have raised suspicions. And it was fine for me, too. Even if I had told the story of the plan, who would have believed me? I can do that only now, when I am a ghost. I was lucky, most of the Italian Jews were not so lucky. My sister Nella was deported to Auschwitz in Germany, and she was killed there.
I am sorry about that. But can I ask you a question, Margherita?
Of course, you can.
Did you really believe in what you were doing, Margherita? I mean, propaganda? Or was it because you were....
.... paid?
Yes, I mean, I don't want to offend you, but....
Let me answer you with another question, Ugo. I know that your career was as a scientist, right?
Right.
And you were paid to be a scientist, right?
Of course, yes.
But you believed in science, right?
I still do, Margherita..... Even though....
I understand. I know something about what's happening in your world. Yes, and I am sorry for the people like you who believed in science and were so badly betrayed by it. It was the same for me with Benito and the Fascist party. But, in the beginning, I believed in him. I deeply believed that Italy needed a man like him. How things change! He changed so much. It was as if a cancer devoured him from the inside. Yet, something of the old Benito remained. And, in a way, I can understand how that woman, Petacci, loved him to the point of following him to the end. A sad story; she didn't have to. I am sorry for her. But so things are. Sooner or later, everyone ends up where I am, in Hades.
Yes, you know, Margherita. I was wondering. It is not often that I see ghosts... are you some kind of....
You make me laugh, Ugo. No, I am not a psychopomp. I am not announcing your death!
Ah... that's nice to know!
I am happy to see that you are relieved! Anyway, it was a pleasure to speak with you. I understand that you are writing another novel, right?
Yes, it is about Mata Hari.
Oh, such a nice woman. I met her a few times here in Hades.
The way you say it, it seems that Hades is a nice place.
Not really, You'll find it boring, I think.
Well, so things are, I guess.
So things are. And have nice writing, Ugo. Maybe Mata Hari will come to visit you as a ghost, too. Let me disappear the way ghosts know how to do.......
______________________________________________________________________

Ugo Bardi's novel, "The Etruscan Quest," was published in 2023 by "Lu::Ce Edizioni". The story told in the novel takes place during the time of Fascism in Italy, and it touches many of the elements of madness that overcame the country at that time. Margherita Sarfatti, a real historical figure, makes a cameo appearance in the novel.
Here is Sarfatti's text that I described as "The Best Piece of Propaganda Ever Written"
More details about the Italian adventure in Ethiopia can be found in this post and this one.
This post was in part inspired by a conversation with Anastassia Makarieva

During the siege of Florence, in 1530, Michelangelo Buonarroti was actively fighting with the Florentine army. When the city fell, he was in danger, but someone hid him in town in a secret room under the Santo Spirito Church. This hiding place was not rediscovered until the 1970s, when the drawings he made during his period there were rediscovered. It is not open to the public, but I had a chance to visit it a few years ago. It is impressive to see the trapdoor built nearly 500 years ago still perfectly functioning, hidden under a heavy cabinet. And when you walk into the secret room, you can see Michelangelo's drawings on the walls, the sensation is that he had just left, a few days before. If you can see those drawings, and also other masterpiece by Michelangelo, it is a merit of the "Condottiere" Malatesta Baglioni who avoided a bloodshed by forcing Florence to surrender.
During the War of the League of Cognac (1526-1530), the condottiere Malatesta Baglioni was hired by the Florentine Republic to defend the city against the Imperial Army. In 1530, he switched sides. He ordered to turn the cannons of his army against his employers and to open the doors of the city to the besiegers. It was a quick fall for the Florentine Republic that from that moment ceased to exist forever.
It was a typical behavior of mercenary armies, one of the reasons why they have bad fame from the time of Machiavelli's "The Prince." (1517). Machiavelli didn't see the siege of Florence in 1530 (he died in 1527), but what he wrote was prophetic.
"Mercenaries and auxiliaries are useless and dangerous, and any ruler who relies on them to defend his state will be insecure and in peril ... Why? Because they have no affection for you, and no reason to go to battle except the small wages you pay them, and those aren't enough to make them willing to die for you!Correct, but wait one moment. Does that mean that mercenary armies are an evil to be stamped out from the surface of the Earth? If we look at the details, Malatesta Baglioni switching sides in 1530 was not so much a "betrayal" as a masterpiece of diplomacy. It came one week after the main army of the Florentine Republic was decisively defeated by the Imperials at Gavinana. At that point, the war was over, Florence had lost. And Baglioni acted in consequence. He avoided further bloodshed and, among other things, if you can still see the city of Florence in its full Renaissance glory, it is because the agreements that led to the surrender in 1530 were honored by all the parties involved. The city was not sacked, and the citizens' lives were spared.
Not that mercenaries won't occasionally engage in sacking cities and massacring civilians (there are a few examples in history) but, on the whole, they professionals, interested mainly in making money. If you can pay them to fight, you can also pay them to stop fighting. That's unlike the behavior of soldiers of national armies, often motivated by propaganda to hate their enemies. They will often fight to the end, which is bad for them and for everyone.
So, let's try to compare the actions of Malatesta Baglioni with those of a much more recent mercenary condottiere; Yevgeny Prighozyn, and his "Wagner" troops. There is a clear similarity between Baglioni turning his cannons against Florence and Prighozyn leading his tanks against Moscow. In both cases, we have a mercenary captain betraying his employers.
Baglioni acted on the perception that the Florentine Republic was already defeated, and he was correct. The Florentines didn't attempt to resist, choosing instead the path of least damage. Prighozyn may have acted on the basis of a similar perception, but he was completely wrong. We may speculate that he was banking on promises that he would be helped by forces inside or outside Russia if he were to switch sides. Maybe he expected a major Ukraine offensive, or an uprising in Moscow, or something else. But, as they say, the best plans of mice and men often gang agley. We'll never know for sure who pushed Prighozyn to rebel but, whoever they were, they betrayed him and left him and his soldiers alone against a much more powerful enemy: the whole Russian army.
The interesting part of this story is how the attempted uprising was relatively bloodless. Prighozyn's men found themselves facing annihilation a few hundred miles from Moscow. Even if their boss hadn't told them to turn tail, they would have surrendered. That must have been clear to the Moscow authorities, too, and they didn't try to annihilate the mercenary column. They have better uses for a few thousand trained soldiers than exterminating them. The whole story ended, if not satisfactorily for everyone, at least without bloodshed.
This is the good thing about mercenary armies. They are, in a sense, a step in the direction of purely robotic armies which will be the only ones fighting in the future. Robots don't fight for glory or for "the country;" they fight because they are programmed to fight. And their programmers probably think and behave like the "condottieri" of mercenary armies: they care mostly for money. War is never a good thing, but if it can be a little less bloody, it is at least an improvement.

The acrylic plexiglass dome of a modern submmersible is a technological marvel, but it is also extremely dangerous. A small crack and it is gone. It is what happene
In his "The World Until Yesterday," (2012) Jared Diamond tells how he seriously risked his life having boarded a boat managed by an incompetent crew. It is a story that resonates with that of the recent case of the wreck of the Titan submersible and its passengers. How could it be that they had accepted to embark on such a risky enterprise is hard for most of us to understand, and paying a lot of money for it, too. It can only be explained by considerations about how the mind of rich and powerful people works.
In Diamond's book, you can find a fascinating discussion of how traditional societies deal with risk. Diamond makes a convincing argument that our ancestors, just like people living in modern traditional societies, were much more careful, even paranoid, in comparison with most of us. He tells us how his Papua friends spent an inordinate amount of time discussing whether a broken twig they had found was the result of someone having been there before or just an effect of the wind. It is paranoia, yes, but if they reason in this way, it must be because that attitude helped their ancestors to survive.
Now, think of our society. It is true that we encourage risk-taking. It has a logic. Risks are risks, but the rewards you can reap in our world are enormously larger than anything a person living in a tribal society could hope to obtain. By acting crazy, you may become the local big man, maybe, but the rewards are not so large: there is no money to accumulate in a small village
But, in our world, rewards can be enormous if you are enormously lucky. Think of Benito Mussolini: an elementary school teacher who barely escaped death in the trenches of WWI. Then he set up a political party, and he launched his followers marching on Rome. They could have been crushed by the Italian army and Mussolini himself was ready to escape to Switzerland. But the King of Italy refused to give the order and then Mussolini became the absolute ruler of Italy for more than 20 years. It is true that eventually his luck ran out but, from a genetic viewpoint, he was hugely successful. Some sources say he had at least 11 illegitimate children, plus five legitimate ones.
I think it is not just a question of having been lucky, once. Mussolini came to think that his luck was not just a random event, but a feature of their life. You can read of this attitude in the diary that Mussolini's son-in-law kept. He truly thought he was infallible and even immortal. Late in his career, Mussolini thought he could get away with murder -- actually with genocide. He did, until he didn't anymore.
There are other cases of rulers who interpreted their luck as a manifestation of supernatural benevolence toward them by the almighty powers. Hitler was another case; he too barely survived the trenches of WWI, and it is said that he thought he was immortal. Until he discovered he wasn't. Probably, Saddam Hussein reasoned in the same way when he launched the ill-fated attack on Kuwait in 1991.
The case of the four rich passengers who boarded the Titan submarine in 2023 is probably similar. They people may have been thinking they were immortal, enough to make them engage in this reckless idea. Apart from the human tragedy of their death, the point this story raises is that they may well be representative of the elites ruling us today. They are reckless and convinced to be always right and even immortal. It is a deadly combination for people who control enormously powerful weapons: from nuclear warheads to propaganda. Deadly for them, but not just for them.

And now, no more shall my prophecy peer forth from behind a veillike a new-wedded brideBut it will rush upon me clear as a fresh wind blowing against the sun's uprising so as to dash against its rays, like a wave, a woe far mightier than mine. No more by riddles will I instruct you. And bear me witness, as, running close behind, I scent the track of crimes done long ago. For from this roof never departs a choir chanting in unison, but singing no harmonious tune; for it tells not of good.
Aeschilus, Agamemnon

The different Names of our living God embed beautiful and precious promises in them.
Have you experienced the providence of your Jehovah Jireh?
Has the unexplainable peace of Jehovah Shalom quietened your deepest anxieties?
Have you brought your broken hearts and crushed spirits to Jehovah Rapha who can heal you physically, spiritually, mentally, and emotionally?
The eyes of El-Roi search the whole earth in order to strengthen the hearts of those committed to Him.
How have you lifted the banner of Jehovah Nissi in your battle against the world today?
In the person of His only Son, Jesus Christ, Jehovah Tsidekenu offers righteousness to all who believe.
Do we look forward in faith, to the time when we can live together with Jehovah Shammah in all His glory?
Imagine the power in a name.
Is it not amazing how He communicates with us even through His name? These are but a few of the many names of God found in the pages of the Bible, that sparkle like a star-studded sky. They spur our hearts to seek Him and renew our desire to put a face to these names.
His Face. To these Names.
:)
On March 9th, the UK's Climate Change Committee concluded that the UK could meet its electricity needs in 2035 and 2050 with a mixture of renewables, nuclear and what it calls 'low-carbon dispatchable generation', plus a small amount of unabated natural gas.[1] It made its positive assessment by studying typical and extreme weather patterns in the past. It then calculated whether the possible portfolio of wind, solar and nuclear envisaged by government targets would generate sufficient power, if combined with some combination of storage, natural gas with CCS, and hydrogen. The conclusion was that the transition is possible, even alongside a 50% rise in electricity consumption by 2035 and a doubling by 2050. But it also said that the current pace of installation was insufficient to meet the targets for decarbonisation.
I wrote some comments in the note below, including a query as to whether the enormous cost (and difficulty) of electricity transmission upgrades is being fully considered. Extra infrastructure may double the cost of the new electricity generation capacity.
***
Many energy commentators reacted with enthusiasm to the CCC's work. The report was seen as a strong signal to the UK government, and to the many sceptics, that a renewables-based system can - very largely - drive unabated natural gas off the country's electricity grid. And it is indeed a very impressive piece of analysis; its workings are detailed without being obscure.
For the first time, the CCC sees a potentially large role for hydrogen as the key balancing energy source in the electricity system. When the wind is blowing hard, surplus power will be sent to electrolysers where it will be turned into hydrogen. The hydrogen will be stored in salt caverns beneath the ground and combusted in gas turbines when the wind is still.
The CCC leaves the precise size of the hydrogen contribution unclear, saying that the cost compared to natural gas with CCS is not certain. So it merges abated gas and hydrogen into 'low carbon dispatchable generation' without being wholly specific about the share of hydrogen. It is also ambivalent about the role of electrolysis versus autothermal reforming of natural gas to make the product.
Nevertheless, for those of us who have been pushing the importance of hydrogen for storage of electricity for several years, this is an important moment. The language of the document is entirely different from a previous 2018 CCC report on hydrogen which concluded
'the low overall efficiency of electrolysis and the relatively high value of using electricity as an input mean that the costs of producing bulk electrolytic hydrogen within the UK are likely to be high.'[2]
That language has now completely changed with an acceptance that the role of hydrogen is to take electricity at times when power prices are very low and store it for periods when prices are high. Table 3.1 in the recent CCC report gives a figure of just £22 per megawatt hour for hydrogen production for 2035 (but in 2012 prices).
The world's most respected climate agency has given the argument for 'renewables plus hydrogen' a good chance to break through into the policy mainstream.
Let's briefly look at the key aspects of the work. This is not to question the main thrust of the conclusions but to examine their implications.
1, The report essentially uses government targets for renewables installations as the basis of its figures. The figures for new capacity are not independently generated.
By 2030, the UK plan is to have more than 50 GW of offshore wind, compared to about 15 GW today. That means an installation rate of about 7 GW a year, a demanding target. But the CCC appears to use the 50 GW 2030 target as its estimate of 2035 capacity.
For onshore wind, the CCC is much less bullish, assuming 28 GW in 2035, up from about 13 GW today. The implied installation rate is less than 2 GW a year. Even this is probably unlikely unless the UK government reverses its effective ban on onshore wind in England and Wales. Scottish development isn't sufficiently fast. Solar rises by about 55 GW before 2035, up from about 15 GW today. The estimates for 2050 requirements are 115 GW offshore, 31 GW onshore and 105 GW of solar.
2, Because this is the stated government view, the critical assumption that the CCC has had to run with is that new nuclear will become an important part of the UK's portfolio. By 2050, the estimate used is for 24 GW of operational nuclear, which will cover about a third of the UK's total electricity need. 10 GW is assumed to be available in 2035.
Is this likely? No, it is not. Sizewell B will probably decommission that year, the last existing nuclear plant in the UK. Hinkley Point C, possibly to be completed mid-decade, has a capacity of 3.2 GW. So two more new nuclear plants will needed in the next twelve years. One has to be a blind optimist to believe that this is possible. And, of course, the price will probably be more than twice than that for wind or solar.
The likelihood is that the UK will construct no more than a couple of new nuclear plants. The key implication is therefore that we will need more wind and more solar than the CCC says. Very roughly, the likelihood is that instead of 115 GW of offshore wind, about 150 GW will be needed. The key effect on the CCC's arguments is that because wind is variable, the amount of hydrogen capacity needed for storage will be much more than they predict.
3, The CCC does not extensively deal with the interaction between the EU energy markets and those of Great Britain. This is important, but is unfortunately typical of most official documents across energy and other policy areas. Yes, there is mention of electricity interconnectors but it seems to be assumed that EU countries will accept a large portion of GB surpluses. This is unlikely because at times of UK high winds, most of northern Europe will be similarly harvesting overwhelming yields of electricity. As I write this on Monday 13th February, the UK's wind is providing over 20 GW of power, while in Denmark turbines are currently giving more to the Danish grid than the entire national electricity consumption.
The modelling behind the CCC work appears not consider this problem, perhaps because of an assumption that other countries will not invest as extensively in new wind capacity. But, for example, the Netherlands government has a target of 70 GW of offshore wind by 2050, a figure that would provide almost three times the current Dutch power needs over the course of the year. Netherlands producers will be wanted to export at exactly the same time as UK wind farms. As far as I could see, there was no mention of this in the entire CCC report. Other northern European countries also have major (and well-documented) strategies to expand offshore wind.
4, There are similar problems with the discussion of hydrogen interconnectivity. Although there is mention of pipelines in the CCC report, there seems to be an absence of consideration of the effect of the development of a full European hydrogen network. Moving energy around in pipelines, even over several thousand kilometres, is very much cheaper than using electricity networks. (There is a good reason why UK domestic electricity bills have a charge of transmission and distribution that is four times the fee for gas per kilowatt hour!). If we need more hydrogen, the cheapest way to get it will probably be through the proposed EU pipeline system, probably partly fed from northern European wind and hydro and north African solar. The UK energy system - both electricity and hydrogen - will almost certainly be very much more tightly integrated with Europe than the CCC suggests. Once again, one presumes this is because wider UK government policy does not want to acknowledge the utterly central role of links to the mainland (and Ireland) in our energy policy.
5, The CCC mentions extensively, but does not fully quantify, the striking requirements that the UK has to improve its electricity transmission and distribution systems in order to make the 'renewables plus hydrogen' transition possible. This issue needs urgently to be bought to the forefront of our discussions. As with many other European countries, the development of new electricity resources, and the electrification of heating and transport, is being impeded by the lack of capacity in both high voltage and low voltage segments. The unrecognised reality is that upgrading our infrastructure may cost as much as the whole of the extra renewables installations in the period to 2050. And, unfortunately, much of the required investment will have to be made well before the new capacity comes on line. Which will mean businesses and families paying for the full transition soon, and before the majority of the benefits show. By the way, this problem affects most other advanced countries as well.
The tables below show some indication of the scale of the challenge facing supporting infrastructure by comparing the cost of new renewables to the cost of new electricity transmission and distribution. I have had to use estimates for many of these calculations but I think they are broadly correct. My logic is in the appendix below.
The cost of new renewables to 2050
a) Offshore wind at £1.5billion a gigawatt = £150bn
b) Onshore wind at £1 billion a gigawatt = £18bn
c) Solar at £0.5 billion a gigawatt = £45bn
Total = £213bn
The cost of supporting infrastructure
a) Distribution networks (i.e. DNO spend) = £60-180bn (source page 66 CCC report)
b) Transmission network (i.e. ESO spend) =
· Offshore wind at £0.6 billion per gigawatt = £60 bn
· Onshore wind at £0.3 billion per gigawatt = £5.4bn
· Solar at £0.2 billion per gigawatt = £18bn
Total = £143.4 - £263.1bn
Under some projections, the cost of infrastructure upgrades to allow full use of renewables will therefore exceed the cost of the installations themselves. The unfortunate implication is that the Levelised Cost of Renewables infrastructure may approximately double the cost of the electricity produced by these installations. That is a very tough conclusion for those of us who want a rapid transition.
Appendix.
The cost of renewables is taken from recent figures published about very large scale projects, slightly reduced to take into account likely cost cuts over the next decade.
The cost of distribution (essentially the low voltage networks that take power to buildings) is taken from the CCC report.
The cost of transmission infrastructure is calculated from a recent Ofgem estimate that the cost onshore of putting 50 GW offshore in place by 2030 is about £21bn. See the summary by lawyers CMS at https://cms-lawnow.com/en/ealerts/2023/01/accelerating-onshore-electricity-transmission-investment-a-step-forward-for-low-carbon-generation.
Onshore wind and solar will require less investment in transmission per gigawatt. Many schemes will actually connect to the distribution system, not the National Grid. I have roughly estimated a figure of £0.3bn per gigawatt for wind and £0.2 per gigawatt for solar based on the offshore numbers.
[1] https://www.theccc.org.uk/2023/03/09/a-reliable-secure-and-decarbonised-power-system-by-2035-is-possible-but-not-at-this-pace-of-delivery/
[2] https://www.theccc.org.uk/publication/hydrogen-in-a-low-carbon-economy/
People in Denmark living close to a new wind turbine or solar farm receive a yearly payment. In most cases, the amount corresponds to the value of the output of 6.5 kilowatts from the new renewable generator. I think the UK should consider a similar scheme here, but probably more generous - to increase local support for wind and solar power. We need to rapidly unlock the exploitation of the country's fabulous coastal (and some inland) wind resources.
Details of the Danish scheme (full text at bottom of page)
· Any household living within 8 times the height of a wind turbine or 200 metres from the nearest solar panel is eligible. The average new onshore turbine (measured to the highest tip) is likely to be around 100 metres, implying a qualifying distance of up to 800 metres.
· Each household is awarded the value of the output of 6.5 kilowatts both for solar and wind.
· The maximum proportion of the output of the wind or solar site that can be paid to local householders is 1.5% of the total. In the event that 6.5 kilowatts multiplied by the number of eligible homes would exceed 1.5%, the value of the payment is cut proportionately so that the total does not go over this limit.
Householders have to apply for the payment.
What would be the implications of this scheme if used in the UK?
· 6.5 kilowatts of wind power is likely to produce about 19 megawatt hours a year on a reasonable site close to a coast. (33% capacity factor assumed). At a value of £60 per megawatt hour, the payment would be about £1,100 per year.
· 6.5 kilowatts of solar power should achieve slightly more than 6 megawatt hours a year on the coasts or in the southern part of England. (11% capacity factor assumed). This would generate a payment of about £375.
Of course, the numbers in March 2023 would be much larger because of the unusually high prices for wholesale electricity. They might be double these levels.
Would the cap of 1.5% of output typically come into play?
· A new onshore turbine installed in 2023 might have an maximum output of 4 megawatts. Therefore the 1.5% maximum would be 60 kilowatts, meaning only 9 households could benefit before the annual payment was scaled back.
· A solar farm typically could have a capacity of 10 megawatts. This would allow 23 households to benefit before proportional cuts were made.
What changes might make this work for the UK?
We know there is broad support for wind and solar, even if it is developed in the immediate proximity. The UK government has just published its latest opinion survey on the topic.[1] This shows that only 12% would be unhappy about a wind farm in their local area and 7% similarly opposed to solar. (However these figures may be slightly inaccurate because some respondents said that a solar or wind farm would be impossible in their area and therefore didn't say whether they opposed them or not). For comparison, only 4% of people are generally unhappy with solar, wherever it is sited, and 11% oppose wind.
My guess - and of course it is only a guess - is that the payments might need to rise to a maximum of 3% of the revenue of the renewable site and payments be made corresponding to up to 10 kW of capacity. This could extend up to 1km from a turbine and 300 metres from a solar farm.
This would mean that a home in a wind turbine's area might get £1,700 a year at a 'normal' wholesale electricity price of £60. That would be greater than the typical electricity bill. Solar would provide a fee of just under £600.
Perhaps these bonuses would help bring local communities behind new renewables developments. And allow elected politicians to actively support them, rather than almost universally oppose them for fear of the consequences at the next polling date. It might unlock the London's government's almost total ban on new English wind.
Most importantly, it would give local people a sense of de facto ownership of the asset. In my experience, nothing promotes wind or solar better than the feeling that every time the sun comes from behind the clouds, or the turbine spins once, a small amount of money has been earned.
[1]https://assets.publishing.service.gov.uk/government/uploads/system/uploads/attachment_data/file/1140685/BEIS_PAT_Winter_2022_Energy_Infrastructure_and_Energy_Sources.pdf
I am very grateful to my daughter Ursula Brewer, operations manager at solar developer Better Energy in Copenhagen, for informing me about the Danish scheme.

As you all know by now, we're causing the world to heat up. We've not got to a stage where we've stabilised the global temperature. In fact, we seem to be nowhere near stabilisation. Yet strangely there are still a few global warming deniers floating about. These deniers are arguing once again that an ice age is coming, or it's started cooling, or global warming has stopped, or "CO2 warming is a hoax" or some such nonsense. It's prompted me to write another article about how global temperature has been changing.
According to GISS NASA, the average global surface temperature anomaly for 2022 was 0.89 °C. This is 0.13°C below the hottest year so far. The hottest was 2020 at 1.02°C above the 1951 to 1980 average.
Below is a chart of the average of 12 months to December each year.
Figure 1 | Global mean surface temperature anomaly for the 12 months to December each year. The base period is 1951-1980. Data source: GISS NASA
As you may know, each of the five decades since 1972-1981 has been hotter than the previous one. The chart below shows how the world has been heating up since early last century. The chart includes a dotted line showing the mean annual temperature for the 20th century. Let's see what next year brings, especially if there is another El Nino.

Figure 2 | Global mean surface temperature anomaly by decade. The base period is 1951-1980. Data source: GISS NASA
I've also included a chart grouped by averages over 20 year periods showing how the rate of warming increased quite a bit over the latest 20 year period.

Figure 3 | Global mean surface temperature anomaly by 20 year periods. The base period is 1951-1980. Data source: GISS NASA
It's the increase in greenhouse gas that's causing warming!
Climate disinformers still exist, would you believe. Even after all the weather disasters of the past twenty years or so, there are still people who spread lies for various reasons.
Peter Sinclair has talked about this on Climate Denial Crock of the Week. Apparently one of the "paid to disinform" brigade is running about shouting "CO2 warming is a hoax". It's no longer hard to believe that even Elon Musk has been spreading denial on Twitter, which he seems to have bought (for $44bn, mind you) mainly to promote the spread of harmful lies and neo-fascist propaganda. (It's changed from being social media to becoming his personal anti-social blog).
Anyway, about that junk science claim. To support his latest greenhouse gas denial, Milloy claims there has been cooling for the last eight years, since 2015. He wrote: "Per NOAA data, we have emitted ~450 billion tons of CO2 since 2015 (14% of total manmade atmospheric CO2) yet the planet has cooled."
The claim of cooling from 2015 is obviously nonsensical cherry-picking, which plenty of other people have pointed out. The average temperature for the past 8 years from 2015 to 2022 inclusive is 0.93°C above the 1951 to 1980 mean. The last 8 years has seen the biggest single increase of all, a whopping 0.27C. Before that, the biggest 8 year increase was 0.17C in the period 1999 to 2006 inclusive.
Here's a chart showing the rise in global temperatures to 2022, in eight year blocks.

Figure 4 | Global mean surface temperature anomaly in 8 year blocks. The base period is 1951-1980. Data source: GISS NASA
That's not all. Milloy, who tweets as @junkscience (which is what it is), wimped out on a prediction. He obviously couldn't bring himself to make an ice age cometh claim. That would be too silly, even for him. Instead he predicted that if there was an El Nino this year the global temperature would rise. Duh! He added that when it finished the temperature would "steady/slightly decline (again) as El Nino ebbs". That's not as certain, but the odds are that will happen, too.
However! Notice that Milloy doesn't mention the last three years of La Nina, which has a cooling effect on temperature - if all else is equal, which it isn't!
To show his cherry pick more clearly. The first chart shows the period Milloy is using for his false claim that greenhouse gases don't keep the earth warm. As you can see, Milloy used the old, tired denier ploy of starting with two years of El Nino (hot years), and finishing in the third year of La Nina (slighly less hot years).

Figure 5 | Mean surface temperature anomalies from 2015 to 2022 from the 1951-1980 mean. Blue columns are La Nina years and orange columns and El Nino years. Data sources: GISS NASA and Bureau of Meteorology, Australia.
The second chart shows it in context of 50 years of warming. Each

Figure 6 | Mean surface temperature anomalies from 1973 to 2022 from the 1951-1980 mean. Blue columns are La Nina years and orange columns and El Nino years. Data sources: GISS NASA and Bureau of Meteorology, Australia.
Now what the sharp-eyed and even the less eagle-eyed among you may notice is the El Nino years are getting hotter and the La Nina years are also getting hotter. It's not ENSO that's causing global warming. It's the greenhouse gas we're putting into the atmosphere, a large portion of which are all the waste products from the fossil fuels we're burning.
Cold blasts of hot air from the pastHere's a reminder of denier desperation and how disinformers have been feeding the deluded with false claims of "it hasn't warmed since" since, well, certainly since I've been blogging. In June 2013 I pointed out the absurdity when Anthony Watts' denier blog, WattsUpWithThat claimed it hadn't warmed since 1980, which was ridiculously wrong at the time, and it's warmed a lot more since then. Moving from the absurd to the more absurd, in October 2017 denier Anthony Watts crowed "it hasn't warmed since 2016". (2016 was a very hot El Nino year, yet 2020 was even hotter and there wasn't an El Nino that year.)
Where was it hot in 2022?
Last year was again hot almost everywhere. On the charts below as the legend shows, blue is for below the 1951-1980 average, and yellow/orange/red is above. Move the arrow at the left to the right to compare 2022 with 2020, which was the hottest year on record (so far). The cooler Pacific region of La Nina is clearly visible on the 2022 map.


Figure 6 | Maps showing mean surface temperature anomalies for 2022 and 2020 from the 1951-1980 mean. Data source: GISS NASA
 Victor Venema died last week. His friends, colleagues and everyone who knew of him were shocked and felt an immense sadness when his friend and colleague, Frank Sonntag, let us know.
Victor Venema was a climate scientist in the Meteorological Institute, University of Bonn, Germany. His main scientific interest was in the variability of data in complex systems. In particular, the study of variability in weather data and homogenization. In his own words (archived):
"At the moment most of my work and this blog is about the removal of non-climatic changes (variability) from historical stations data, which is called homogenization."
Dr Venema contributed to climate science on many fronts beyond the university. He was an advocate for open science, inclusivity in science, scientific communication and bringing science to the general public. He did not merely advocate for change, he helped make change. He was active in various roles with the World Meteorological Organisation (WMO) over many years. He was Chair of the Parallel Observations Science Team (POST) of the International Surface Temperature Initiative (ISTI) and a member of the ISTI Benchmarking and Assessment working group. He was also prolific online, including with Climate Feedback and Hypothesis, a web tool that enabled experts and others to comment on articles published on the web. He was very keen to overcome language and other barriers including through GrassRoots Journals and the Translate Science initiative. (I've probably left out many of his contributions and achievements.)
Victor was a keen observer of behaviour on social media. On occasion he referred to some aspects as "toxic", particularly on Twitter and on climate science denial blogs. Once again, he wasn't just talk. Together with Frank Sonntag, he set up an instance for scientists at Mastodon, FediScience.org.
Victor was a wonderful science communicator. He was able to explain otherwise difficult concepts in ways that everyone, scientist or not, could understand. It was Eli Rabbet on RabbetRun who first introduced me to his blog. It was hard to resist his wit, perspicacity and disdain of efforts from deniers to claim that climate science is a hoax. Back in 2012, Victor wrote an article "Blog review of the Watts et al. (2012) manuscript on surface temperature trends". He also wrote a blog article on one of the points science deniers seemed unable to understand with weather data, "A short introduction to the time of observation bias and its correction." (Watts later promised a rebuttal to his own paper, which has yet to see the light of day.)
Victor was a regular commenter at HotWhopper almost from its beginning. He supported my efforts publicly and in private over many years. We shared the same sense of humour. Victor was a valued friend to me and to many, many people. (See also the tribute at ATTP - ...and Then There's Physics.) His death is a great loss to me personally, to climate science, to science in general, and to the world at large.
In his most recent blog post, Victor wrote: "Dying is naturally not nice for the ones you leave behind." It is not nice at all, particularly with someone young who gave so much to so many. His work doing and explaining science and making science open and more inclusive will endure.

Anesthesia is a very 'hands-on' department. It requires a lot of skill to advance needles (in various places!) with just the right amount of pressure when administering anesthetic drugs prior to surgery.
Steady hands. Nimble fingers.
It may be easy to assume that anesthesiologists hold a lot of power in their hands when we do things quickly. It may be easier to think that a simple needle or catheter insertion has nothing to do with God or His hands either. I have always wanted to "paint" myself a reminder of the fact that - it is always His power that works through me.
Was. Is. And will be.
For as long as He has allowed it.
Underneath are His everlasting arms, keeping me steady.
"Praise the Lord, who is my rock. He trains my hands for war and gives my fingers skill for battle." Psalm 144:1
I've been with the same hosting company for many years. Yesterday (Australian time), first time ever, their email servers went down for several hours. It's back again now.
If anyone tried to send an email during that time, particularly anyone who is wanting to subscribe to email alerts, please try again. I'm referring to the article I posted a couple of days ago.

The IPCC Summary for Policymakers WG1 report has just been released. You can download it here.
I will be going through it and the technical summary (when it comes out) over the next few days. An initial glance shows that we need to do more to reduce emissions. A whole lot more.
The press conference is on YouTube:
This report will have a lot more space devoted to regional changes. There is a fabulous interactive atlas which allows you to drill down and across in all sorts of ways.
There is so much to work through. Here are some initial points that might interest you:
- It's still possible to keep global warming to <2C if we get to zero emissions by 2050. If we keep the same rate, we'll prob hit 2C by mid-century.
- "Climate change is already affecting every inhabited region across the globe with human influence contributing to many observed changes in weather and climate extremes"
- There has been an increase in the lower bound of climate sensitivity, which is now more confidently estimated at between 2C and 5C, with a "likely range of 2.5°C to 4°C (high confidence), compared to 1.5°C to 4.5°C in AR5, which did not provide a best estimate."
- "Global warming of 1.5°C relative to 1850-1900 would be exceeded during the 21st century under the intermediate, high and very high scenarios considered in this report"
- "It is virtually certain that the Arctic will continue to warm more than global surface temperature, with high confidence above two times the rate of global warming."
- Of particular interest to Australia & USA, it is very likely droughts and floods will worsen, amplified by ENSO: "It is very likely that rainfall variability related to the El Niño-Southern Oscillation is projected to be amplified by the second half of the 21st century in the SSP2-4.5, SSP3-7.0 and SSP5-8.5 scenarios."
- As I've long expected, the oceans and surface won't keep absorbing CO2 at the current rate: "under the intermediate scenario that stabilizes atmospheric CO2 concentrations this century (SSP2-4.5), the rates of CO2 taken up by the land and oceans are projected to decrease in the second half of the 21st century".
Andrew Dessler summed it up well, if a little crudely, on Twitter:
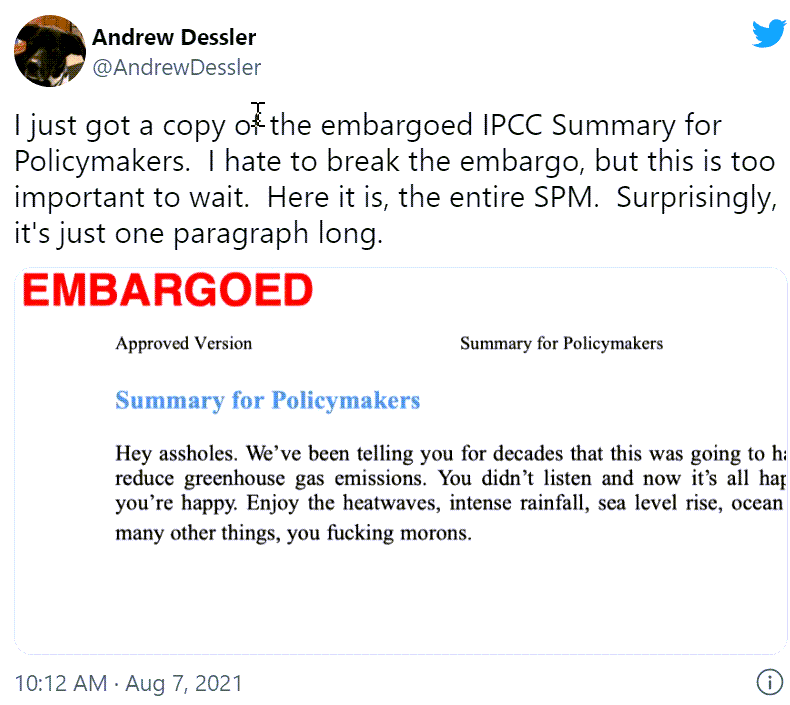
Further reading
There are lots of articles in the media already. Journos got advanced copy (bloggers didn't). Also other sources.
- Climate change report a 'code red for humanity', United Nations chief warns - from ABC News (Australia)
- Climate crisis 'unequivocally' caused by human activities, says IPCC report - from the Guardian (UK)
- IPCC report's verdict on climate crimes of humanity: guilty as hell - also from the Guardian
- UN report: Earth warming likely to pass limit set by leaders - from the Washington Post
- A Hotter Future Is Certain, Climate Panel Warns. But How Hot Is Up to Us - from the New York Times
- Australian weather extremes to get more extreme as climate heats: IPCC - from the Sydney Morning Herald
- This is the most sobering report card yet on climate change and Earth's future. Here's what you need to know - by Pep Canadell at The Conversation
Sorry for not following up my last post sooner. There'll be another climate post shortly.
 My excuse is being consumed by the Delta variant of SARS-CoV-2. Not me personally, I hasten to add. It's a big problem in the state next door, NSW, and has slipped from there into my home state, Victoria, a couple of times (and other parts of Australia). That's meant lockdowns to get us back to zero COVID-19. Having a slightly obsessive tendency, I've been spending too much time on the endless press conferences, news articles and tweets about the subject. This has been at the expense of writing blog articles about climate change, I'm sorry to say.
 While I'm preparing the next article (or procrastinating on its writing) I want to alert people who signed up for email alerts to new articles here on HotWhopper. The normal emails will stop because Feedburner is being shut down this month. Here's the notice:
Recently, the Feedburner team released a system update announcement , that the email subscription service will be discontinued in August 2021.
After August 2021, your feed will still continue to work, but the automated emails to your subscribers will no longer be supported. If you'd like to continue sending emails, you can download your subscriber contacts.
If you'd like to continue to receive email alerts, please let me know directly, using the email address to which you want them sent. You can do the same if you no longer want alerts, although the subs will be opt-in, not opt-out. That is, if you don't let me know you want to continue, you will no longer receive email updates.
You can let me know either way by sending an email to subscribeHW at HotWhopper.com (replacing the "at" with @) or clicking on the link. If you're already a subscriber, you should be receiving this article as an email already, but the emailed articles will only continue if I set it up. I'll probably use mailchimp, which AFAIK is reliable and secure.

What would be worse than a Republican US government that doesn't believe in climate change? Perhaps, a Republican US government that does believe in climate change.
Try a thought experiment. Assume Republicans fully accept human activity, in particular burning fossil fuel, causes global warming. Now, I'm not a political scientist, but it seems to me that a major plank of US right wing philosophy is "preserve the American way of life", and that their foreign policy gives primacy to US interests. (Of course many other countries have a similar philosophy, but don't have the firepower to back it up.)
Now, continue the thought experiment: How can these Republican Climate Hawks square the circle of reducing the impact of global warming on the US, while preserving the American Way of Life?

Geo-engineering looks like a really attractive option. Not only does it — in theory — avoid the need to reduce fossil fuel consumption, but it also creates huge opportunities for space technology, defence contractors etc. And if the rest of the world doesn't agree? The US will have to save the rest of the world for their own good.
The chances of success of geo-engineering, and the possible side effects, are impossible to know. But that argument hasn't held back the war on drugs or the war on terror. Of course, if we changed track with those policies, we could try new ones.
Today I'm going to tackle a difficult but important topic - internal conflict. Given the number of people involved, the number and complexity of the issues, and the decades over which the climate movement is likely to be needed, it's a pipe dream to think there will always be harmony. At the same time, if the sort of problems mentioned here aren't acknowledged and, preferably, dealt with well, they can spread and become very destructive. Sweeping things under the carpet, pretending conflict doesn't exist, only allows it to fester and grow.
When a large number of people are working toward a common purpose, it is inevitable there will be internal politics. (If you prefer "virtually inevitable" or "almost inevitable", I'd love you to point out an instance that's been free of this.)
In this article, I'll use the word "movement". I don't like to apply that term to mitigating and adapting to climate change (which is bigger than any movement); however, in the context of this article it's the best word I've been able to come up with.
Everyone who works in an organisation for even a short time, understands internal politics have an influence on decisions, behaviour, alliances, staff promotions and so on. The same goes for any movement, whether it's related to broad social justice, climate change, anti-litter, health, equal opportunity, local politics or anything where a dozen or more people come together around a common purpose.
Conflicts can arise for any number of reasons, some that could be regarded as fundamental, and some are confusingly petty and vindictive. Here are several to watch out for:
- "Means and methods" camps - opposing camps can emerge having fundamentally different and, perhaps, opposing views on how to achieve the common purpose (nuclear vs anti-nuclear; all adaptation no mitigation vs mitigation plus adaptation etc.)
- Personalities and personal ambition - with camps emerging based on individuals within the overall movement (personality cults). These can arise if it's thought there will be personal reward for the personality or the follower (such as fame, career progression, book contracts, committee posts, awards, or other personal recognition). I'm not having a dig at our climate champions. We need them and most leaders in the climate movement are above petty politics. It's wannabes and people scrambling to position themselves where this can become a problem.
- Ideology and political leanings - dismissing and therefore alienating large segments of society based on their politics or ideology (hard left vs left vs centre vs right vs extreme right).
- Position on other causes - dismissing and alienating individuals or segments of society based on their opinions or actions or perceived level of support for other causes - e.g. do they give equal or better attention to social causes (feminist, BLM, gender issues, voting rights etc) and if it's not seen as good enough, if they're seen to be mainly focused on climate, they must be bad people.
- Personal attributes - dismissing or alienating people on the basis of attributes such as sex, gender, skin colour, ethnic origin, cultural background, religion or lack of, sexual preference, education level, political allegiance, friends, colleagues, profession, or opinions expressed on matters unrelated to that common purpose. E.g. all men are bastards, particularly if they are white baby boomers.
The most toxic behaviours I see are related to points 1 and 2 above, and to a lesser extent points 4 and 5. These can (usually by intent) elicit emotive rather than rational responses - anger, hurt feelings, public naming and shaming of individuals whether deserved or not (i.e. straight up defamation). All of this leads to a weakening of the movement making it less able to focus on the common purpose. It can result in fragmentation, a muddying of the waters. It can cause hard-working, committed people to be disillusioned and give up. It can confuse the general public if it spills over into the mass media, reducing their understanding of the important issues.
I'm no mediator. That's not my training or talent. I think I am able to see most things clearly but when it comes to helping people work through personal differences, I defer to people who are expert in that area. I'm not a political animal either, normally being more of an onlooker than a participant. At the same time, as you know, I'm not likely to do nothing when I see good people being unfairly maligned. (Mostly I've addressed malinging by climate science deniers, yet this sort of ugliness has been happening within the climate movement too.)
I don't really want to say much more on this topic. These matters need to be dealt with internally by the more responsible and able members of the movement, rather than airing all the gory details in public (which can in turn cause a lot of harm). I know I've sometimes been a bit intemperate myself, dashing off an angry tweet or two and maybe going a bit overboard in articles here from time to time. I'll keep trying to do better, though I still won't hesitate to call out and ridicule climate science denial.
This article is more by way of reminder and a caution. If you're tempted to join a camp or become a groupie to a personality - just take care you're doing it with your eyes wide open and with good reason. Avoid taking at face value everything someone you might admire says. Do what you can to keep the movement healthy. Stay focused on the common purpose.
Then all the usual things - be prepared to change your mind if the information changes. Forgive individuals if they make what you regard as a mistake now and then. At the same time, watch out for people who exhibit ongoing patterns of toxic behaviour, who may not be as trustworthy or authentic as all that (to use another word I very much dislike), who might be using you and/or abusing others for their own purposes. Remember, you might very well become their next target.
In the end, people come and go, but the issues remain. Harnessing yourself to a particular individual may not be the most productive path in the long term. In the same vein, tying yourself to a particular and very narrow means of achieving the goal could limit the chances of getting there.
Welcome - and please help the world address the problems of climate changeThe climate movement must remain broad and diverse, welcoming people from all over, with all our flaws, with all our brilliant ideas including conflicting ones, and with all our efforts - if it is to achieve the results we must.
-------------------------
We've had a tough few months with more and worse fires, drought, floods, heat waves, disappearing glaciers, water supply problems, rising seas and a global pandemic.
There's much more to be done.
It's nice to be back, and quite lovely to read your words of welcome here and on Twitter. Thank you.
Further readingHere are some relevant articles I came across in a Google search. I don't know if they're among the best examples. Although I've done some work to improve social justice over the years, I've never regarded myself as an activist so this is not my field. Given the sensitivies of social justice movements, the references might or might not be politically acceptable! If you know of other good articles, please add them in the comments.
Three Ways to Reduce Internal Conflict in Civil Resistance Movements - by Joel Preston Smith, September 20, 2018.
Conflict and Movements for Social Change: The Politics of Mediation and the Mediation of Politics - by Kenneth Cloke, July 2013
Crises and Conflicts in Social Movement Organisations by Jo Freeman, published in Chrysalis: A Magazine of Women's Culture, No. 5, 1978, pp. 43-51 - (just to show that internal conflict is timeless).
I spent a lot of time in western Canada in the early 1970s. That's 50 years ago for all you young ones. The world was very different then. Edmonton was experiencing it's longest winter since, almost, forever. It was a long cold winter. In the summer in British Columbia they kidnapped whoever happened to be in the local pubs to fight the annual forest fires, but the temperatures rarely exceeded 80F. It was what people thought of as a bit unusual but not completely abnormal.
Today the world is different. Hard to believe this week, but this is what we should have expected.
#Canada just had a temperature of nearly 50°C (Lytton, 49.6°C)
— World Meteorological Organization (@WMO) June 30, 2021
"Without human-induced climate change, it would have been almost impossible ...as the chances of natural occurrence is once every tens of thousands of years," says @metoffice scientist
Details https://t.co/fb1nIF8wny pic.twitter.com/rxKGmQqZZM
Western Canada is wondering if it has been relocated to Death Valley.
There was famine somewhere in the world back then as there is now, but today, all of a sudden we need to find food for three times as many people.
We're trying to get on top of a global pandemic that everyone says was anticipated but that no-one prepared for.
We've accepted and supported and elected leaders who aren't game to read the writing on the wall, aren't able to act, and keep pointing the finger at someone else for their inadequacies - anyone else will do.
We're looking to evangelical pastor's wives to "save the world", when they can't even stick up for their own supporters.
Alright - it's not all gloom and doom. There are some elected leaders in various countries around the world who are realists and who are keen to make sure the human race survives until at least 2100.
There are journos and communicators who are still quite sure, or at least hopeful, the message coming from the harbingers of knowledge and science will make its way through to political leaders, if not the general population. And that we'll act on it.
For even more good news - I'm coming back, soon, with some analysis and information about where we are today and what's in store. It won't be pretty.
Are you up for it?