After Paris and the COP21 climate talks, compare and contrast a couple of pop-sci graphs.
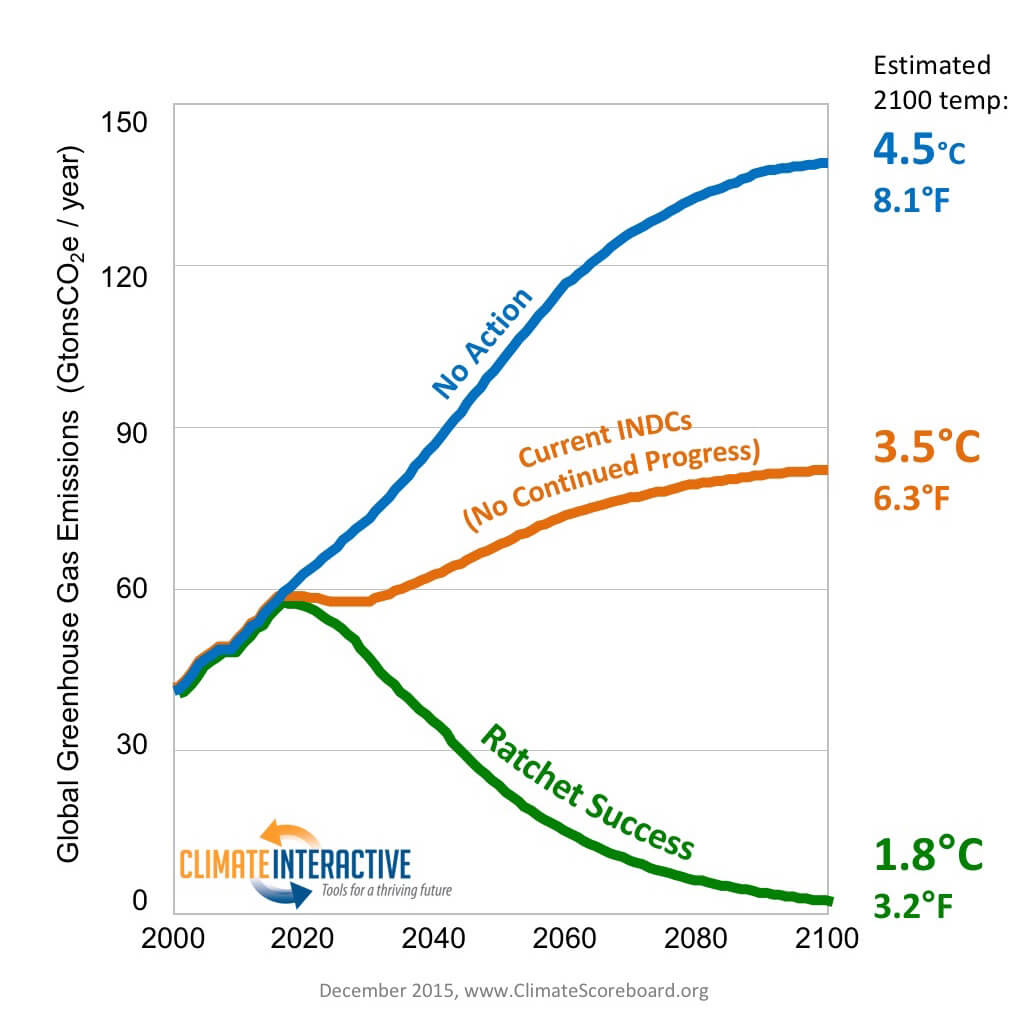
Climate change modelling based on the rate of carbon emissions, their effect on CO2 concentration and the resultant global average temperature.
https://www.climateinteractive.org/wp-content/uploads/2015/12/Ratchet-Success-Pathway-v16.jpg
vs
The Limits to Growth revisited on their 40th anniversary. An attempt to model the world economy via at least 8 interdependent variables. Where only one of them is pollution and where CO2 is only part of that.
http://www.newscientist.com/data/images/archive/2846/28462101.jpg
It's not clear at the moment which of the 3 obvious scenarios we'll follow. It's likely to be a mix of the three in different times and places.
1) Continue with business as usual and blow the #terafart of 1TtC into the atmosphere as fast as possible. For all the talk, this is what we're actually doing, following the worst case scenario from the IPCC.
2) Voluntarily reduce our carbon emissions along the lines of the Paris agreement. Too little, too late resulting in 4oC increase by 2100
3) Overshoot, crash and burn as we hit a whole series of fundamental limits before 2100. The actual detail is messy and unpredictable. This is where we don't blow all the carbon as other factors strike first.
One way in which this will be modified is that we will deploy large quantities of Solar, Wind and other renewable energy sources along with increased efficiencies. And it's not clear if this helps or if it simply hardens demand.
Or as somebody said last month, "Since we can't fix it as individuals and we can't get off the planet we might as well point out the interesting bits to each other as the ship sinks." and somebody else replied, "that doesn't sound terribly cheerful. I've got kids on that thing"
via
https://www.climateinteractive.org/
https://www.climateinteractive.org/tools/scoreboard/
https://www.newscientist.com/article/mg21328462-100-boom-and-doom-revisiting-prophecies-of-collapse/
www.climateinteractive.org/wp-content/uploads/2015/12/Ratchet-Success-Pathway-v16.jpg